The Smart Money Method: How to pick stocks like a hedge fund pro – on Asymmetric Payoffs

One of my recent reads is The Smart Money Method: How to pick stocks like a hedge fund pro (November 24, 2020) by Stephen Clapham.

Naturally, when he mentioned “Asymmetric Pay-offs” I have to share the quote:

ASYMMETRIC PAY-OFFS

My favourite opportunities are those with asymmetric pay-offs. Here there is potential for considerable upside, but not a lot of downside (or vice versa for shorts). Sometimes, a share will have fallen out of favour with the market. It usually takes a catalyst – an event such as a change in management – for the market to become more enthusiastic, and for the share price to factor in the recovery opportunity. Whatever the idea, and wherever the source, this concept of a reward which is not commensurate with the risk is a critical objective.

As a special situation investor, I am drawn to areas where there are unusual rewards. This usually involves a higher element of risk. The trick is to find companies which have asymmetric pay-offs. In these cases, there is an element of downside risk, but the upside is significantly higher and you have a good reason to believe in the positive pay-off, because of a change in a fundamental driver.”

Stephen Clapham. The Smart Money Method (p. 32). Harriman House. November 24, 2020.

Bolted to the chair

Mark Twain’s mother said:

“I only wish Mark had spent more time making money rather than just writing about it”.

I am no Mark Twain.

I’m a tactical trader, so that’s my first purpose.

I’m not always going to take the time to write it out in a format I can share here.

I’ve been bolted to the chair this week but didn’t spend any time sharing my observations.

Instead, I encourage you to do what I did. I went back and reread some observations from January to see what I was seeing and thinking then.

I think about:

What has changed?

How has sentiment changed?

How has the trend direction changed?

Has volatility changed?

Has momentum changed?

Has the narrative changed?

What didn’t we know then we do today?

Is what we believe today congruent with what we believed then?

Here’s what I read:


If you do this, you’ll see why.

Volatility is expanding, a little

To no surprise, the CBOE S&P 500 Volatility Index that represents the market’s expectation of 30-day forward-looking volatility, is trending up. 

VIX VOLATILITY EXPANSION ASYMMETRIC RETURNS

So far, it isn’t much of a volatility expansion, but it’s elevated somewhat higher than it was. At around 15, the VIX is also well below its long term average of 18.23, although it hasn’t historically been drawn to the 18-20 level, anyway. The average is skewed by the spikes in volatility; volatility expansion. 

VIX is at a current level of 14.82, an increase of 0.80 or 5.71%% from the previous market day.

Here are the 50 and 200-day moving average values for VIX.

VIX MOVING AVERAGE

As I shared over the weekend, and it was quoted in today’s MarketWatch article “U.S.-Iran tensions will spark increased volatility — here’s how to play stocks, fund manager says“:

“So, on a short-term basis, the stock indexes have had a nice uptrend since October, with low volatility, so we shouldn’t be surprised to see it reverse to a short-term downtrend and a volatility expansion.

“For those who were looking for a ‘catalyst’ to drive a volatility expansion, now they have it.”

I was referring to the U.S. conflict with Iran, of course. 

The VIX index value is derived from the price inputs of the S&P 500 index options, it provides an indication of market risk and investors’ sentiments. VIX measures the implied ‘expected’ volatility of the US stock market. So, many market strategists use the VIX as a gauge for how fearful, uncertain, or how complacent the markets are. The VIX index tends to rise when the market drops and vice versa. During the 2008-2009 bear market, the VIX trended up as high as 80.86. Although the VIX cannot be invested in directly, securities like ETFs and derivatives based on it may provide the potential for an asymmetric hedge. For example, over the past year when the S&P 500 stock index was down -1% or more on the day, some of the ETFs based on long volatility spiked 10% or more. Volatility is difficult to time right, but when we do the payoff can be asymmetric. An asymmetric payoff is achieved when the risk-reward is asymmetric: maybe we risk 1% to achieve a payoff of 5%. Since long volatility has the potential for big spikes when volatility expands, it’s asymmetric payoff doesn’t require the tactical trader and risk manager to be as ‘right’ and accurate. So, the probability of winning can be lower, but the net pay off over time is an asymmetric risk-reward.

You can probably see why I pay attention to volatility and volatility expansions.

Mike Shell is the Founder and Chief Investment Officer of Shell Capital Management, LLC, and the portfolio manager of ASYMMETRY® Global Tactical.Mike Shell and Shell Capital Management, LLC is a registered investment advisor focused on asymmetric risk-reward and absolute return strategies and provides investment advice and portfolio management only to clients with a signed and executed investment management agreement. The observations shared on this website are for general information only and should not be construed as advice to buy or sell any security. Securities reflected are not intended to represent any client holdings or any recommendations made by the firm. Any opinions expressed may change as subsequent conditions change.  Do not make any investment decisions based on such information as it is subject to change. Investing involves risk, including the potential loss of principal an investor must be willing to bear. Past performance is no guarantee of future results. All information and data are deemed reliable but is not guaranteed and should be independently verified. The presence of this website on the Internet shall in no direct or indirect way raise an implication that Shell Capital Management, LLC is offering to sell or soliciting to sell advisory services to residents of any state in which the firm is not registered as an investment advisor. The views and opinions expressed in ASYMMETRY® Observations are those of the authors and do not necessarily reflect a position of  Shell Capital Management, LLC. The use of this website is subject to its terms and conditions.


Asymmetry in yield spreads, inverted yield curve warning shot, and unemployment

The 10-2 Treasury Yield Spread is the difference between the 10-year treasury rate and the 2-year treasury rate.

A 10-2 treasury spread that approaches zero indicates a “flattening” yield curve. A flattening yield curve is when the shorter-term interest rate (2 years) is the same as longer-term interest rate (10 year).

Although many people mistakenly promote symmetry and balance as a good thing when it comes to investment management, this is another of many instances where asymmetry is preferred over symmetry.

If we balance our profit and loss, we make no progress.

So, I prefer profits over losses and profit greater than loss.

If we balance our risk and reward, we are left with no change.

So, I prefer asymmetry over symmetry: more reward, less risk, or asymmetric risk-reward.

Getting this wrong can be one of the biggest mistakes of your life. If you balance your portfolio, you’ll have periods of gains, but they may be followed by periods of losses and the losses are just enough to remove the gains. Asymmetric returns are achieved by capturing more of the good, less of the bad.

In the chart below, we can see the yield spread went negative in August. Since then, it has trended back up. The Yield Spread has become more asymmetric.

A negative 10-2 yield spread is historically considered a precursor to a recessionary period. So, symmetry is the first signal of an issue, then it turns negative. That’s why we saw these inverted yield curve headlines in August. Since yield curve inversions are scares, they get significant attention in the financial press.

inverted yield curve

Typically, long-term bonds have higher yields than short-term bonds. An inverted yield curve is seen as an indicator of an impending recession. A negative 10-2 spread predicted every recession from 1955 to 2018 but occurred 6-24 months before the recession happened, so the inverted yield curve is a leading indicator that signals far in advance. The gray area labels recessions. You can see the Yield Spread drops to a low level before the recession.

Although it isn’t currently inverted, we should take note it did invert briefly, and the spread is on the low range of its cycle historically We can see in the chart the inversion doesn’t necessarily stay flat or inverted for long. The signal, then, is the symmetry then the inversion.

The slope of the yield curve oscillates up and down with the state of the economy. The upward-sloping yield curve is observed when the economy is growing. When investors expect a recession, they also expect falling interest rates. The belief of the market that interest rates are going to fall drives the inversion. When the yield curve inverts, it’s because investors have low confidence in the economy over the near term. So, it’s an indicator of investor sentiment and behavior. Here is a visual of the historical rates between the 2 and 10 year. The 10 year should be materially higher as a reward for tying money up longer as is the case most of the time.

The 10-2 spread reached a high of 2.91% in 2011, and went as low as -2.41% in 1980. The good news is the 10-2 spread flattened to zero last September but has since spread back out.

Only time will tell if the inversion in 2019 will precede a recession. All we know now is it’s a warning shot across the bow to pay attention to other leading economic indicators that precede the next stage of the business cycle.

But, the rate of change in interest rates is probably the most important leading indicator. Falling interest rates result in a lower cost of capital and liquidity for both consumers and businesses. When money is cheaper, we’re more likely to spend. We should be more inclined to buy a new $100,000 car at 2% than 4%. When interest rates rise, as they are now, we know the economy will eventually slow down as it costs more to borrow money to fund business projects or personal spending. As interest rates rise, people spend less. Since the cost of the loan literally rises, this happens whether they know what they are doing or not, since rising rates also means people and businesses can afford less debt. When rates rise, payments rise, so the amount they can borrow, which is based on income, reduces spending.

The yield curve inversion doesn’t automatically mean a recession is in the near future.

Employment is essential, too. The U.S. Unemployment Rate is about as low as it’s ever been.

As with all cycles, it isn’t the extremely low level of the cycle we should focus on, but what’s more likely to happen next. It should be no surprise that low unemployment precedes recessions.

For me, the directional trend of the stock market will be my primary guide for the economy but I monitor many trends for situational awareness of what is going on.

Mike Shell is the Founder and Chief Investment Officer of Shell Capital Management, LLC, and the portfolio manager of ASYMMETRY® Global Tactical.

Mike Shell and Shell Capital Management, LLC is a registered investment advisor focused on asymmetric risk-reward and absolute return strategies and provides investment advice and portfolio management only to clients with a signed and executed investment management agreement. The observations shared on this website are for general information only and should not be construed as advice to buy or sell any security. Securities reflected are not intended to represent any client holdings or any recommendations made by the firm. Any opinions expressed may change as subsequent conditions change.  Do not make any investment decisions based on such information as it is subject to change. Investing involves risk, including the potential loss of principal an investor must be willing to bear. Past performance is no guarantee of future results. All information and data are deemed reliable but is not guaranteed and should be independently verified. The presence of this website on the Internet shall in no direct or indirect way raise an implication that Shell Capital Management, LLC is offering to sell or soliciting to sell advisory services to residents of any state in which the firm is not registered as an investment advisor. The views and opinions expressed in ASYMMETRY® Observations are those of the authors and do not necessarily reflect a position of  Shell Capital Management, LLC. The use of this website is subject to its terms and conditions.


A few observations on Global Macro and Trend Following

A few observations on #GlobalMacro and #TrendFollowing

As I see it, trend following can be global macro and global macro can be trend following. I call my primary strategy “global tactical,” which is an unconstrained, go-anywhere combination of them both and multiple strategies.

There is no way to predict the future direction of the stock market with macroeconomics. There are far too many variables and the variability of those variables change and evolve. The way to deal with it is to simply evolve with the changing trends and direct and control risk.

For me, it’s about Man + Machine. I apply my proprietary tactical trading systems and methods to a global opportunity set of markets to find potentially profitable price trends. Though my computerized trading systems are systematic, I use their signals at my discretion.

I believe my edge in developing my systems and methods began by first developing skill at charting price trends and trading them successfully. If I had started out just testing systems, I’d only have data mined without the understanding I have of trends and how markets interact.

Without the experience of charting market trends starting in the 90’s I probably would have overfitted backtested systems as it seems others have. A healthy dose of charting skill and experience helped me to avoid systems that relied on trends that seemed unlikely to repeat.

For example, if one had developed a backtested system in 2000 without experience charting those prior trends in real-time, they’d have focused on NASDAQ stocks like Technology. The walk forward would have been a disaster. We can say the same for those who backtested post-2008.

All portfolio management investment decision-making is very challenging as we never know for sure what’s going to happen next. The best we can do is apply robust systems and methods based on a positive mathematical expectation and a dose of skilled intuition that comes with experience.

As such, ALL systems and methods are going to have conditions that are hostile to the strategy and periods you aren’t thrilled with the outcome. For me, self-discipline comes with knowledge, skill, and experience. I am fully committed, steadfast, and persistent in what I do.

Mike Shell is the Founder and Chief Investment Officer of Shell Capital Management, LLC, and the portfolio manager of ASYMMETRY® Global Tactical.

Mike Shell and Shell Capital Management, LLC is a registered investment advisor and provides investment advice and portfolio management exclusively to clients with a signed and executed investment management agreement. The observations shared on this website are for general information only and are not specific advice, research, or buy or sell recommendations for any individual. Investing involves risk including the potential loss of principal an investor must be willing to bear. Past performance is no guarantee of future results. All information provided is deemed reliable, but is not guaranteed and should be independently verified. The presence of this website on the Internet shall in no direct or indirect way raise an implication that Shell Capital Management, LLC is offering to sell or soliciting to sell advisory services to residents of any state in which the firm is not registered as an investment advisor. Use of this website is subject to its terms and conditions.

Welcome to March! A review of global asset allocation and global markets

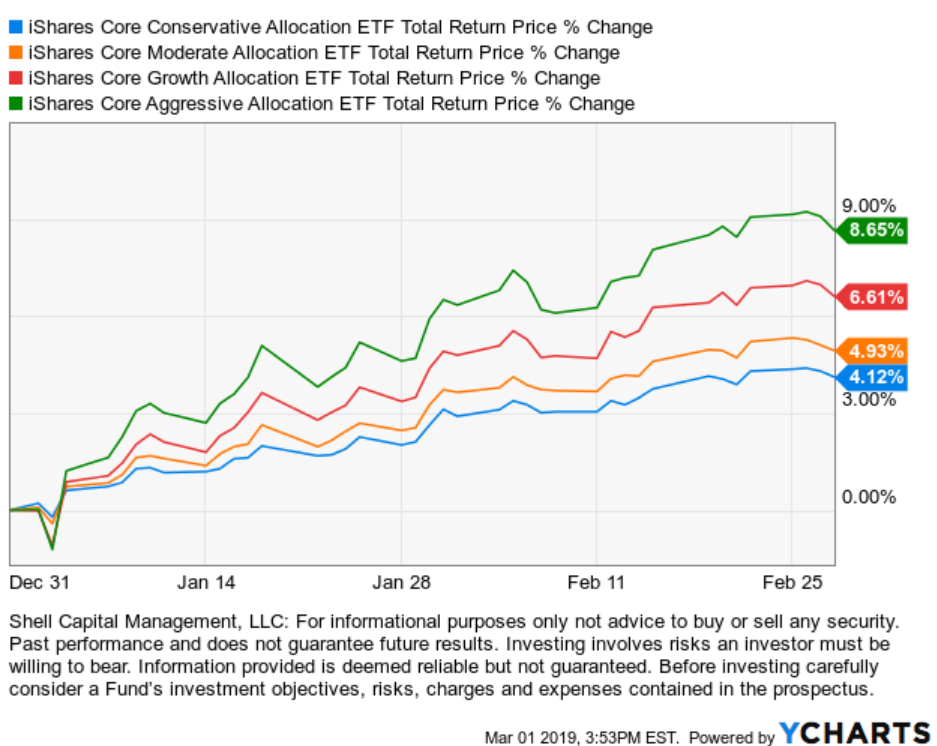
In the first two months of 2019 global asset allocation has gained 4% to 8.6%. I use the iShares Core Global Allocation ETFs as a proxy instead of indexes since the ETFs are real world performance including costs. The four different allocations below represent different exposure to global stocks vs. bonds.

global asset allocation ETF ETFs asymmetric risk reward .jpg

I’m not advising anyone to buy or sell these ETFs, but instead using them as an example for what a broadly diversified global asset allocation portfolio looks like. Most financial advisors build some type of global asset allocation for their clients and try to match it with their risk tolerance. The more aggressive clients get more stocks and the most conservative clients get more bonds. Of course, this is just asset allocation, so the allocations are mostly fixed and do not change based on market risk/reward. This is very different than what I do, which is focus on asymmetric risk/reward by increasing and decreasing exposure to risk/reward based on my calculations of risk levels and the potential for reward. So, my system is global, but it’s tactical rotation rather than fixed allocation.

The iShares Core Allocation Funds track the S&P Target Risk Indexes. So, BlackRock is the portfolio manager managing the ETF and they are tracking S&P Target Risk Indexes. Here is their description:

S&P Dow Jones Indices’ Target Risk series comprises multi-asset class indices that correspond to a particular risk level. Each index is fully investable, with varying levels of exposure to equities and fixed income and are intended to represent stock and bond allocations across a risk spectrum from conservative to aggressive.

In other words, they each provide varying allocations to bonds and stocks. The Conservative model is more bonds, the Aggressive model is more stocks.

S&P Target Risk Conservative Index. The index seeks to emphasize exposure to fixed income, in order to produce a current income stream and avoid excessive volatility of returns. Equities are included to protect long-term purchasing power.

S&P Target Risk Moderate Index. The index seeks to provide significant exposure to fixed income, while also providing increased opportunity for capital growth through equities.

S&P Target Risk Growth Index. The index seeks to provide increased exposure to equities, while also using some fixed income exposure to dampen risk.

S&P Target Risk Aggressive Index. The index seeks to emphasize exposure to equities, maximizing opportunities for long-term capital accumulation. It may include small allocations in fixed income to enhance portfolio efficiency.

Below is an example of the S&P Target Risk Index allocations and the underlying ETFs they invest in. Notice their differences is 10% to 20% allocation between stocks and bonds.

Global Allocation Index Construction

These ETFs offer low-cost exposure to global asset allocation with varying levels of “risk,” which really means varying levels of allocations to bonds. I say they are “low-cost” because these ETFs only charge 0.25% including the ETFs they are invested in. Most financial advisors probably charge 1% for similar global asset allocation, not including trade commissions and the ETF or fund fees they invest in. Even the lowest fee advisors charge at least 0.25% plus the trade commissions and the fund fees they invest in. With these ETFs, investors who want long-only exposure all the time to global stock and bond market risk/return, they can get it in one low-cost ETF. However, they do come with the risks of being fully invested, all the time. These ETFs do not provide any absolute risk management.

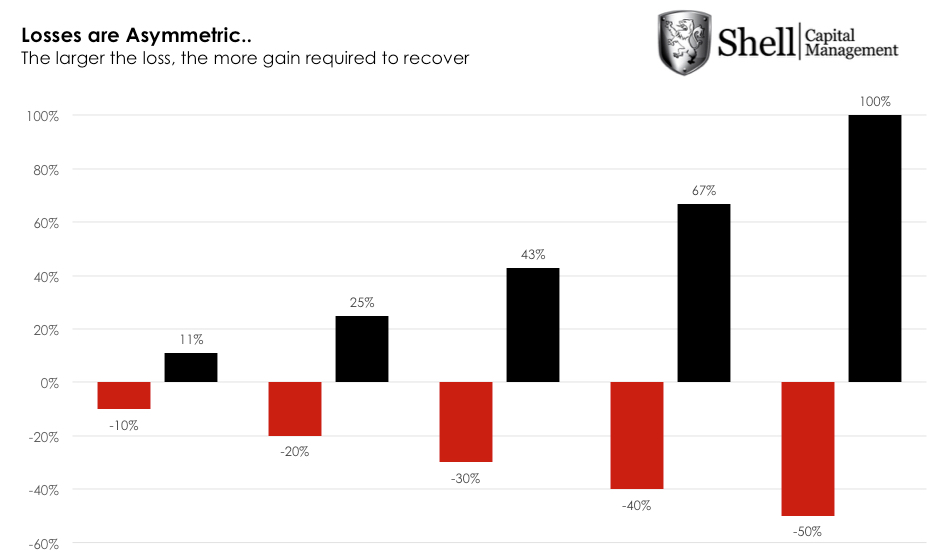
As an unconstrained, go-anywhere, absolute return manager who does apply active risk management, I’m unconstrained from a fixed benchmark, so I don’t intend to track or “beat” a benchmark. I operate with the limitations of a fixed benchmark. My objective is to create as much total return I can within a given amount of downside risk so investors don’t tap out trying to achieve it. It doesn’t matter how much the return is if inveestors tap out during drawdowns before it’s achieved. However, I consider global asset allocation that “base rate.” If I didn’t think I could create better asymmetric risk/reward than these ETFs I wouldn’t bother doing what I do. I would just be passive and take the beatings in bear markets. If we can’t tolerate the beatings, we would invest in the more conservative ETF. I intend to create ASYMMETRY® and win by not losing, and that necessarily requires robust risk management systems and tactics.

Now that we know what they are, below are their total returns including dividends looking back over time. (To see the full history in the prospectus click: iShares)

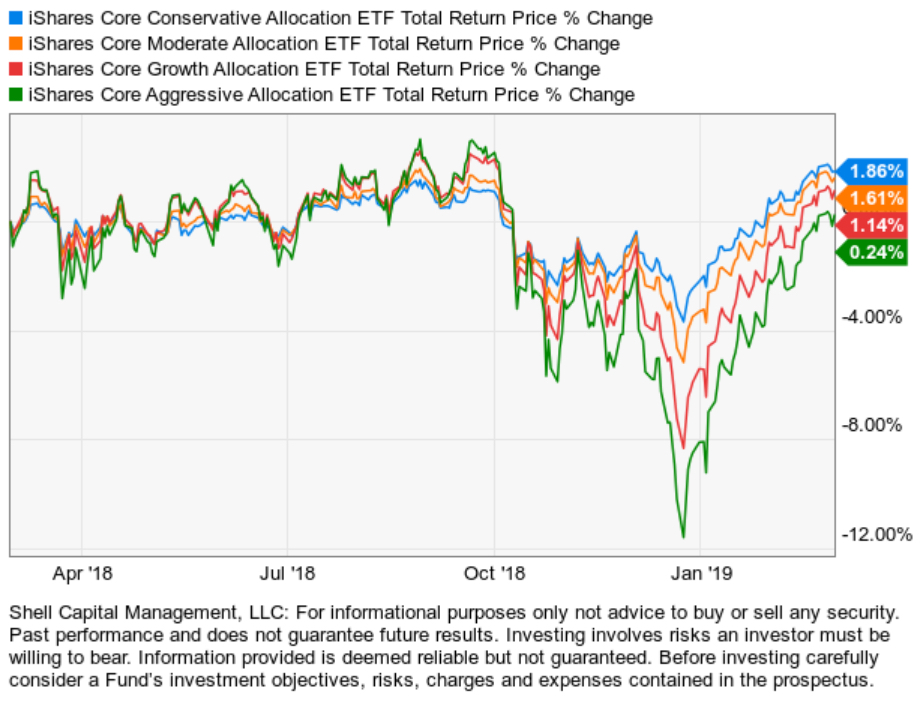
In the chart below, we see the global asset allocation ETFs are attempting to get back to their September 2018 high. While the S&P 500 stock index is still down about -4% from its September 2018 high, the bonds in these ETFs helped reduce their drawdowns, so they have also recovered their losses better.

global tactical asset allocation asymmetric risk reward

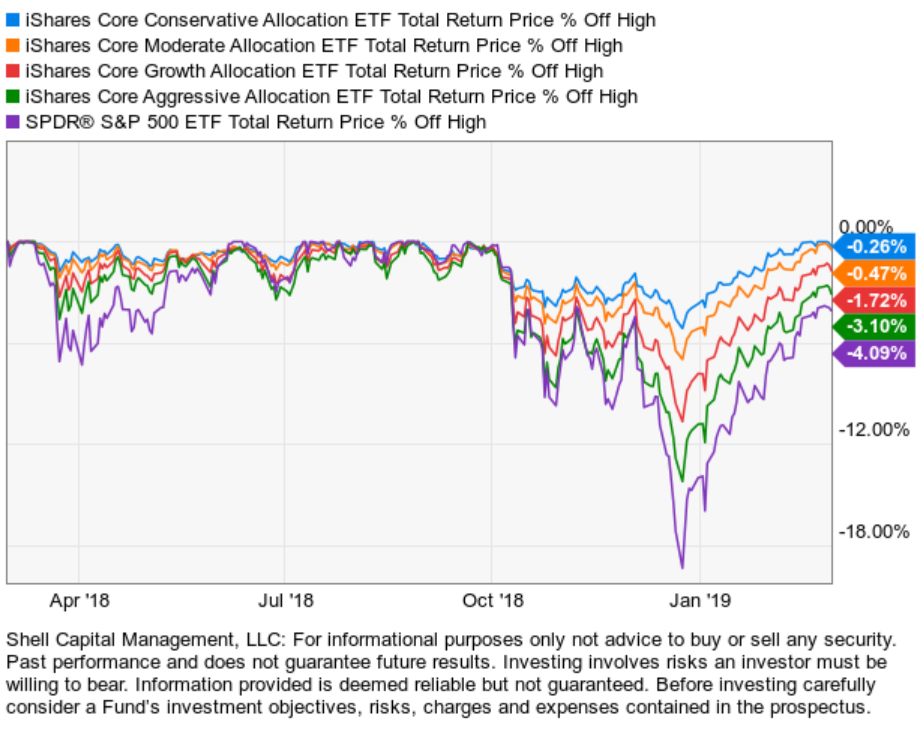
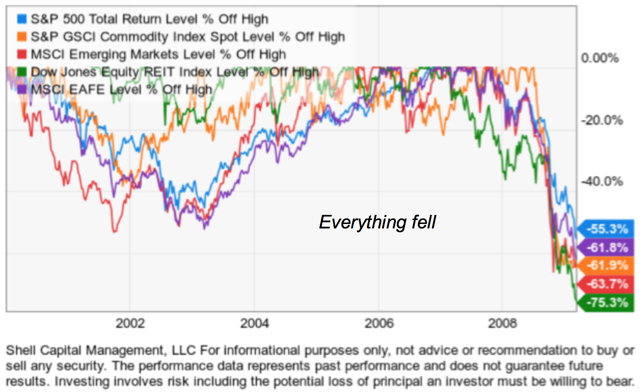
To be sure, below are the drawdowns. The iShares Core Conservative ETF is only 30% stocks and 70% bonds, so it had a smaller drawdown and has recovered from it already. I added the S&P 500 in this chart with is 100% stocks to show how during this correction, the exposure to bonds helped offset losses in stocks. Diversification does not guarantee a profit or protect against a loss in a declining market. Sometimes diversification and even the broadest global asset allocation fails like it did in 2008.

GLOBAL TACTICAL ASSET ALLOCATION ASYMMETRIC RISK REWARD DRAWDOWN

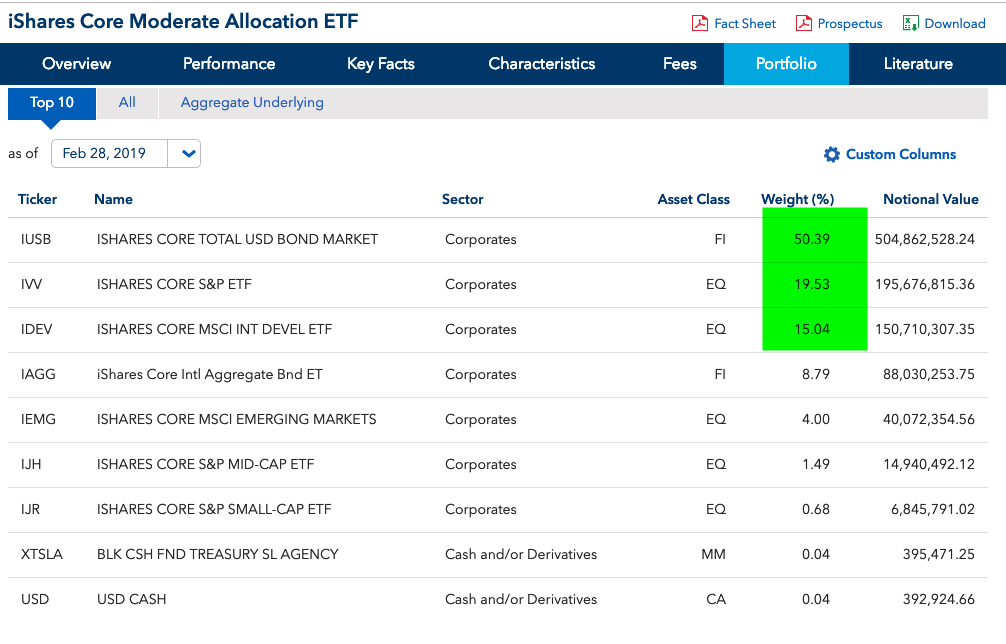
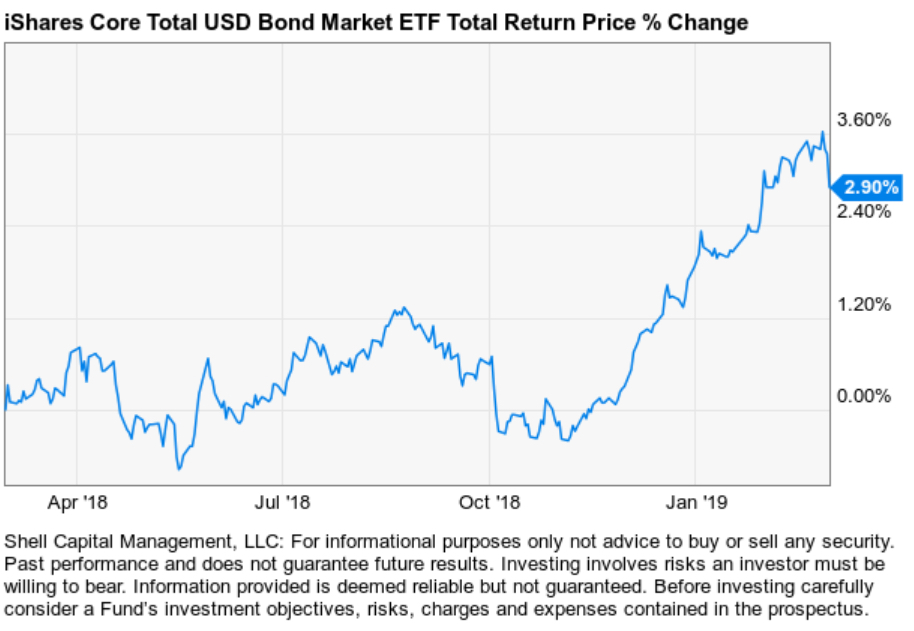
We can look inside the ETF to see their exposures. Below we see the iShares Core Moderate ETF which is 60% stocks and 40% bonds largest holding is the iShares Core Total USD Bond Market ETF (IUSB) at 50% of the fund.

iShares Core Moderate Allocation ETF

Below is the 1-year total return chart including dividends for its largest holding. It has gained a total return of 2.9% the past year. All of the gains were this year.

iShares Core Total USD Bond Market ETF (IUSB)

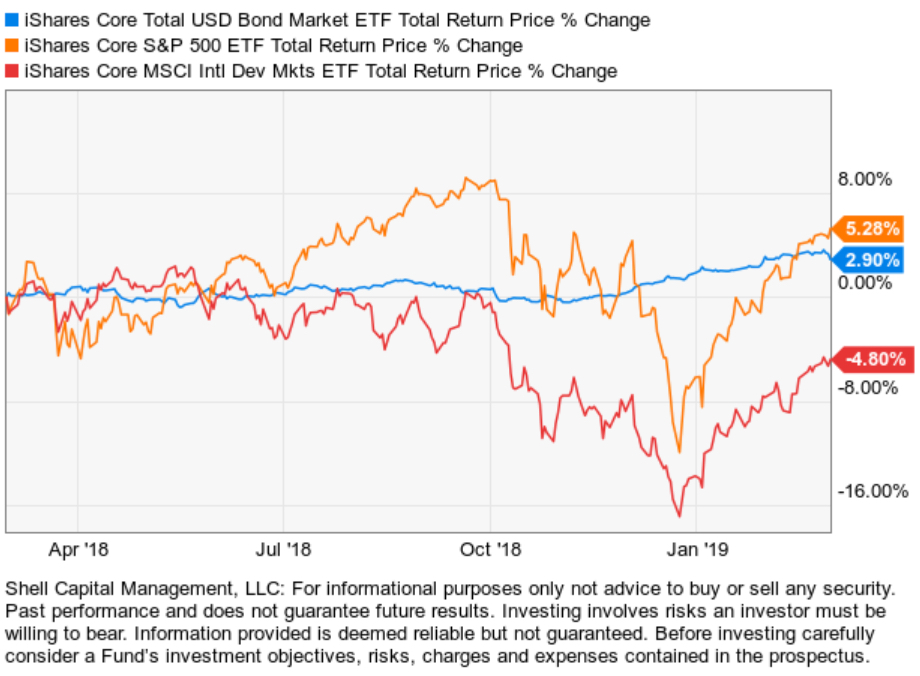
Next, I added the other two largest holdings iShares Core S&P 500 ETF (IVV) and iShares Core MSCI International Developed Markets ETF (IDEV). The weakness was worse in international stocks. 

GLOBAL ASSEST ALLOCATION ADVISORS TACTICAL

No total return chart is complete without also looking at its drawdowns. The combination of the total return chart and the drawdown is what I call the ASYMMETRY® Ratio. The ASYMMETRY® Ratio is the total return divided by the risk it took to achieve it. I prefer more total return, less downside drawdown.

global tactical asset allocation drawdown risk management

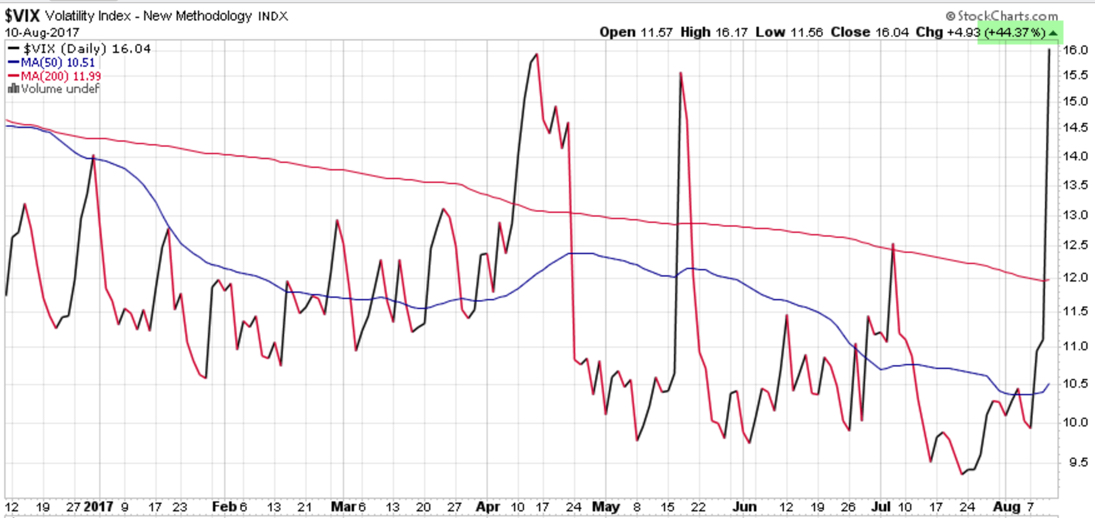
The point is, global stocks and bonds have recovered much of the losses. As we would expect so has global asset allocation. The only issue now is the short term risk has become elevated by my measures, so we’ll see how the next few weeks unfold.

Mike Shell is the Founder and Chief Investment Officer of Shell Capital Management, LLC, and the portfolio manager of ASYMMETRY® Global Tactical.

Mike Shell and Shell Capital Management, LLC is a registered investment advisor and provides investment advice and portfolio management exclusively to clients with a signed and executed investment management agreement. The observations shared on this website are for general information only and are not specific advice, research, or buy or sell recommendations for any individual. Investing involves risk including the potential loss of principal an investor must be willing to bear. Past performance is no guarantee of future results. All information provided is deemed reliable, but is not guaranteed and should be independently verified. The presence of this website on the Internet shall in no direct or indirect way raise an implication that Shell Capital Management, LLC is offering to sell or soliciting to sell advisory services to residents of any state in which the firm is not registered as an investment advisor. Use of this website is subject to its terms and conditions.

To Know Where You’re Going, Look at Where You’ve Been: The 2018 Year in Review

I write my observations of trends and market conditions every day, though I only share some of them on ASYMMETRY® Observations. The advantage of writing observations as we see them is we can go back and read what we observed in real time.

The best “year in review” is to reread these observations in the order they were written to see how global directional trends and volatility expansions and contractions unfolded in real time. Reviewing our actual observations removes the hindsight bias we have today, looking back with perfect hindsight of what happened only after the fact.

It’s one thing to think back and write about what you observed over the past year, it’s another to revisit what you observed as you saw it. It’s even another to review what you actually did in response to what you observed.

Mark Twain’s mother once said:

“I only wish Mark had spent more time making money rather than just writing about it.”

I don’t take the time to share every observation I have because I am no Mark Twain. I am fully committed to doing it, not just writing about it. Writing about observations of directional trends and volatility is secondary to making tactical trading decisions and active risk management for me. I see no use in observing markets and writing about it if I do nothing about it.

The first observation I shared this year was on January 18th. The topic may sound familiar today. From there, I observed conditions to suggested we could have been seeing the final stages of a bull market, a trend change to a non-trending indecisive period, and a volatility expansion. If you want to understand what in the world is going on, I encourage you to read these observations and think about how it all played out over the year.

JANUARY 2018

All Eyes are Now on the Potential Government Shutdown

In remembrance of euphoria: Whatever happened to Stuart and Mr. P?

FEBRUARY 2018

In the final stages of a bull market

Asset Class Returns are Driven by Sector Exposure

Stock Market Analysis of the S&P 500

Stock market indexes lost some buying enthusiasm for the day

The most important rule of trading is to play great defense, not great offense.

Selling pressure overcomes buying demand for the second day in U.S. stock market

February Global Market Trends

Selling pressure overwhelms buying demand for stocks for the third day in a row

Buying demand dominated selling pressure in the stock market

Asymmetric Volatility

MARCH 2018

Stock pickers market? Sector rotation with stocks for asymmetric reward to risk

Investment management can take many years of cycles and regimes to understand an edge.

Asymmetric force direction and size determines trend

Asymmetric force was with the buyers

My Introduction to Trend Following

When I apply different trend systems to ETFs

The enthusiasm to sell overwhelmed the desire to buy March 19, 2018

Apparently there was more enthusiasm to sell

What’s going to happen next?

What’s going to happen next? continued

APRIL 2018

Is this correction and volatility normal?

Global Market Trends

MAY 2018

Is the economy, stupid?

JUNE 2018

Growth Stocks have Stronger Momentum than Value in 2018

Sector Trends are Driving Equity Returns

Trend Analysis of the Stock Market

Trend of the International Stock Market

Interest Rate Trend and Rate Sensitive Sector Stocks

Expected Volatility Stays Elevated in 2018

Sector ETF Changes: Indexes aren’t so passive

Commodities are trending with better momentum than stocks

Investor sentiment gets more bearish

Is it a stock pickers market?

JULY 2018

2nd Quarter 2018 Global Investment Markets Review

Global Stock and Bond Market Trends 2Q 2018

Stock market investor optimism rises above historical average

Trend following applied to stocks

Asymmetry of Loss: Why Manage Risk?

Earnings season is tricky for momentum growth stocks

Front-running S&P 500 Resistance

The week in review shows some shifts

AUGUST 2018

Global Market ETF Trends

Global Market Trends, U.S. Dollar, Emerging Markets, Commodities, and Their Changing Correlations

The Big Picture Stock and Bond Market Valuation and Outlook

SEPTEMBER 2018

The U.S. stock market was strong in August, but…

Emerging Markets Reached a Bear Market Level, or is it a Continuation of a Secular Bear Market?

What trends are driving emerging markets into a bear market?

VIX level shows market’s expectation of future volatility

Rising Interest Rate Impact on Real Estate and Home Construction

The Trend in Interest Rates and the Impact on the Economy and Stock Market

OCTOBER 2018

Stanley Druckenmiller on his use of Technical Analysis and Instinct

Here comes the volatility expansion

Intermarket trends change over the past two weeks

The volatility expansion continues like tropical storm Michael that could become a hurricane

Divergence in Global Asset Allocation

The Stock Market Trend

U. S. Sector Trends

Observations of the stock market decline and volatility expansion

The stock market trends up with momentum

Observations of the stock market downtrend

NOVEMBER 2018

The stock market is swinging its way to an inflection point

Divergence in the Advance-Decline Line May be Bullish

Pattern Recognition: Is the S&P 500 Forming a Head and Shoulders Bottom?

Momentum stocks need to find some buying interest

Will the stock market hold the line?

The Death Cross on the S&P 500

DECEMBER 2018

Stock Market Observations

What’s going to happen next for the stock market?

Global asset allocation takes a beating in 2018

The stock market has reached a short-term extreme as investor sentiment indicates fear

An exhaustive analysis of the U.S. stock market

An exhaustive stock market analysis… continued

Keep in mind, even if I see what could be the final stages of a bull market unfold, it doesn’t mean I try to just exit near the stock market peak and sit in cash for years. For me, it isn’t a simple ON/OFF switch. The highlight of my performance history has probably been my execution through bear markets. I’ve historically operated through them by being a tactical risk manager/risk taker, which means I increase and decrease exposure to the possibility of risk/reward with an objective of asymmetric risk/reward. I can’t assure anyone I’ll do as well in the future as I’ve done in the past, but I do know I’m even better prepared now than I was then. Being as prepared as possible and well-honed on situational awareness is the best I can do.

I’m looking forward to sharing more observations as we enter 2019 as global market conditions appear to be setting up for some trends to avoid, some to participate in, and some interesting trends to write about. To follow along, enter your email address on the top right of this website and follow me on Twitter.

HAPPY NEW YEAR! 

Mike Shell is the Founder and Chief Investment Officer of Shell Capital Management, LLC, and the portfolio manager of ASYMMETRY® Global Tactical.

The observations shared on this website are for general information only and are not specific advice, research, or buy or sell recommendations for any individual. Investing involves risk including the potential loss of principal an investor must be willing to bear. Past performance is no guarantee of future results. The presence of this website on the Internet shall in no direct or indirect way raise an implication that Shell Capital Management, LLC is offering to sell or soliciting to sell advisory services to residents of any state in which the firm is not registered as an investment advisor. Use of this website is subject to its terms and conditions.


The Death Cross on the S&P 500

I wonder when we’ll start hearing about the death cross again like we did in 2016.

The S&P 500 Equal Weight signaled a death cross today. As with any trend following signal or any signal at all, it doesn’t come with a 100% probability. No signal is always accurate. Nor do they need to be for an edge.

The cap-weighted S&P 500 that everyone follows has more large-cap stock exposure than the equal weight. The cap weight hasn’t yet reached the “death cross” level yet.  But it is going to cross soon even if the stock index trends up sharply. We know this because of the length of the lag time in the 50-day moving average. Even big daily gains won’t be enough to stop the downtrend in the 50-day moving average before it crosses below the 200 day moving average.  Each days weight is only 1/50, so it is up against the trend of the other 49 days.

The equal weight S&P 500 has much more exposure to small company stocks. The S&P 600 small-cap index had already achieved a “death cross” when its 50-day moving average crossed below the 200 day recently.

The death cross is considered a bearish indicator that generates a trend following signal to exit or go short when the 50-day moving average drops below 200-day moving average. We last saw it in 2015 and 2016 when it got a lot of media attention. The death cross signals also resulted mostly in whipsaws.

One difference in 2015 and 2016 was the Equal Weight S&P 500 only gave one signal as the cap-weighted whipsawed with two.

Here we can see why… the Equal Weight has more exposure to small-cap stocks and small-cap stock index only generated one signal.

What the death cross 50/200 moving average “death cross” indicator signals is, with a necessary lag, prices have been declining. That part is a fact.

Only time will tell if it accurately signals more price decline, or if prices have reached a low enough level for buying demand. Indicators that generate trend following signals like the 50/200 moving average crossover are often discussed incompletely regarding only their accuracy (probability), but its the mathematical expectation that matters: are the average profits > average losses?

And indicators that generate systematic trend following signals like the 50/200 moving average crossover are often discussed incompletely regarding a single market like stocks instead of applied across broad markets like currency, bonds, and commodities.

If we remove the moving averages from the chart and focus on the upward momentum the last few days, even the equal-weighted index with its “death cross” signal appears to be attempting to trend back up. So, chances are this will be one of the 60% of the time the signal isn’t accurate.

So far, the index is holding the line. Only time will tell, so let’s see how it all unfolds.


Mike Shell is the Founder and Chief Investment Officer of Shell Capital Management, LLC, and the portfolio manager of ASYMMETRY® Global Tactical.

The observations shared on this website are for general information only and are not specific advice, research, or buy or sell recommendations for any individual. Investing involves risk including the potential loss of principal an investor must be willing to bear. Past performance is no guarantee of future results. The presence of this website on the Internet shall in no direct or indirect way raise an implication that Shell Capital Management, LLC is offering to sell or soliciting to sell advisory services to residents of any state in which the firm is not registered as an investment advisor. Use of this website is subject to its terms and conditions.


Will the stock market hold the line?

The popular U.S. stock market indexes almost formed a potential inverse head and shoulders reversal pattern, however, the right side was met with selling pressure that exceeded enthusiasm to buy. For those who care to observe the price action as it unfolds, I’ll share my observations of what I’m watching for to identify a reversal or continuation of the trend. I don’t necessarily make my tactical trading decisions based on these things, it’s instead market analysis I do for observation of the shifts in supply and demand that ultimately drive trends.

At this point, these stock indexes we use as a proxy for the stock market have reached the October lows as we knew they could.

stock market trend following momentum

The bad news is we’ve continued to see the desire to sell exceed the enthusiasm to buy. When selling pressure is dominant, prices fall.

The good news is the price level has now reached a point were another potential reversal pattern could form; a double bottom reversal. A double bottom reversal is commonly seen when prices reach a prior low and then find enough buying interest to shift the trend from down to up. Such a shift necessarily requires prices to fall to a low enough point that buyers become willing to buy.  For the trend to change; buying demand overwhelms selling pressure. So, the shift involves some combination of the desire to sell becoming exhausted and the desire to buy becoming dominant. Prices trend in the direction of the most asymmetry.

I don’t get caught up in the semantics of the names of patterns, but instead what the formation is showing about the shift in supply and demand. When a potential inverse head and shoulders pattern fails on the right shoulder, the possibility of a double bottom reversal exists, but still needs to be confirmed. For me, the whole point is; in a downtrend (uptrend), no matter what the time frame, I look for signs of a reversal of the trend through a shift in the supply/demand seen in price action. None of them are ever 100% predictive or accurate, it’s always about possible outcomes and observing the trend. It’s always probabilistic, never a sure thing. But, that’s all we need.

We’ll see if the stock indexes can hold the line, or not.

It’s a process, not an event, so we just watch it all unfold.

Let’s see what it does from here.

Have a Happy Thanksgiving!

Mike Shell is the Founder and Chief Investment Officer of Shell Capital Management, LLC, and the portfolio manager of ASYMMETRY® Global Tactical.

The observations shared on this website are for general information only and are not specific advice, research, or buy or sell recommendations for any individual. Investing involves risk including the potential loss of principal an investor must be willing to bear. Past performance is no guarantee of future results. The presence of this website on the Internet shall in no direct or indirect way raise an implication that Shell Capital Management, LLC is offering to sell or soliciting to sell advisory services to residents of any state in which the firm is not registered as an investment advisor. Use of this website is subject to its terms and conditions.


Here comes the volatility expansion

Nine days ago in VIX level shows market’s expectation of future volatility I shared an observation that the implied volatility VIX, a measure of expected future volatility that is implied by option prices, had reached an extremely low point. I explained what that means and how I use it:

When the market expects volatility to be low in the next 30 days, I know it could be right for some time.

But, when it gets to its historically lowest levels, it raises situational awareness that a countertrend could be near.

Today we have some volatility expansion.

The VIX Volatility Index has gained 35%. It implies the market now expects higher volatility. Specifically, the market expects the range of prices to spread out over 15% instead of 12%.

VIX $VIX Volatility Expansion asymmetry asymmetric convexity divergence

The popular stock indexes are down over -1% for the first time in a while.

stock market asymmetry asymmetric risk

As I said nine days ago, it should be no surprise to see some volatility expansion. Volatility is mean reverting, which means it tends to oscillate in a high and low range and reverse back to an average after its reaches those cycle highs and lows.

Implied volatility had reached its historical low end, so it’s expanding back out. Stock prices are also spreading out and declining so we shouldn’t be surprised to see more movement in prices in the coming weeks.

At around the same time volatility was contracting and calm, my momentum indicators were signaling stock indexes and many individual stocks were reaching short-term extreme levels that often preceded a short-term decline. These systems prompt me tactically reduce exposure to stocks to dynamically manage our risk.

Only time will tell how it all plays out. We’ll see how it unfolds from here.

Mike Shell is the Founder and Chief Investment Officer of Shell Capital Management, LLC, and the portfolio manager of ASYMMETRY® Global Tactical.

The observations shared in this material are for general information only and are not intended to provide specific advice or recommendations for any individual. Investing involves risk including the potential loss of principal an investor must be willing to bear. Past performance is no guarantee of future results. The presence of this website on the Internet shall in no direct or indirect way raise an implication that Shell Capital Management, LLC is offering to sell or soliciting to sell advisory services to residents of any state in which the firm is not registered as an investment advisor. 

Asymmetry of Loss: Why Manage Risk?

“The essence of portfolio management is the management of risks, not the management of returns.” —Benjamin Graham

Why actively manage investment risk?

Why not just buy and hold markets and ride through their large drawdowns?

Losses are asymmetric and loss compounds exponentially.

The larger the loss, the more gain is required to recover the loss to get back to breakeven.

The negative asymmetry of loss starts quickly, losses more than -20% decline start to compound against you exponentially and with a greater magnitude the larger the loss is allowed to grow.

If your investment portfolio experiences a -20% loss, it needs a 25% gain to get back the breakeven value it was before the loss.

asymmetry of loss losses asymmetric exponential

At the -30% loss level, you need a 43% gain to get it back.

Diversification is often used as an attempt to manage risk by allocating capital across different markets and assets.

Diversification and asset allocation alone doesn’t achieve the kind of risk management needed to avoid these large declines in value. Global markets can fall together, providing no protection from loss.

For example, global markets all fell during the last two bear markets 2000-2003 and 2007-2009.

global asset allocation diversification failed 2008

It didn’t matter if you had a global allocation portfolio diversified between U.S. stocks, international stocks, commodities, and real estate REITs.

Diversification can fail when you need it most, so there is a regulatory disclosure required: Diversification does not assure a profit or protect against loss.

This is why active risk management to limit downside loss is essential for investment management.

I actively manage loss by knowing the absolute point I’ll exit each individual position and managing my risk level at the portfolio level.

Active risk management, as I use it, applies tactics and systems to actively and dynamically decrease or increase exposure to the potential for loss.

My risk management systems are asymmetric risk management systems. Asymmetric risk management intends to manage risk with the objective of a positive asymmetric risk/reward.

My asymmetric risk management systems are designed to cut losses short, but also protects and manages positions with a profit.

After markets trend up for a while without any significant interruption, investors may become complacent and forget the large damage losses can cause to their capital and their confidence. When investors lose confidence in the markets, they tap-out when their losses are allowed to grow to large.

I prefer to stop the loss before it gets too large. How much is too large depends on the client, but also the math. As seen here, I have a mathematical basis for believing I should actively manage investment risk.

It’s why I’ve been doing it for two decades. Because I understood the math, I knew I had to do it over twenty years ago and developed the systems and tactics that proved to be robust in the devastating bear markets I’ve executed through since then.


Mike Shell is the Founder, and Chief Investment Officer of Shell Capital Management, LLC, and the portfolio manager of ASYMMETRY® Managed Portfolios and ASYMMETRY® Global Tactical.

You can follow ASYMMETRY® Observations by click on on “Get Updates by Email” on the top right or follow us on Twitter.

The observations shared in this material are for general information only and are not intended to provide specific advice or recommendations for any individual. Investing involves risk including the potential loss of principal an investor must be willing to bear. Past performance is no guarantee of future results.

VIX Trends Up 9th Biggest 1-day Move

About a week after a hedge fund manager who is popular with the media but has a poor track record of managing risk said “please stop talking about the low VIX”, it gains 44.4% in a single day – its 9th biggest 1-day move. He was suggesting the low VIX wasn’t an indication of high risk. If you have followed my observations, you know that I disagree. I’m one who has been talking about the low VIX and suggesting it is one of many indications of complacency among investors. That is, investors hear “all time new highs” and get overly optimistic instead of reducing their risk or being prepared to manage downside loss.

VIX biggest moves

I point out the hedge fund manager’s comment because I believe a low VIX is an indication of complacency because it measures expected implied volatility for options on the S&P 500 stocks. When implied volatility gets to historical low points, it means options traders aren’t paying high premiums for hedging “protection”. Others can believe what they want to believe. I don’t just point out observations at extremes. I actually do something.

As I pointed out recently in “No Inflection Point Yet, But… ” the VIX was at an extreme low. About a week later this other fund manager implies it may not be meaningful. That’s exactly what we expect to hear when the expected volatility gets to such an extreme low. We expect to see it shift the other direction at some point. I like to follow trends until they reach an extreme – and reverse.

Here is what it looked like.

VIX 9th biggest one day move

More importantly, here is what the stock indexes looked like on Google Finance after the close:

Stock market down Korea

Another observation I shared in “No Inflection Point Yet, But…” is that leading stocks can sometimes be more volatile and yesterday was no exception. While the stock indexes were down around -1.5% some of the most popular stocks were down about twice as much:

FANG stocks downSource: Google Finance

Of course, this is all just one day. We’ll see if it continues into a longer trend.

It’s always a good time to manage risk, but sometimes it’s more obvious than others.

Essence of Portfolio Management

Essence of Portfolio Management

“The essence of investment management is the management of risks, not the management of returns. Well-managed portfolios start with this precept.”

– Benjamin Graham

The problem is many portfolio managers believe they manage risk through their investment selection. That is, they believe their rotation from one seemingly risky position to another they believe is less risk is a reduction in risk. But, the risk is the exposure to the chance of a loss. The exposure is still there. Only the perception has changed: they just believe their risk is less. For example, for the last thirty years, the primary price trend for bonds has been up because interest rates have been falling. If a portfolio manager shifts from stocks to bonds when stocks are falling, bonds would often be rising. It appears that trend may be changing at some point. Portfolio managers who have relied on bonds as their safe haven may rotate out of stocks into bonds and then their bonds lose money too. That’s not risk management.

They don’t know in advance if the position they rotate to will result in a lower possibility of loss. Before 2008, American International Group (AIG) carried the highest rating for an insurance company. What if they rotated to AIG? Or to any of the other banks? Many investors believed those banks were great values as their prices were falling. They instead fell even more. It has taken them a long time to recover some of their losses. Just like tech and telecom stocks in 2000.

All risks cannot be hedged away if you pursue a profit. If you leave no chance at all for a potential profit, you earn nothing for that certainty. The risk is exposure to an unknown outcome that could result in a loss. If there is no exposure or uncertainty, there is no risk. The only way to manage risk is to increase and decrease the exposure to the possibility of loss. That means buying and selling (or hedging).  When you hear someone speaking otherwise, they are not talking of active risk management. For example, asset allocation and Modern Portfolio Theory is not active risk management. The exposure to loss remains. They just shift their risk to more things. Those markets can all fall together, as they do in real bear markets.

It’s required to accomplish what the family office Chief Investment Officer said in “What a family office looks for in a hedge fund portfolio manager” when he said:

“I like analogies. And one of the analogies in 2008 brings to me it’s like a sailor setting his course on a sea. He’s got a great sonar system, he’s got great maps and charts and he’s perhaps got a great GPS so he knows exactly where he is. He knows what’s ahead of him in the ocean but his heads down and he’s not seeing these awesomely black storm clouds building up on the horizon are about to come over top of him. Some of those managers we did not stay with. Managers who saw that, who changed course, trimmed their exposure, or sailed to safer territory. One, they survived; they truly preserved capital in difficult times and my benchmark for preserving capital is you had less than a double-digit loss in 08, you get to claim you preserved capital. I’ve heard people who’ve lost as much as 25% of investor capital argue that they preserved capital… but I don’t believe you can claim that.Understanding how a manager managed and was nimble during a period of time it gives me great comfort, a higher level of comfort, on what a manager may do in the next difficult period. So again it’s a it’s a very qualitative sort of trying to come to an understanding of what happened… and then make our best guess what we anticipate may happen next time.”

I made bold the parts I think are essential.

If you are like-minded and believe what we believe, contact us.

Actively Managing Investment Risk

The global market declines in early August offered a fine example of the kind of conditions that cause me to exit my long positions and end up in cash. For me, this is a normal part of my process. I predefine my risk in each position, so I know my risk across the portfolio. For example, I know at what point I’ll sell each position if it falls below a certain point in which I would consider it a negative trend. Since I know my exit in advance for each position, I knew in advance how much I would lose in the portfolio if all of those exits were reached due to market price movements trending against me. That allowed me to control how much my portfolio would lose from its prior peak by limiting it to my predefined amount. I have to take ‘some’ risk in order to have a chance for profits. If I took no risk at all, there could be no profit. The key for me is to take my risk when the reward to risk is asymmetric. That is, when the probability for a gain is much higher than the probability for a loss.

The concept seems simple, but actually doing it isn’t. All of it is probabilistic, never a sure thing.  For example, prices sometimes move beyond the exit point, so a risk control system has to account for that possibility.  More importantly, the portfolio manager has to be able to actually do it. I am a trigger puller. To see the results of over 10 years of my actually doing this, you can visit ASYMMETRY® Managed Accounts.


Uncharted Territory from the Fed Buying Stocks

I remember sometime after 2013 I told someone “The Fed is buying stocks and that’s partly why stocks have risen so surprisingly for so long”. He looked puzzled and didn’t seem to agree, or understand.

The U.S. Federal Reserve (the “Fed”) has been applying “quantitative easing” since the 2007 to 2009 “global financial crisis”. Quantitative easing (QE) is a type of monetary policy used by central banks to stimulate the economy when standard monetary policy has become ineffective. The Fed implements quantitative easing by buying financial assets from banks and other financial institutions. That raises the prices of those financial assets and lowers their interest rate or yield. It also increases the amount of money available in the economy. The magnitude they’ve done this over the past seven years has never been experience before. They are in uncharted territory.

I was reminded of what I said, “the Fed is buying stocks” when I read comments from Bill Gross in “Gross: Fed Slowly Recognizing ZIRP Has Downside Consequences”. He says companies are using easy money to buy their own stock:

Low interest rates have enabled Corporate America to borrow hundreds of billions of dollars “but instead of deploying the funds into the real economy,they have used the proceeds for stock buybacks. Corporate authorizations to buy back their own stock are running at an annual rate of $1.02 trillion so far in 2015, 18 percent above 2007’s record total of $863 billion, Gross said.

You see, if we want to know the truth about market dynamics; we necessarily have to think more deeply about how markets interact. Market dynamics aren’t always simple and obvious. I said, “The Fed is buying stocks” because their actions is driving the behavior of others. By taking actions to increase money supply in the economy and keep extremely low borrowing rates, the Fed has been driving demand for stocks.

But, it isn’t just companies buying their own stock back. It’s also investors buying stocks on margin. Margin is borrowed money that is used to purchase securities. At a brokerage firm it is referred to as “buying on margin”. For example, if we have $1 million in a brokerage account, we could borrow another $1 million “on margin” and invest twice as much. We would pay interest on the “margin loan”, but those rates have been very low for years. Margin interest rates have been 1 – 2%. You can probably see the attraction. If we invested in lower risk bonds earning 5% with $1 million, we would normally earn 5%, or $50,000 annually. If we borrowed another $1 million at 2% interest and invested the full $2 million at 5%, we would earn another 3%, or $30,000. The leverage of margin increased the return to 8%, or $80,000. Of course, when the price falls, the loss is also magnified. When the interest rate goes up, it reduces the profit. But rates have stayed low for so long this has driven margin demand.

While those who have their money sitting in in bank accounts and CDs have been brutally punished by near zero interest rates for many years, aggressive investors have borrowed at those low rates to magnify their return and risk in their investments. The Fed has kept borrowing costs extremely low and that is an incentive for margin.

In the chart below, the blue line is the S&P 500 stock index. The red line is NYSE Margin Debt. You may see the correlation. You may also notice that recessions (the grey area) occur after stock market peaks and high margin debt balances. That’s the downside: margin rates are at new highs, so when stocks do fall those investors will either have to exit their stocks to reduce risk or they’ll be forced to exit due to losses. If they don’t have a predefined exit, their broker has one for them: “a margin call”.

Current Margin Debt Stock MarginSource: http://www.advisorperspectives.com/dshort/charts/markets/nyse-margin-debt.html?NYSE-margin-debt-SPX-since-1995.gif

If you noticed, I said, “They are in uncharted territory”. I am not. I am always in uncharted territory, so I never am. I believe every new moment is unique, so I believe everyone is always in uncharted territory. Because I believe that, I embrace it. I embrace uncertainty and prepare for anything that can happen. It’s like watching a great movie. It would be no fun if we knew the outcome in advance.


My 2 Cents on the Dollar

The U.S. Dollar ($USD) has gained about 20% in less than a year. We observe it first in the weekly below. The U.S. Dollar is a significant driver of returns of other markets. For example, when the U.S. Dollar is rising, commodities like gold, oil, and foreign currencies like the Euro are usually falling. A rising U.S. Dollar also impacts international stocks priced in U.S. Dollar. When the U.S. Dollar trends up, many international markets priced in U.S. Dollars may trend down (reflecting the exchange rate). The U.S. Dollar may be trending up in anticipation of rising interest rates.

dollar trend weekly 2015-04-23_16-04-40

Chart created by Shell Capital with: http://www.stockcharts.com

Now, let’s observe a shorter time frame- the daily chart. Here we see an impressive uptrend and since March a non-trending indecisive period. Many trend followers and global macro traders are likely “long the U.S. Dollar” by being long and short other markets like commodities, international stocks, or currencies.

dollar trend daily 2015-04-23_16-05-04

Chart created by Shell Capital with: http://www.stockcharts.com

This is a good example of understanding what drives returns and risk/reward. I consider how long the U.S. Dollar I am and how that may impact my positions if this uptrend were to reverse. It’s a good time to pay attention to it to see if it breaks back out to the upside to resume the uptrend, or if it instead breaks down to end it. Such a continuation or reversal often occurs from a point like the blue areas I highlighted above.

That’s my two cents on the Dollar…

How long are you? Do you know?

Asymmetric Returns of World Markets YTD

As of today, global stock, bond, commodity markets are generating asymmetric returns year to date. The graph below illustrates the asymmetry is negative for those who need these markets to go “up”.

Asymmetric Returns of World Markets 2015-04-10_10-52-47

source: http://finviz.com


Asymmetric Nature of Losses and Loss Aversion

Loss Aversion:

“In prospect theory, loss aversion refers to the tendency for people to strongly prefer avoiding losses than acquiring gains. Some studies suggest that losses are as much as twice as psychologically powerful as gains. Loss aversion was first convincingly demonstrated by Amos Tversky and Daniel Kahneman.”

For most people, losing $100 is not the same as not winning $100. From a rational point of view are the two things the same or different?

Most economists say the two are the same. They are symmetrical. But I think that ignores some key issues.

If we have only $10 to eat on today and that’s all we have, if we lose it, we’ll be in trouble: hungry.

But if we have $10 to eat on and flip a coin in a bet and double it to $20, we may just eat a little better. We’ll still eat. The base rate: survival.

They say rationally the two are the same, but that isn’t true. They aren’t the same. The loss makes us worse off than we started and it may be totally rational to feel worse when we go backward than we feel good about getting better off. I don’t like to go backward, I prefer to move forward to stay the same.

Prospect Theory, which found people experience a loss more than 2 X greater than an equal gain, discovered the experience of losses are asymmetric.

Actually, the math agrees.

You see, losing 50% requires a 100% gain to get it back. Losing it all is even worse. Losses are indeed asymmetric and exponential on the downside so it may be completely rational and logical to feel the pain of losses asymmetrically. Experience the feeling of loss aversions seems to be the reason a few of us manage investment risk and generate a smoother return stream rather than blow up.

To see what the actual application of asymmetry to portfolio management looks like, see: Shell Capital Management, LLC.


asymmetry impact of loss

Absolute Return: an investment objective and strategy

Absolute returns investment strategy fund

Absolute Return in its basic definition is the return that an asset achieves over a certain period of time. This measure looks at the appreciation or depreciation (expressed as a dollar amount or a percentage). For example, a $50 stock drifts to $100 is a 100% absolute return. If that same stock drifts back from $100 to $50, its absolute return is -50%.

Absolute Return as an investment objective is one that does not try to track or beat an arbitrary benchmark or index, but instead seeks to generate real profits over a complete market cycle regardless of market conditions. That is, an absolute return objective of positive returns on investment over a market cycle of both bull and bear market periods irrespective of the direction of stock, commodity, or bond markets. Since the U.S. stock market has been generally in a uptrend for 6 years now, other than the -20% decline in the middle of 2011, we’ll now have to expand our time frame for a full market cycle to a longer period. That is, a full market cycle includes both a bull and a bear market.

The investor who has an absolute return objective is concerned about his or her own objectives for total return over a period and tolerance for loss and drawdowns. That is a very different objective than the investor who just wants whatever risk and return a benchmark, allocation, or index provides. Absolute returns require skill and active management of risk and exposure to markets.

Absolute return as a strategy: absolute return is sometimes used to define an investment strategy. An absolute return strategy is a plan, method, or series of maneuvers aiming to compound capital positively and to avoid big losses to capital in difficult market conditions. Whereas Relative Return strategies typically measure their success in terms of whether they track or outperform a market benchmark or index, absolute return investment strategies aim to achieve positive returns irrespective of whether the prices of stocks, bonds, or commodities rise or fall over the market cycle.

Absolute Return Investment Manager

Whether you think of absolute return as an objective or a strategy, it is a skill-based rather than market-based. That is, the absolute return manager creates his or her results through tactical decision-making as opposed to taking what the market is giving. One can employ a wide range of approaches toward an absolute return objective, from price-based trend following to fundamental analysis. In the ASYMMETRY® Managed Accounts, I believe price-based methods are more robust and lead to a higher probability of a positive expectation. Through my historical precedence, testing, and experience, I find that any fundamental type method that is based on something other than price has the capability to stray far enough from price to put the odds against absolute returns. That is, a manager buying what he or she believes is undervalued and selling short what he believes is overvalued can go very wrong if the position is on the wrong side of the trend. But price cannot deviate from itself. Price is the judge and the jury.

To create absolute returns, I necessarily focus on absolute price direction. Not relative strength, which is a rate of change relative to another moving trend. And, I focus on actual risk, not some average risk or an equation that oversimplifies risk like standard deviation.

Of course, absolute return and the “All Weather” type portfolio sound great and seem to be what most investors want, but it requires incredible skill to execute. Most investors and advisors seem to underestimate the required skills and experience and most absolute return strategies and funds have very limited and unproven track records. There is no guarantee that these strategies and processes will produce the intended results and no guarantee that an absolute return strategy will achieve its investment objective.

For an example of the application of an absolute return objective, strategy, and return-risk profile, visit http://www.asymmetrymanagedaccounts.com/