The stock market is getting a lot of attention this past week since the global stock market indexes were down as much as -4% for the MSCI EAFE Developed Countries index to the most significant decliner in the U.S. was the NASDAQ (represented below by PowerShares QQQ), which declined over -7%.

I said in What’s going to happen next? on Friday, the most important factor is the stock index is near its prior low in February when it declined -10% sharply. To reemphasize the rest of what I said:
“By my measures, it’s also reached the point of short-term oversold and at the lower price range that I consider is within a “normal” correction.
I know many traders and investors were expecting to see a retest of that low and now they have it. So, I expect to see buying interest next week. If not, look out below… who knows how low it will need to go to attract buying demand.”
As expected, so far today stocks have indeed found some buying demand at the prior low as we see in the chart below. As I suggested, this second low could bring in buyers who were waiting for this retest of the low in February.
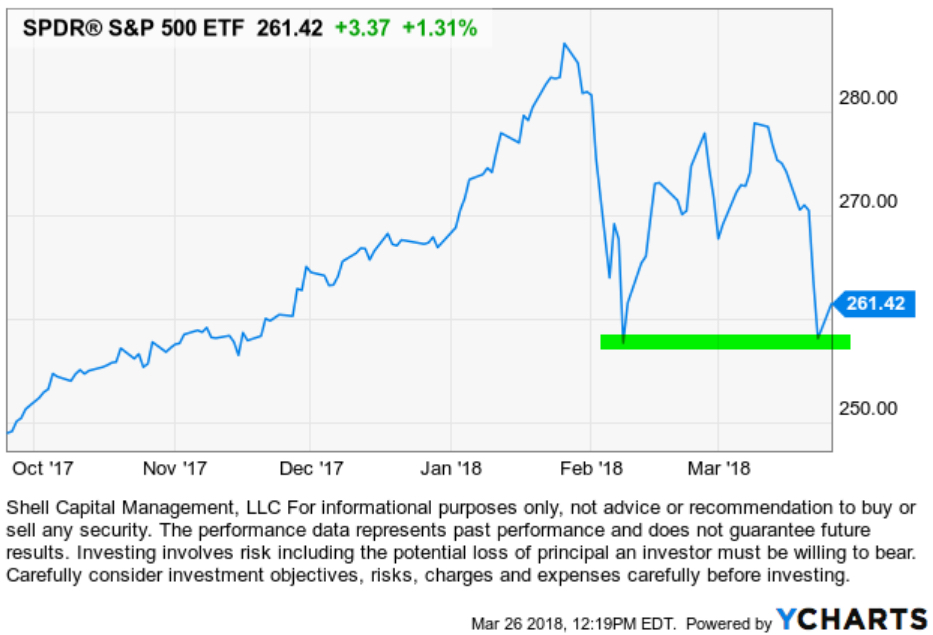
Only time will tell how much buying enthusiasm we see from here. It could be enough to eventually drive prices to new highs, and this -10% correction forms a “W” pattern and the correction quickly forgotten.
Or, the buying interest we see now may not be enough to continue a sustainable upward trend.
Ultimately, the price trend of our individual positions is the final arbiter. My decisions are made based on what the price trend is actually doing.
But, I have other quantitative and technical measures that can be a useful guide to update expectations as trends unfold. I look at these trends because I enjoy it and share my observations, so you get a glimpse of how I see trends unfold over time.
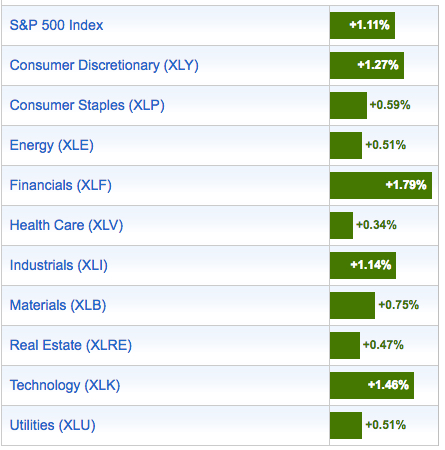
This could change any moment, but at this point, I see today’s gains are relatively broad as all the U.S. sectors are positive with Financials, Consumer Discretion, and Technology leading the way. Past performance does not guarantee future results, but Sector strength in the more cyclical Financials, Consumer Discretionary, and Technology leading the way is a good sign.
Getting more technical and quantitative, I want to update the breadth indicators I shared at the lows on February 9th in Stock Market Analysis of the S&P 500
At the lows, in February I pointed out the % of stocks in the S&P 500 had shifted from what I consider the “Higher Risk Zone” to the “Lower Risk Zone.” Though that could have been the early stage of a bear market because it could have got much worse, but those stocks instead reversed up from that point. Last weeks downtrend pushed them even deeper in what I consider the “Lower Risk Zone.”
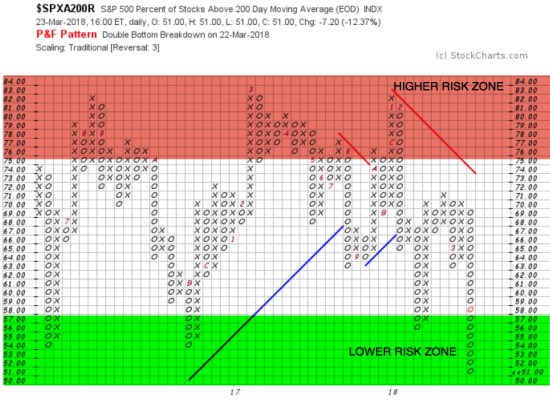
As we see in the chart above, half of the 500 stocks in the S&P 500 stock index are trending below their own 200 day moving average and half are trending above it. I used the Point & Figure method to clearly express the % of stocks in the S&P 500 that are above their 200 day moving average.
If you think about how long 200 trading days is, it’s about 10 months. If a price is trading above its moving average, it’s considered to be in a positive trend, if it’s trending below the average it is trending down. My trend signals are generated from more robust proprietary systems, so I do not trade using this moving average, but it can be a simple guide to illustrate a trend.
To be precise, at the February low 56% of the 500 stocks were trading in a positive trend after they had reached what I consider a “Higher Risk Zone” in January when most of the stocks, 82%, were in a positive trend. After many stocks trended down, they reversed up to the point that 71% were above their 200-day average during the countertrend. Now that prices have fallen again, even more stocks are in a downtrend.
It may seem a contradiction for this to be potentially bullish because it shows half the stocks have been trending down (and it is), but I’ve been observing this indicator for two decades and what I see in the most simple terms is:
- When most stocks had already trended up as they had in January when 82% were in positive trends, we are likely to see a countertrend and mean reversion at some point.
- When most stocks have already trended down to negative trends, we are likely to see a countertrend and mean reversion.
Guess what mean reversion is?
About halfway…
For those who aren’t as mathematically inclined, that would be the 50-yard line. The 50% on the chart above…
Now, keep in mind, it’s only at 51% down from 82% in January. It could go to 5 or 10%, which would take a significant decline from here. But, so far, the ball is on the 50. Which end zone it reaches next will depend on who is stronger; the buyers or the sellers.
If you want more detail and to better understand where I am coming from, revisit what I wrote in February: Stock Market Analysis of the S&P 500.
Risk management is the common characteristic among all the best traders/investors who have lasted over the many significant up and down market cycles of the past decades. I decided I was going to be one of them over two decades ago. No matter how you choose what and when to buy, it is essential to control the size of your potential loss. If you want to learn what I mean by that, read the previous ten or twenty observations I’ve shared here. This is not individual investment advice. The only individuals who get our advice are clients who have an investment management agreement with us. If you have any questions, contact us.
Mike Shell is the Founder and Chief Investment Officer of Shell Capital Management, LLC, and the portfolio manager of ASYMMETRY® Global Tactical.
You can follow ASYMMETRY® Observations by click on on “Get Updates by Email” on the top right or follow us on Twitter.
The is no guarantee that any strategy will meet its objective. Past performance is no guarantee of future results. The observations shared are for general information only and are not intended to provide specific advice or recommendations for any individual.

You must be logged in to post a comment.