Volatility trading may be used for asymmetric risk/reward when the odds are in our favor.
That’s the proposition of:
Volatility trading may be used for asymmetric risk/reward when the odds are in our favor.
That’s the proposition of:
According to Cboe, the objective of a strangle is to capture the volatility premium inbedded in option prices, but with less risk than in a straddle, another established premium capture strategy.
We shared this observation on Asymmetric Investment Returns “We Could Strangle the VIX“
Expected volatility for the S&P 500 is fading.
A CBOE Volatility Index (VIX) level of 15.78 signals the market expectation for annualized vol over the next 30 days has now declined to 15.78%.

Options speculators and hedgers don’t seem too concerned about the upcoming seasonally weak period, among other risks.
Mike Shell is the Founder and Chief Investment Officer of Shell Capital Management, LLC, and the portfolio manager of ASYMMETRY® Global Tactical. Mike Shell and Shell Capital Management, LLC is a registered investment advisor focused on asymmetric risk-reward and absolute return strategies and provides investment advice and portfolio management only to clients with a signed and executed investment management agreement. The observations shared on this website are for general information only and should not be construed as advice to buy or sell any security. Securities reflected are not intended to represent any client holdings or any recommendations made by the firm. Any opinions expressed may change as subsequent conditions change. Do not make any investment decisions based on such information as it is subject to change. Investing involves risk, including the potential loss of principal an investor must be willing to bear. Past performance is no guarantee of future results. All information and data are deemed reliable but is not guaranteed and should be independently verified. The presence of this website on the Internet shall in no direct or indirect way raise an implication that Shell Capital Management, LLC is offering to sell or soliciting to sell advisory services to residents of any state in which the firm is not registered as an investment advisor. The views and opinions expressed in ASYMMETRY® Observations are those of the authors and do not necessarily reflect a position of Shell Capital Management, LLC. The use of this website is subject to its terms and conditions.
The year 2020 has been quite a ride for most of us.
It started out with the stock indexes trending up, then collapsing over -30% in March. Now, the stock market proxies are reaching new highs.

Clearly, the trend is up recently, and we’re in this trend.
Overall, these volatile conditions has been hostile for both active and passive strategies.
I’m about as active, tactical, as it gets, and even I’m not thrilled with 2020.
I normally enjoy volatility expansions and such, but this one has presented unprecedented risks from the uncertainty of the global pandemic, but also the risk of price shocks as we saw in March.
Oh, and then there was a contentious Presidential Election.
The risk now is a price shock driven by the enormous stimulus because of the uncertainty of how it will all unfold.
It’s all part of it, and I do embrace uncertainty. I enjoy watching how a movie unfolds, and don’t like to know in advance, even if I could.
I just keep doing what I do; adapt, improvise, and overcome.
It is what it is.
Speaking of volatility: the CBOE S&P 500 Volatility Index (VIX) signals expected volatility is evaporating. The VIX has contracted back down to near 20 again, the same range it reached in August. So, the demand for the protection of options is declining. Sometimes it’s a good sign, and the volatility contraction could continue. Notice in January and February the VIX was at 12, today it’s nearly 22, so it’s elevated.

I’m on guard to protect my profits, so I actively monitor risk and sentiment indicators to see when the potential for a price trend reversal is more likely.
I think we’re starting to get there, but we’ve got aggressive stimulus acting as a put option.
It could keep going.
But, the percent of stocks in the S&P 500 above their 200 day moving averages measures the breadth of participation in the uptrend. Right now, 90% of the 500 or so stocks are in longer term uptrends. That means only 10% are not in uptrends. This strong breadth is a positive sign for momentum, but once it reaches such a high level I begin to wonder when the buying enthusiasm may dry up.

After most of the stocks have already been driven up, we have to wonder when the bullish sentiment reverses to selling pressure.
If you want to realize profits, we have to take them at some point.
Unrealized profits are just the markets money, and can fade away quickly, and even become a loss.
That’s all I’ll share for now. I’m just seeing some signs of what may be becoming an inflection point.
I’m usually more early than I am late, so we’ll see how it unfolds from here.
Investors who are inclined to actively manage risk may start considering reducing exposure or hedging off the risk of loss.
Have a Happy Thanksgiving!
Mike Shell is the Founder and Chief Investment Officer of Shell Capital Management, LLC, and the portfolio manager of ASYMMETRY® Global Tactical. Mike Shell and Shell Capital Management, LLC is a registered investment advisor focused on asymmetric risk-reward and absolute return strategies and provides investment advice and portfolio management only to clients with a signed and executed investment management agreement. The observations shared on this website are for general information only and should not be construed as advice to buy or sell any security. Securities reflected are not intended to represent any client holdings or any recommendations made by the firm. Any opinions expressed may change as subsequent conditions change. Do not make any investment decisions based on such information as it is subject to change. Investing involves risk, including the potential loss of principal an investor must be willing to bear. Past performance is no guarantee of future results. All information and data are deemed reliable but is not guaranteed and should be independently verified. The presence of this website on the Internet shall in no direct or indirect way raise an implication that Shell Capital Management, LLC is offering to sell or soliciting to sell advisory services to residents of any state in which the firm is not registered as an investment advisor. The views and opinions expressed in ASYMMETRY® Observations are those of the authors and do not necessarily reflect a position of Shell Capital Management, LLC. The use of this website is subject to its terms and conditions.
I’m hearing a lot of talk about the CBOE Equity Put/Call Ratio tapping an extreme low again. At 0.38, the ratio between equity puts and calls has once again reached its lowest level of the past year.

For a broader perspective, here is the CBOE Equity Put/Call Ratio going back to 2006. Indeed, the current ratio between equity puts and calls is as low as it gets. The lowest level was in 2010, when it reached 0.32, barely lower than the current 0.38 reading. Yes, indeed, the CBOE Equity Put/Call Ratio reaching an extremely low level. In fact, it’s as low as it has ever been going back to 2006.

Normally, we consider such a low level to be an example of extreme complacency and GREED DRIVING THE MARKET. For example, the CBOE Equity Put/Call Ratio is the first of seven indicators used in the Fear & Greed Index.

When the ratio is trending down and at a low level, it’s because equity Call option volume is greater than the equity Put option volume. When there’s more trading volume in equity calls, we assume options traders buying speculative calls, so they are bullish. VERY bullish now.
When the market is so one-sidedly bullish, it’s a contrarian indicator suggesting over-enthusiasm. That is, we assume the calls are mostly speculative positions and puts are defensive, so the demand is on the long side. It’s an imperfect assumption, but I generally agree.
I pointed out a similar extreme read out early June, when Call Volume spiked up to a historically high level. Indeed, the stock market had a -6% down day afterward. This time is a little different, and the chart shows why. Call volume isn’t nearly as high, relatively speaking.

Call volume isn’t as high as it was in June, but put volume is also lower. So, the ratio is at the same low level at 0.38, but the absolute volume is different. It’s still probably an indication of enthusiasm and complacency, but it may not have the delta it had last time.

Keep in mind, even though a call option gives the buyer the right, but not the obligation, to buy a stock at a specified price within a specific time period, call volume also includes sellers of call options. So, the dominant demand could be the selling of call options instead of buying them, but every seller needs a buyer, and the prevailing direction of the trend hints as to the dominant side the market is enthusiastic about.
We can say the same about put option volume. While a put option gives the buyer the right, but not the obligation, to sell a stock at a specified price within a specific time period, put volume also includes sellers of call options. Buying a put option is bearish, but selling a put option is bullish.
Still, the general direction of put/call volume is that equity call volume is assumed to be mostly speculative bets on the stock to rise and put volume is primarily speculative (or hedging) bets on the stock to fall.
So, an observation of put and call volume includes a combination of the options market belief the stocks will trend up, but also less desire to protect against stocks going down.
This time, as seen in the chart, the primary difference in the current Put/Call Ratio is a lower level of put volume, requiring less of an uptrend in call volume to drive the ratio up.
I hope this helps!
Don’t miss out. Get an email of new ASYMMETRY® Observations:
Mike Shell is the Founder and Chief Investment Officer of Shell Capital Management, LLC, and the portfolio manager of ASYMMETRY® Global Tactical. Mike Shell and Shell Capital Management, LLC is a registered investment advisor focused on asymmetric risk-reward and absolute return strategies and provides investment advice and portfolio management only to clients with a signed and executed investment management agreement. The observations shared on this website are for general information only and should not be construed as advice to buy or sell any security. Securities reflected are not intended to represent any client holdings or any recommendations made by the firm. Any opinions expressed may change as subsequent conditions change. Do not make any investment decisions based on such information as it is subject to change. Investing involves risk, including the potential loss of principal an investor must be willing to bear. Past performance is no guarantee of future results. All information and data are deemed reliable but is not guaranteed and should be independently verified. The presence of this website on the Internet shall in no direct or indirect way raise an implication that Shell Capital Management, LLC is offering to sell or soliciting to sell advisory services to residents of any state in which the firm is not registered as an investment advisor. The views and opinions expressed in ASYMMETRY® Observations are those of the authors and do not necessarily reflect a position of Shell Capital Management, LLC. The use of this website is subject to its terms and conditions.
I see some hedging demand in the options market.
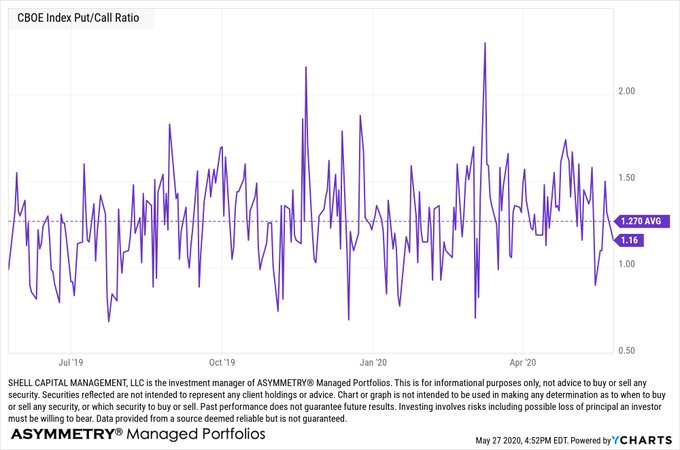
The ratio between Index puts and calls doesn’t get much higher than this. The CBOE Index Put/Call Ratio is elevated at 1.86, indicating probable hedging in the options market.

To be sure, here is the index put volume compared to index call volume.

Total options volume is relatively low for 2020, however.

But, right at its long term average.

The CBOE Equity Put/Call Ratio shows us the relative volume of individual stock puts and calls. Equity call volume was extremely high on June 8th, and has since mean reverted. I considered it to be very speculative, since call options are mostly traded for upside speculation in the underlying stock.

I pointed out before that speculative call volume reached an extreme high level, which was a contrary indicator.

Indeed, the S&P 500 index peaked with the peak in speculative call buying.

The decline in the S&P 500 so far has only been -7%, and it started June 8th. It remains about -6% from its high.

The options market doesn’t see a lot of hedging near the stock market peaks, but it sure does after the market trends down.

The S&P 500 tapped the 200 day moving average last week, but is trying to trend above it. Today was a good start, if it can hold the line.

For those who like the concept of mean reversion, here’s your sign.

This market has impressive resilience, but we never know the next -5% or larger down day is coming.
Well, I may not know for sure, but I know when the odds are stack in our favor as I showed in “If we’re going to see a second leg down, this is where I think it will start.”
For now, expected volatility contracted nearly -9% today, so the options market believes we’ll see less range over the next 30 days.

We’ll see…
Mike Shell is the Founder and Chief Investment Officer of Shell Capital Management, LLC, and the portfolio manager of ASYMMETRY® Global Tactical. Mike Shell and Shell Capital Management, LLC is a registered investment advisor focused on asymmetric risk-reward and absolute return strategies and provides investment advice and portfolio management only to clients with a signed and executed investment management agreement. The observations shared on this website are for general information only and should not be construed as advice to buy or sell any security. Securities reflected are not intended to represent any client holdings or any recommendations made by the firm. Any opinions expressed may change as subsequent conditions change. Do not make any investment decisions based on such information as it is subject to change. Investing involves risk, including the potential loss of principal an investor must be willing to bear. Past performance is no guarantee of future results. All information and data are deemed reliable but is not guaranteed and should be independently verified. The presence of this website on the Internet shall in no direct or indirect way raise an implication that Shell Capital Management, LLC is offering to sell or soliciting to sell advisory services to residents of any state in which the firm is not registered as an investment advisor. The views and opinions expressed in ASYMMETRY® Observations are those of the authors and do not necessarily reflect a position of Shell Capital Management, LLC. The use of this website is subject to its terms and conditions.
Implied volatility, as measured by the CBOE Volatility Index (VIX) has trended up about 50% since the most recent low on June 5th. I’ll call it a moderate volatility expansion. Normally a volatility expansion from 23 to 40 would be considered a material event, but relative to the highest spike we’ve seen in March, it doesn’t seem huge for 2020.

The Bank of America Bull & Bear Indicator is at 0.90 vs. 0.40 last week. It is used as contrarian indicator to identify market extremes in investor sentiment. Currently, their measure of investor sentiment is very bearish, which is bullish for the stock market.

Bank of America Private Client Sentiment shows bearishness, and here is a line chart showing its history.

On the topic of investor sentiment, and the Bank of America Bull & Bear Indicator, here is a chart of its history going back to 2002. As marked on the chart, it was backtested pre-2013.

I share the CNN Fear & Greed Index a lot, because it’s easily assessable, so anyone can view it. The Fear & Greed Index is neutral right now.

Within the Fear & Greed Index are seven different investor sentiment indicators. Unlike the Bank of America Private Client Bull & Bear Indicator, which is a survey of their clients, the Fear & Greed Index is derived from quantitative technical indicators.
Stock price breadth, or how well stocks are participating in the uptrend, is the leading driver on the Greed side. They use the McClellan Volume Summation Index, which measures advancing and declining volume on the NYSE. It shows during the last month, approximately 8.08% more of each day’s volume has traded in advancing issues than in declining issues, pushing this indicator towards the upper end of its range for the last two years, which is extremely bullish.

The only other of the seven indicators showing bullish investor sentiment is safe haven demand. That is, the demand for bonds over stocks. They measure it by the difference between the past 20 day stock and bond returns. Stocks have outperformed bonds by 6.99% during the last 20 trading days. This is close to the strongest performance for stocks relative to bonds in the past two years and indicates investors are rotating into stocks from the relative safety of bonds. Of course, this bullish investor sentiment is a sign that greed is driving the market. Notwithstanding these two extremes, overall, the Fear & Greed Index remains neutral.

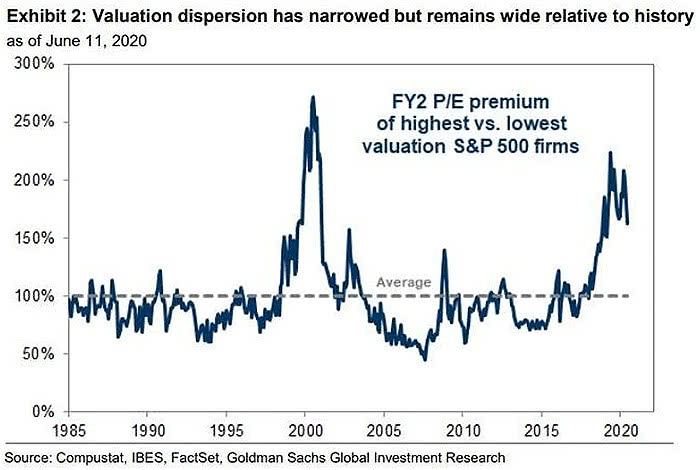
Value is a Value
The dispersion of stock valuation multiples between the lowest and highest valuations has narrowed. But, despite the recent relative strength in value, it is still wide relative to history. So, value stocks remain a relative value.
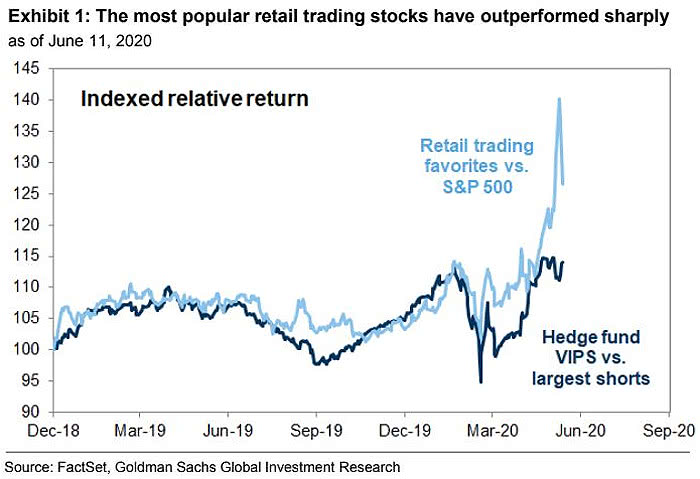
Hot Momentum Stocks are Showing Relative Strength
According to Goldman Sachs, the most popular retail trading stocks have materially outperformed the S&P 500, so far.
Cross-Asset Realized Volatility has been Extreme
Another sign of dispersion is the number of 3 standard deviation prices moves. We’ve already seen more extreme trends across asset classes in 22 years.

Despite the impressive V shaped rally from what is so far the low on March 23rd, I continue to notice the mean reversion year to date and over the past year. Here is year to date, and I marked the high, low, and average percentage.

At the low, the S&P 500 was down about -31% YTD. With the help of a very aggressive Federal Reserve proving liquidity, it has recovered most of the decline in one of the fastest in history.
It ain’t over till it’s over, and this ain’t over.
Asymmetry is about the upside vs. the downside in terms of asymmetric risk/reward. No observation of the price trend is complete without also noting the downside drawdown it took to achieve it. The drawdown for the S&P 500 was an astonishing -34% in just 23 days. It’s a reminder of risk.

I believe risk must be measured, directed, and controlled if we are to compound capital positively.
It doesn’t matter how much the return is if the downside risk is so high you tap out before it’s achieved.
Clearly, in 2020, we’ve surely seen some of the finest examples of risk, divergence, and volatility.
Mike Shell is the Founder and Chief Investment Officer of Shell Capital Management, LLC, and the portfolio manager of ASYMMETRY® Global Tactical. Mike Shell and Shell Capital Management, LLC is a registered investment advisor focused on asymmetric risk-reward and absolute return strategies and provides investment advice and portfolio management only to clients with a signed and executed investment management agreement. The observations shared on this website are for general information only and should not be construed as advice to buy or sell any security. Securities reflected are not intended to represent any client holdings or any recommendations made by the firm. Any opinions expressed may change as subsequent conditions change. Do not make any investment decisions based on such information as it is subject to change. Investing involves risk, including the potential loss of principal an investor must be willing to bear. Past performance is no guarantee of future results. All information and data are deemed reliable but is not guaranteed and should be independently verified. The presence of this website on the Internet shall in no direct or indirect way raise an implication that Shell Capital Management, LLC is offering to sell or soliciting to sell advisory services to residents of any state in which the firm is not registered as an investment advisor. The views and opinions expressed in ASYMMETRY® Observations are those of the authors and do not necessarily reflect a position of Shell Capital Management, LLC. The use of this website is subject to its terms and conditions.
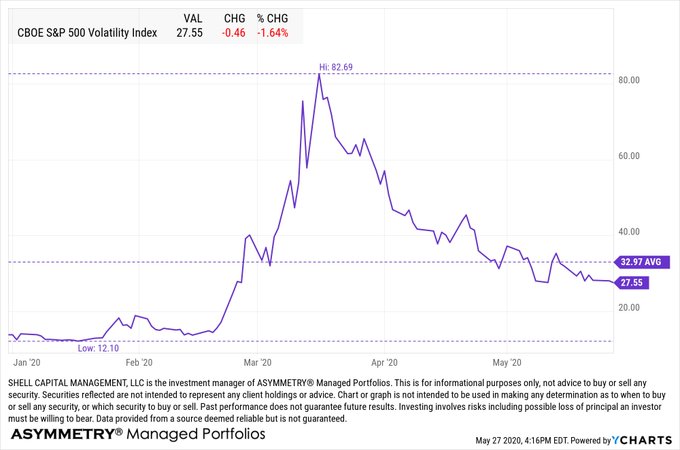
The CBOE Volatility Index (VIX) estimates expected volatility by aggregating the weighted prices of S&P 500 Index (SPX) puts and calls over a wide range of strike prices. Specifically, the prices used to calculate VIX Index values are midpoints of real-time SPX option bid/ask price quotations.
CBOE Volatility Index (VIX) has averaged 33 this year with a low of 12 and high of 83.69, the highest implied volatility has ever been.
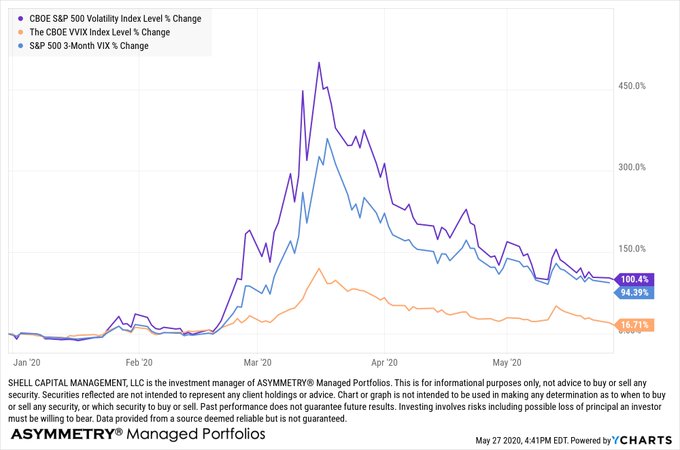
The VIX futures curve is in contango about 80% of the time and normally goes into backwardation in stressed markets.
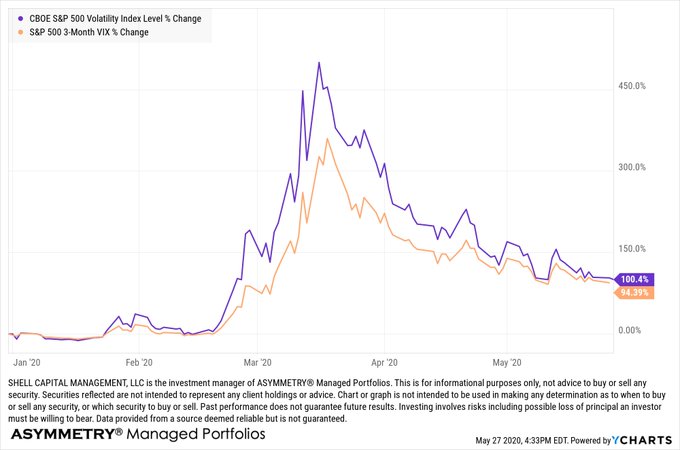
VIX is a gauge of expected future volatility and VVIX is the vol of VIX. Both suggest a lower future vol. We’ll see.
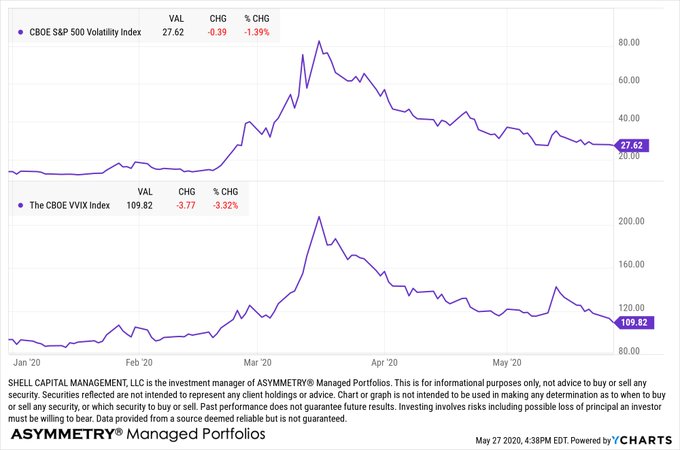
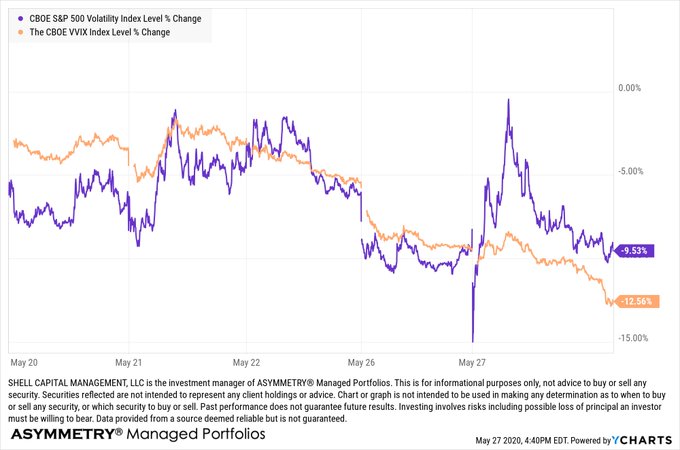
The VVIX is drifting down relative to VIX the past five days.
Forecasts of volatility for stocks are valuable for investors as a measure of traders’ uncertainty about a stock or index price. With VIX we can quickly gauge the future expectation for volatility priced by options. If it’s a “fear gauge”, it’s indicating less fear.
The CBOE Index Put/Call Ratio is back to its long term average. I believe index options are mostly traded by fund managers for hedging.
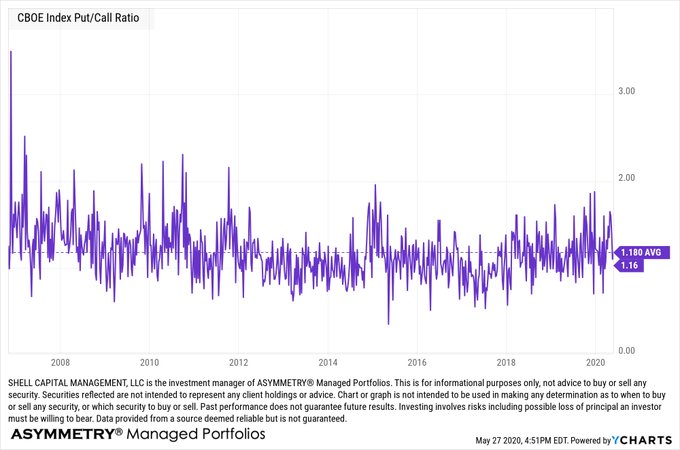
The CBOE Index Put/Call Ratio is just under its one year average. It was about 0.70 before the March waterfall decline.
CBOE Equity Put/Call Ratio is trending toward the low level was saw before the waterfall decline in March. A falling put-call ratio, or a ratio less than 1, means that traders are buying fewer puts than calls. It suggests that bullish sentiment is building in the market.
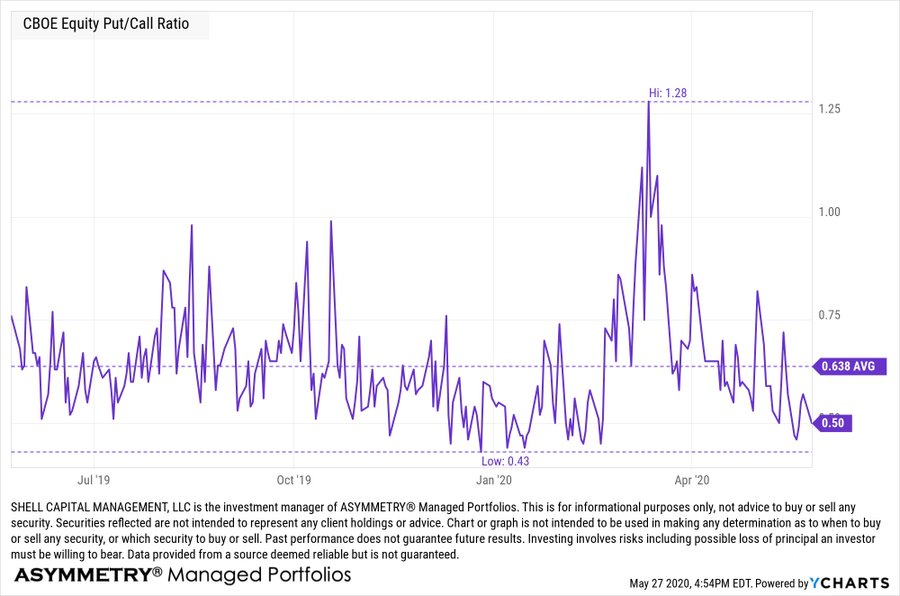
CBOE Equity Put/Call Ratio drifting down to 0.50 may be an early warning sign the market is becoming complacent.
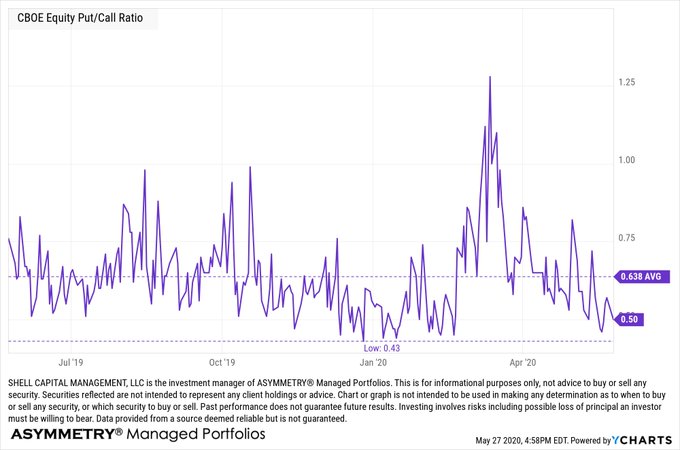
Since I believe index options are mostly used by money managers for hedging, I consider its level around average to be normal. But I believe equity options are traded more by speculators, so it may be the earlier gauge of a shift in sentiment.
I was talking volatility trading with someone recently when it occurred to me I was learning Lotus 1-2-3 for advanced accounting in the 90s when I first started exploring volatility and VIX indexes. So, I’ve been observing the volatility profile a long time.
I wouldn’t be surprised to see another volatility expansion before we see implied volatility back down dow 20 or lower.
Another useful way I like to illustrate the volatility contractions and expansions to clients is a volatility channel. In the chart I used two standard deviations from the 20 day moving average around the S&P 500 price trend to show an upside breakout known as Bollinger Bands. The chart below is is the width of the bands, which is a good illustration of the volatility expansion and contraction the past two months.

Periods of volatility contractions are eventually followed by volatility expansions.
Mike Shell is the Founder and Chief Investment Officer of Shell Capital Management, LLC, and the portfolio manager of ASYMMETRY® Global Tactical. Mike Shell and Shell Capital Management, LLC is a registered investment advisor focused on asymmetric risk-reward and absolute return strategies and provides investment advice and portfolio management only to clients with a signed and executed investment management agreement. The observations shared on this website are for general information only and should not be construed as advice to buy or sell any security. Securities reflected are not intended to represent any client holdings or any recommendations made by the firm. Any opinions expressed may change as subsequent conditions change. Do not make any investment decisions based on such information as it is subject to change. Investing involves risk, including the potential loss of principal an investor must be willing to bear. Past performance is no guarantee of future results. All information and data are deemed reliable but is not guaranteed and should be independently verified. The presence of this website on the Internet shall in no direct or indirect way raise an implication that Shell Capital Management, LLC is offering to sell or soliciting to sell advisory services to residents of any state in which the firm is not registered as an investment advisor. The views and opinions expressed in ASYMMETRY® Observations are those of the authors and do not necessarily reflect a position of Shell Capital Management, LLC. The use of this website is subject to its terms and conditions.
And just like that, we have another volatility expansion.
Yesterday, in Global Macro: Volatility expands and divergence between sectors I suggested “It is likely we’ll see a volatility expansion from here.” Indeed, with the VIX and VVIX (volatility of volatility) both up 10% today, we are entering a volatility expansion.

Implied volatility had settled down gradually since it peaked in March, but it now looks like we may see prices spread out into a wider range.
As of this moment, the S&P 500 is down -2.34% and it is reversing down from the average of its price trend year to date, so I’ll call it “mean reversion.”

In fact, it’s mean reversion from the 1 year price trend, too.

It’s a negative sign that small and mid size stocks are trending down even more, down nearly -4%. They’ve been laggards in this rally from the March low. In the early stage of a new bullish trend, smaller companies should trend up faster. Smaller companies are more nimble than large companies, so we expect to see them recover quicker from declines. When they don’t, we consider it a bearish divergence.

I can’t say I’m surprised. This is likely the early stage of a deeper bear market as I’ve operated through 2000-03 and 2007-09.
But, nothing is ever a sure thing. It’s probabilistic and probably necessarily implies uncertainty.
Managing money though a big bear market isn’t as simple as an ON/OFF switch, whereby we get out near the peak and then reenter near the low. I’ve traded through a lot of nasty market conditions, the nastiest aside from the Great Depression, and that isn’t how it has worked for me. I didn’t just get out and then back in a year or two later. There are opportunities in between for skilled tactical traders who are able to direct and control risk and manage drawdowns.
There’s a good chance this becomes a prolonged bear market similar to what we’ve seen twice over the past two decades I’ve been a professional money manager.
I wrote yesterday;
“It’s probably a good time for individual investors who don’t have tight risk management systems to shift to defense to preserve capital, but it’s not a guarantee, and yes, we’ll see.”
I’ll just leave it at that, today.
Mike Shell is the Founder and Chief Investment Officer of Shell Capital Management, LLC, and the portfolio manager of ASYMMETRY® Global Tactical. Mike Shell and Shell Capital Management, LLC is a registered investment advisor focused on asymmetric risk-reward and absolute return strategies and provides investment advice and portfolio management only to clients with a signed and executed investment management agreement. The observations shared on this website are for general information only and should not be construed as advice to buy or sell any security. Securities reflected are not intended to represent any client holdings or any recommendations made by the firm. Any opinions expressed may change as subsequent conditions change. Do not make any investment decisions based on such information as it is subject to change. Investing involves risk, including the potential loss of principal an investor must be willing to bear. Past performance is no guarantee of future results. All information and data are deemed reliable but is not guaranteed and should be independently verified. The presence of this website on the Internet shall in no direct or indirect way raise an implication that Shell Capital Management, LLC is offering to sell or soliciting to sell advisory services to residents of any state in which the firm is not registered as an investment advisor. The views and opinions expressed in ASYMMETRY® Observations are those of the authors and do not necessarily reflect a position of Shell Capital Management, LLC. The use of this website is subject to its terms and conditions.
Implied volatility is mean revering in some ways. Volatility expands and contracts, so it oscillates between a higher level an a lower range.
I was monitoring various measures of volatility, such as the CBOE Implied Volatility Index as my systems were indicating a potential short term trend change.
Sure enough, at the end of the trading day, VIX expanded 20%.

Over the year to date time frame, VIX has reverted to its mean.
It is likely we’ll see a volatility expansion from here.
The VIX is implied volatility, which is its the expected vol over the next 30 days for the S&P 500 stocks. More specifically, a VIX of 33 implies a 2% range over the next 30 days. That’s less than half what it was in March with the VIX at 80, it implied a 5% range in prices. Still, investors have gotten used to a VIX around 12 or lower in recent years, except for the occasional volatility expansions. Over the past decade, the bull market presented an average VIX of 17.45, which is materially lower than the long term average of 19.36. At a 17 vol, the implied vol is around 1% a month.

The VIX isn’t always right. Implied vol is calculated based on the options prices of the S&P 500 stocks. It’s a forward looking expectation, as opposed to a rear view looking historical actual volatility, such as standard deviation.
The VIX of VIX (VVIX) is a measure of the volatility of the VIX. The CBOE’s VIX measures the short-term volatility of the S&P 500, and the VVIX measures the volatility of the price of the VIX. So, we call it the VIX of VIX, or the vol of vol.
VVIX gained 10% today, too, signaling a vol expansion.

All of this is coming at at time when my systems are showing a declining rate of change over the past month. The initial thrust off the March 23rd low had momentum, but since then the rate of change has been slowing. It’s running out of steam, or velocity.
Don’t fight the Fed
My systems monitor thousands of macroeconomic data and programmed to let me know what has changed. Macroeconomics is an observation of the entire economy, including the growth rate, money and credit, exchange rates, the total amount of goods and services produced, total income earned, the level of employment of productive resources, and the general behavior of prices.
I know, sounds exhausting. It is, unless you have a computerized quantitate systems to do it with perfection.
Looking at global macroeconomics, the Fed balance sheet is a key right now.
The H.4.1 from the Federal Reserve is a weekly report which presents a balance sheet for each Federal Reserve Bank, a consolidated balance sheet for all 12 Reserve Banks, an associated statement that lists the factors affecting reserve balances of depository institutions, and several other tables presenting information on the assets, liabilities, and commitments of the Federal Reserve Banks.
US Total Assets Held by All Federal Reserve Banks is the total value of assets held by all the the Federal Reserve banks. This can include treasuries, mortgage-backed securities, federal agency debt and and so forth. During the Great Recession, having already lowered the target interest rate to 0%, the Federal Reserve further attempted to stimulate the US economy by buying and holding trillions of dollars worth of US treasuries and mortgage-backed securities, a process known as Quantitative Easing or QE.
US Total Assets Held by All Federal Reserve Banks is at a current level of 6.721 TRILLION, up from 6.656 TRILLION last week and up from 3.890 TRILLION one year ago. This is a change of 72.80% a year ago.
The chart shows the last 15 years. I marked the last recession in grey.

It’s really high.
The Fed seems much more concerned this time as they have rolled out a much larger helicopter to drop over the cash.
I’m seeing a lot of divergence between sectors as a smaller number of stocks The chart is year to date. Only Technology is positive, by 1.86%. Otherwise, it’s a relative notable range of divergence.

The sector divergence is more obvious over the past month. Barely half of the sectors are positive, the rest and down.

This is just a simple illustration of what appears to be some weakness. The rate of change is slowing and I’m guessing it’s been driven by the massive Fed action.
Now, America is opening for business, but some research I’ve been doing shows it may be a bigger problem that I thought.
I’ll share that shortly.
I’ve also got an important piece I’m going to share about my experience trading the last two big bear markets.
It seems inevitable we’ll get to flow through another one and this one may be bigger and badder, we’ll see.
I think skill and experience is going to be an edge and make all the difference as it did in the past, we’ll see.
But, nothing is ever a sure thing. It’s probabilistic, but probably necessarily implies uncertainty.
It’s probably a good time for individual investors who don’t have tight risk management systems to shift to defense to preserve capital, but it’s not a guarantee, and yes, we’ll see.
Mike Shell is the Founder and Chief Investment Officer of Shell Capital Management, LLC, and the portfolio manager of ASYMMETRY® Global Tactical. Mike Shell and Shell Capital Management, LLC is a registered investment advisor focused on asymmetric risk-reward and absolute return strategies and provides investment advice and portfolio management only to clients with a signed and executed investment management agreement. The observations shared on this website are for general information only and should not be construed as advice to buy or sell any security. Securities reflected are not intended to represent any client holdings or any recommendations made by the firm. Any opinions expressed may change as subsequent conditions change. Do not make any investment decisions based on such information as it is subject to change. Investing involves risk, including the potential loss of principal an investor must be willing to bear. Past performance is no guarantee of future results. All information and data are deemed reliable but is not guaranteed and should be independently verified. The presence of this website on the Internet shall in no direct or indirect way raise an implication that Shell Capital Management, LLC is offering to sell or soliciting to sell advisory services to residents of any state in which the firm is not registered as an investment advisor. The views and opinions expressed in ASYMMETRY® Observations are those of the authors and do not necessarily reflect a position of Shell Capital Management, LLC. The use of this website is subject to its terms and conditions.
On February 6th, I shared and observation in “19 is the new 20, but is this a new low volatility regime?” the lower level of implied (expected) volatility at the time may be driven by two factors that may have been resulting in less concern for volatility. I wrote:
The current bull market that started in March 2009 is the longest bull market in history. It exceeded the bull market of the 1990s that lasted 113 months in terms of time, though still not as much gain as the 90s.
The U.S. is in its longest economic expansion in history, breaking the record of 120 months of economic growth from March 1991 to March 2001, according to the National Bureau of Economic Research. However, this record-setting run observed GDP growth far slower than previous expansions.
The aged bull market and economic expansion can naturally lead to some level of complacency and expectation for less downside and tighter price trends. When investors are uncertain, their indecision shows up in a wide range of prices. When investors are smugger and confident, they are less indecisive and it’s usually after a smooth uptrend they expect to continue.
Well, so much for that.
Here we are, the bull market was interrupted by a -37% in the Dow Jones. So, any higher highs from here will be labeled a new bull market.

The US is now in a recession. The longest economic expansion is over, interrupted by a -4.8% GDP, as discussed in “The longest economic expansion in U.S. history is over, but…”

What about volatlity?
I shared several observations of volatility and
Back in December, I wrote “A volatility expansion seems imminent” which was a follow up to November 16th, “Periods of low volatility are often followed by volatility expansions”.
Don’t say I didn’t tell so, in advance.
I also wrote:
Is the volatility expansion over? in December.
On January 27th, published “Here comes the volatility expansion, but is the coronavirus outbreak in China to blame?”
January 30th “Global Macro: is the coronavirus outbreak crushing the China ETF and causing the volatility expansion?”
February 26th was “What volatility expansions tell us about expectations for stock market trends”
March 3rd was pretty clear “Expect wider price swings in a volatility expansion”
Then, on March 10th I wrote again about the volatility expansion “
Why I’m not surprised to see such a volatility expansion”
This chart was featured in the Wall Street Journal by one of the few outside research I read; The Daily Shot.

Oh yes, did that chart reverse trend as expected.
Now there’s this. The CBOE Volatility Index (VIX) spiked to 82, the highest level of implied vol on record.

But since then, it is gradually trending down.

The options market is pricing in less expected volatility for the S&P 500 stocks over the next 30 days.
It’s a volatility contraction.
Will it continue?
It will as long as expected vol keeps declining. I know; captain obvious.
VIX is trending down, but it’s still at 31, and still a wider than average range of prices spreading out.
If we see a reversal down in stocks, then we’ll see volatility spike again. But for now, it’s a volatility contraction, so I’ll take it.
The Fear & Greed Index is only dialed half way up.


Only two of the Fear & Greed Index indicators are showing greed. Safe haven demand is the biggest, which is the difference between the 20-day stock and bond returns. Stocks have outperformed bonds by 16.29% the last 20 trading days. This is close to the strongest performance for stocks relative to bonds in the past two years and suggests investors are rotating into stocks from the relative safety of bonds.

The other is the Put/Call Ratio. During the last five trading days, volume in put options has lagged volume in call options by 44.87% as investors make bullish bets in their portfolios. However, this among the lowest levels of put buying seen during the last two years, indicating greed on the part of investors.

By my measures, the stock market is just now entering the overbought range, technically, on a short term basis.
For example, the percent of S&P 500 stocks above their 50 day moving average is now up to 74% after todays close. It’s the higher risk zone.

As a testiment to the internal damage done, I present the percent of S&P 500 stocks above their 200 day moving average, which is only at 30%. It tells us most stocks are still in a longer term downtrend after reaching a low of only 3% of stocks above their trend line on March 20th.

And yes, it was very near the March 23rd low only three days later.
Most stocks are participating in the uptrend, as measured by 70% of them above their average of the past 50 days.
Volatiltiy is contracting.
Investor sentiment is gradually shifting. Nothing drives sentiment like the price trend. The price trend is the leading indicator, investors enthusiasm follows it.
All while we just saw the largest drop in economic growth since 2008.
Mike Shell is the Founder and Chief Investment Officer of Shell Capital Management, LLC, and the portfolio manager of ASYMMETRY® Global Tactical. Mike Shell and Shell Capital Management, LLC is a registered investment advisor focused on asymmetric risk-reward and absolute return strategies and provides investment advice and portfolio management only to clients with a signed and executed investment management agreement. The observations shared on this website are for general information only and should not be construed as advice to buy or sell any security. Securities reflected are not intended to represent any client holdings or any recommendations made by the firm. Any opinions expressed may change as subsequent conditions change. Do not make any investment decisions based on such information as it is subject to change. Investing involves risk, including the potential loss of principal an investor must be willing to bear. Past performance is no guarantee of future results. All information and data are deemed reliable but is not guaranteed and should be independently verified. The presence of this website on the Internet shall in no direct or indirect way raise an implication that Shell Capital Management, LLC is offering to sell or soliciting to sell advisory services to residents of any state in which the firm is not registered as an investment advisor. The views and opinions expressed in ASYMMETRY® Observations are those of the authors and do not necessarily reflect a position of Shell Capital Management, LLC. The use of this website is subject to its terms and conditions.
On November 15, 2019, I published “Periods of low volatility are often followed by volatility expansions” and included the below chart.
The point is just as the title said, when stock prices trend up quietly, they are eventually interrupted by the loud bang of falling prices.

In this case, it took a few months to see it play out.
Below, I updated the chart so it still has the same starting date, but shows us what happened after I posted it. The 11/15/19 day is labeled on the chart. It had a small decline shortly after, but then resumed the uptrend.

In fact, the stock index went on to gain 9% from that point and was interrupted by only two small countertrend declines of 3-4%.
That is, until February 19th.
Since the peak, the stock index has declined -19% and volatility has exploded.
The volatility measure I used in the chart is an average of the true range, which accounts for a full price range of the period. The average true range is also what I used to draw the channels above and below the price trend to define “normal” price action.
The average true range of the price trend has increased by 420% since December, from 17 to 97. I know it shocked most people in the market and while I didn’t expect a -19% waterfall in just three weeks, I expected a volatility expansion and mean reversion. As I exited stocks a little early, we see now it didn’t matter this time as the stock market has given up far more upside than we missed out on over those few weeks.
Next, let’s look at a chart of implied volatility as indicated by the VIX based on how the market is pricing options. Implied vol spiked over 200%. I also included the 30-Day rolling volatility of the S&P 500 ETF. Implied volatility lead realized, historical, volatility to the upside.

So, the condition of the US stock market is volatile one as prices and swinging up and down, and only December 2008 in the middle of the Financial Crisis was it higher.

If the VIX is a fear gauge, it’s signaling a lot of fear.
Again, “Periods of low volatility are often followed by volatility expansions” and that’s what we got. This time it got stretched on the upside so far it has snapped back to very quickly and violently correct it.
The good news is, the opposite is also true; periods of high volaltity are eventually followed by volatility contractions.
But, just as before, as it took time for the volatility contraction to become a volatility expansion, we’ll probably see a continuation of price swings and elevated volatility for a while.
Eventually, this too shall pass.
Mike Shell is the Founder and Chief Investment Officer of Shell Capital Management, LLC, and the portfolio manager of ASYMMETRY® Global Tactical. Mike Shell and Shell Capital Management, LLC is a registered investment advisor in Florida, Tennessee, and Texas. Shell Capital is focused on asymmetric risk-reward and absolute return strategies and provides investment advice and portfolio management only to clients with a signed and executed investment management agreement. The observations shared on this website are for general information only and should not be construed as advice to buy or sell any security. Securities reflected are not intended to represent any client holdings or any recommendations made by the firm. I observe the charts and graphs to visually see what is going on with price trends and volatility, it is not intended to be used in making any determination as to when to buy or sell any security, or which security to buy or sell. Instead, these are observations of the data as a visual representation of what is going on with the trend and its volatility for situational awareness. I do not necessarily make any buy or sell decisions based on it. Any opinions expressed may change as subsequent conditions change. Do not make any investment decisions based on such information as it is subject to change. Investing involves risk, including the potential loss of principal an investor must be willing to bear. Past performance is no guarantee of future results. All information and data are deemed reliable but is not guaranteed and should be independently verified. The presence of this website on the Internet shall in no direct or indirect way raise an implication that Shell Capital Management, LLC is offering to sell or soliciting to sell advisory services to residents of any state in which the firm is not registered as an investment advisor. The views and opinions expressed in ASYMMETRY® Observations are those of the authors and do not necessarily reflect a position of Shell Capital Management, LLC. The use of this website is subject to its terms and conditions.
I know, it sounds obvious, but yeah, expect wider price swings in a volatility expansion.
The CBOE S&P 500 Volatility Index (VIX) is a popular measure of the stock market’s expectation of volatility based on S&P 500 index options. The VIX Index is a calculation designed to produce a measure of a constant, 30-day expected volatility of the US stock market, derived from real-time, mid-quote prices of the S&P 500® Index (SPXSM) call and put options.
The VIX index shows us the 30-day expected volatility increased 200% during the February 2020 volatility expansion. I may have to define this rate of change as a volatility explosion. Expansion is the act or process of expanding to become or make larger or more extensive. An explosion is a rapid increase in volume and release of energy in an extreme manner. This looks explosive.

Viewing it over a wide range of the past 10 years, the 30-day expected volatility is elevated to the second-highest level seen since the 2007-09 stock market crash. In 2011, the VIX spiked to 48.

Putting it into an even broader perspective with the larger sample size of 26 years of historical data, the recent 40 level is about as elevated as 30-day expected volatility gets.

I observe volatility from a perspective of both implied (expected) volatility and historical (realized) volatility. Implied volatility a measured by the VIX Index, is typically priced at a premium since options trading sentiment tends to have more of a hedging tilt. In theory, the VIX at 40 suggested expected 30-day volatility of 40%, which is much higher than the 21.5% realized vol as measured by 30-day Rolling Volatility derived from the actual past 30 days of price action. This is just an idealized, overly simplified example, but the point is both realized and expected vol is elevated.

Asymmetric volatility is what we see when equities fall sharply. The asymmetric volatility phenomenon is the observed tendency of equity market volatility to be higher in declining markets than in rising markets. Volatility tends to decrease after prices have trended up as investors and traders (the market) become more and more complacent, expecting a smooth uptrend will continue. Then, after prices decline, complacent investors and traders are caught off guard and surprised when prices trend down, and the more prices fall, the more they fear losing more money. The fear of losing money, then, is another driver of asymmetric volatility; Investors experience the pain of loss twice as much as the joy of gains. Nobel Prize-winning behavioral research finds that losses loom larger than gains and that people are loss averse. So, after prices have fallen, investors and traders sell simply because prices are falling, to cut their losses, and avoid larger losses. This selling pressure becomes a serial correlation, contagion, and prices keep falling until the desire to sell has dried up. It’s what I believe, at least, after studying and observing price trends in real-time professionally over two decades.
We saw asymmetric volatility expansion after the astonishingly smooth uptrend in 2017. In the chart, I overlay the 30 Day Rolling Volatility to visualize how the realized vol declined as the S&P 500 trended up quietly. But lower and falling volatility periods tend to be followed by periods of rising volatility.

US equities went on to recover two major price shocks and asymmetric volatility expansions in 2018, but here we are in 2020 seeing another smooth uptrend with great momentum interrupted by volatility expansion driven by a waterfall decline in stocks.

Asymmetric volatility is when prices drift (trend) up and then crash down.
When realized and implied volatility is elevated, we should expect to see price swings both up and down. Recovery from a downtrend like this is a process, not an event. We’ll probably see many swings up and down along the way, which is especially true if this unfolds into a bigger bear market level downtrend. Although anything can happen, bear markets don’t just happen all at once. The worst bear markets like 2007 to 2009 unfolded with price swings over many years, not just in 2008.
Only time will tell if this is the early stage of a bigger move, but in the meantime, expect larger price swings as prices spread out and the weight of investors decide which direction to lean.
Mike Shell is the Founder and Chief Investment Officer of Shell Capital Management, LLC, and the portfolio manager of ASYMMETRY® Global Tactical. Mike Shell and Shell Capital Management, LLC is a registered investment advisor in Florida, Tennessee, and Texas. Shell Capital is focused on asymmetric risk-reward and absolute return strategies and provides investment advice and portfolio management only to clients with a signed and executed investment management agreement. The observations shared on this website are for general information only and should not be construed as advice to buy or sell any security. Securities reflected are not intended to represent any client holdings or any recommendations made by the firm. I observe the charts and graphs to visually see what is going on with price trends and volatility, it is not intended to be used in making any determination as to when to buy or sell any security, or which security to buy or sell. Instead, these are observations of the data as a visual representation of what is going on with the trend and its volatility for situational awareness. I do not necessarily make any buy or sell decisions based on it. Any opinions expressed may change as subsequent conditions change. Do not make any investment decisions based on such information as it is subject to change. Investing involves risk, including the potential loss of principal an investor must be willing to bear. Past performance is no guarantee of future results. All information and data are deemed reliable but is not guaranteed and should be independently verified. The presence of this website on the Internet shall in no direct or indirect way raise an implication that Shell Capital Management, LLC is offering to sell or soliciting to sell advisory services to residents of any state in which the firm is not registered as an investment advisor. The views and opinions expressed in ASYMMETRY® Observations are those of the authors and do not necessarily reflect a position of Shell Capital Management, LLC. The use of this website is subject to its terms and conditions.
Dow Jones is down -10% off its high. I don’t pay much attention to the Dow Jones Industrial Average as it’s a price-weighted index of 30 stocks. But, the S&P 500 capitalization-weighted index of approximately 500 stocks seems a better proxy for “the market,” and it’s not far behind.
Here is the percent off high (drawdown) chart year to date.

We don’t own either of these ETFs, they are for illustration only. In fact, our portfolio is was 85% U.S. Treasuries, and 15% invested in high dividend-yielding positions. One of them has a dividend yield of 9.8% and the other 11.9%, so while their prices may be falling with the stock market, we have some margin of safety from the high yield. In fact, as the prices fall, the yield rises from that starting point.
Speaking of dividend yield below is a visual of the dividend yield of the S&P 500 (1.84’%) and the Dow (2.27%), which are relatively low historically. But, as prices fall, the yields will rise, assuming the stocks in the index keep paying dividends.

In the above chart, I’m using the ETF dividend yields as they are real-time. Since the ETFs have only been trading for two or three decades, to see what I mean by “long term” I look at the S&P 500 Stock Index dividend yield (calculated as 12-month dividend per share)/price) to see how low the yield has been the past twenty years.

So, the future expected return from dividend yields on these stocks indexes is relatively low, looking back 150 years. The spikes you see are after stock market crashes as the price falls, the yield rises, as with bonds. Low dividend yield also suggests the stock market is overvalued. A higher dividend yield indicates the stock market is undervalued, and if nothing else, investors earn a higher income from the dividends from a lower starting price.
Back to the year to date, the short term, the S&P 500 is now down -5% in 2020, and the Dow Jones is down -7%.

I believe this may be the fastest -10% decline in the history of the Dow Jones Industrial average.
I’m just glad we aren’t in it.
This is when drawdown controls and risk management pays. More importantly, it’s when discipline pays. While some investment managers want to manage risk to limit their drawdowns, they don’t always excel at doing it. Discipline is a personal edge. It doesn’t matter how good our scientifically tested quantitative models with a mathematical basis for believing in them are if we lack the discipline to execute them with precision. I can also say it isn’t enough for me to have all the discipline either, as we must necessarily help our investment management clients stick with it, too. So, investor behavior modification is part of our wealth management services. It’s why Christi Shell is not only a Certified Wealth Strategist® with over twenty-six years of experience helping high net worth families with the overall management of assets but also a certified Behavioral Financial Advisor® (BFA®) to help them manage themselves.
It’s what we do.
Need help? Contact us here.
Mike Shell is the Founder and Chief Investment Officer of Shell Capital Management, LLC, and the portfolio manager of ASYMMETRY® Global Tactical. Mike Shell and Shell Capital Management, LLC is a registered investment advisor in Florida, Tennessee, and Texas focused on asymmetric risk-reward and absolute return strategies and provides investment advice and portfolio management only to clients with a signed and executed investment management agreement. The observations shared on this website are for general information only and should not be construed as advice to buy or sell any security. Securities reflected are not intended to represent any client holdings or any recommendations made by the firm. I observe the charts and graphs to visually see what is going on with price trends and volatility, it is not intended to be used in making any determination as to when to buy or sell any security, or which security to buy or sell. Instead, these are observations of the data as a visual representation of what is going on with the trend and its volatility for situational awareness. I do not necessarily make any buy or sell decisions based on it. Any opinions expressed may change as subsequent conditions change. Do not make any investment decisions based on such information as it is subject to change. Investing involves risk, including the potential loss of principal an investor must be willing to bear. Past performance is no guarantee of future results. All information and data are deemed reliable but is not guaranteed and should be independently verified. The presence of this website on the Internet shall in no direct or indirect way raise an implication that Shell Capital Management, LLC is offering to sell or soliciting to sell advisory services to residents of any state in which the firm is not registered as an investment advisor. The views and opinions expressed in ASYMMETRY® Observations are those of the authors and do not necessarily reflect a position of Shell Capital Management, LLC. The use of this website is subject to its terms and conditions.
A volatility expansion implies that stock prices are expected to spread out more, as measured by the (VIX) CBOE Volatility Index. Currently, it’s at 28, which would imply a 28% expected volatility over the next 30 days, except it tends to be priced at a premium above realized vol.

Then, historical volatility, or realized actual volatility, such as the 30-day rolling volatility, suggests prices are indeed spreading out. So, expect a wider range up AND down in volatility expansions. In the chart below, 30 Day Rolling Volatility = Standard Deviation of the last 30 percentage changes in Total Return Price * Square-root of 252. At this point, it’s at 17.71% when applied to the S&P 500 stock index data.

Here they are together, expected volatility on top of realized volatility.

A volatility expansion like this suggests in the near term stock prices are expected to spread out more, but up and down.
We are seeing a broad range of prices today, form up 1.4% to down -0.60%, as seen below.

So, if you are invested in the stock market, prepare yourself accordingly. Need help? Contact us here.
Mike Shell is the Founder and Chief Investment Officer of Shell Capital Management, LLC, and the portfolio manager of ASYMMETRY® Global Tactical. Mike Shell and Shell Capital Management, LLC is a registered investment advisor in Florida, Tennessee, and Texas focused on asymmetric risk-reward and absolute return strategies and provides investment advice and portfolio management only to clients with a signed and executed investment management agreement. The observations shared on this website are for general information only and should not be construed as advice to buy or sell any security. Securities reflected are not intended to represent any client holdings or any recommendations made by the firm. I observe the charts and graphs to visually see what is going on with price trends and volatility, it is not intended to be used in making any determination as to when to buy or sell any security, or which security to buy or sell. Instead, these are observations of the data as a visual representation of what is going on with the trend and its volatility for situational awareness. I do not necessarily make any buy or sell decisions based on it. Any opinions expressed may change as subsequent conditions change. Do not make any investment decisions based on such information as it is subject to change. Investing involves risk, including the potential loss of principal an investor must be willing to bear. Past performance is no guarantee of future results. All information and data are deemed reliable but is not guaranteed and should be independently verified. The presence of this website on the Internet shall in no direct or indirect way raise an implication that Shell Capital Management, LLC is offering to sell or soliciting to sell advisory services to residents of any state in which the firm is not registered as an investment advisor. The views and opinions expressed in ASYMMETRY® Observations are those of the authors and do not necessarily reflect a position of Shell Capital Management, LLC. The use of this website is subject to its terms and conditions.
We used to say the long term average for the Cboe Volatility Index VIX is 20.
Some would mistakenly say that VIX “reverts to the mean”, suggesting it is drawn to the average level of 20, which isn’t exactly the condition. It doesn’t cycle up and down to trend around 20 most of the time, but instead, it spends much of the time between 10 and 30.
Prior to 2015, the long term average of VIX since its inception was 20 and we heard the number 20 referenced with VIX often. 
Since January 2015, we’ve seen the long term average decline to the 19 levels. 
So, 19 is the new 20.
What caused the downtrend in the long term average?
Obviously, it would take a very low level of readings to drive down the long term average of a volatility index introduced in 1993.
What happened in the past 5 years that impacted the prior 21 years of data so much to bring the 26-year average down?
A 5 year period of low implied volatility happened with an average of 15% and a low of 9.14%. Said another way; the past 5 years expected volatility priced into S&P 500 stock options has been about 25% lower than the prior two decades, or 75% of what we previously observed. Here is the trend for VIX from 2015 to today. A VIX level of 15 translates to implied volatility of 15% on the S&P 500.

Is this a new low volatility regime?
Anything is possible, but I’m guessing the lower level of implied (expected) volatility may be driven by two facts that can both result in less concern for volatility.
The aged bull market and economic expansion can naturally lead to some level of complacency and expectation for less downside and tighter price trends. When investors are uncertain, their indecision shows up in a wide range of prices. When investors are smugger and confident, they are less indecisive and it’s usually after a smooth uptrend they expect to continue.
Is it another regime of irrational exuberance?
“Irrational exuberance” was the expression used by the former Federal Reserve Board chairman, Alan Greenspan, in a speech given during the dot-com bubble of the 1990s. The expression was interpreted as a warning that the stock market may have been overvalued. It was.
Irrational exuberance suggests investor enthusiasm drives asset prices up to levels that aren’t supported by fundamental financial conditions. The 90s ended with a Shiller PE Ratio over 40, far more than any other time in more than a century.
Is the stock market at a level of irrational exuberance?
Maybe so, as this is the second-highest valuation in the past 150 years according to the Shiller PE.

But, the driver here is inflation. When inflation rates are really low, we can justify a higher price to earnings ratio for stocks, so they say.
A new VIX average level of 19 translates to the implied volatility of 19% on the S&P 500 instead of the former after of 20%. It isn’t a huge range difference.
Looking over the full 26 years of implied volaltity, the more elevated levels in the past included the late 90s into around 2003, which elevated the average. Since then, we’ve seen more spikes up but not as many volatility expansions that stay high for longer periods. 
A behavior of implied volatility I’ve observed over time is it spikes up very fast when the stock market drops and then trends back down more gradually as stocks trend back up. For this reason, derivatives of volatility provide us an opportunity for asymmetric hedging.
I doubt this is a new lower long term volatility regime. My guess is we’ll see a very significant volatility expansion again at some point during the next bear market and economic recession. Historically we’ve observed trends that stretch far and wide swing back the other way, far and wide.
At a minimum, it’s no time for complacency.
Mike Shell is the Founder and Chief Investment Officer of Shell Capital Management, LLC, and the portfolio manager of ASYMMETRY® Global Tactical. Mike Shell and Shell Capital Management, LLC is a registered investment advisor in Florida, Tennessee, and Texas focused on asymmetric risk-reward and absolute return strategies and provides investment advice and portfolio management only to clients with a signed and executed investment management agreement. The observations shared on this website are for general information only and should not be construed as advice to buy or sell any security. Securities reflected are not intended to represent any client holdings or any recommendations made by the firm. Any opinions expressed may change as subsequent conditions change. Do not make any investment decisions based on such information as it is subject to change. Investing involves risk, including the potential loss of principal an investor must be willing to bear. Past performance is no guarantee of future results. All information and data are deemed reliable but is not guaranteed and should be independently verified. The presence of this website on the Internet shall in no direct or indirect way raise an implication that Shell Capital Management, LLC is offering to sell or soliciting to sell advisory services to residents of any state in which the firm is not registered as an investment advisor. The views and opinions expressed in ASYMMETRY® Observations are those of the authors and do not necessarily reflect a position of Shell Capital Management, LLC. The use of this website is subject to its terms and conditions.
The Cboe Volatility Index VIX is back to its average of 15 over the past year, which implies volatility of 15% for the S%P 500 for the next 30 days based on options prices. 
Indexes like the VIX may have no predictive ability as to market direction at this level, but options don’t lie. The options market is a two-sided market and two-sided markets provide some insight. Options can have predictive power at extremes, but in most cases, the speed is to the downside.
The Cboe VVIXSM Index is the volatility of VIX. The VVIX Index is an indicator of the expected volatility of the 30-day forward price of the VIX. This volatility drives nearby VIX option prices. Like the VIX, it’s also at its average level of the past year. 
My next observation is the Cboe 3-Month Volatility Index (VIX3M). Once again, at its average. 
Next is the VIX Futures Term Structure. VIX futures reflect the market’s estimate of the value of the VIX Index on various expiration dates in the future. Monthly and weekly expirations are available and trade nearly 24 hours a day, five days a week. VIX futures provide market participants with a variety of opportunities to implement their view using volatility trading strategies, including risk management, alpha generation and portfolio diversification. All of these volatility trading strategies are reflected in the futures prices and the term structure shows it.

The upward-sloping VIX futures term structure is called contango and the current contango between the front month and next is 2.5%, which is small.
The upward-sloping VIX futures term structure as we see now suggests that short-term volatility is relatively low compared to its long-term level and investors/traders expect an increase in volatility in the future.
So, as the stock market is trying to regain its prior highs, volatile is trying to settle down for now. We’ll see if it can hold.
Mike Shell is the Founder and Chief Investment Officer of Shell Capital Management, LLC, and the portfolio manager of ASYMMETRY® Global Tactical. Mike Shell and Shell Capital Management, LLC is a registered investment advisor in Florida, Tennessee, and Texas focused on asymmetric risk-reward and absolute return strategies and provides investment advice and portfolio management only to clients with a signed and executed investment management agreement. The observations shared on this website are for general information only and should not be construed as advice to buy or sell any security. Securities reflected are not intended to represent any client holdings or any recommendations made by the firm. Any opinions expressed may change as subsequent conditions change. Do not make any investment decisions based on such information as it is subject to change. Investing involves risk, including the potential loss of principal an investor must be willing to bear. Past performance is no guarantee of future results. All information and data are deemed reliable but is not guaranteed and should be independently verified. The presence of this website on the Internet shall in no direct or indirect way raise an implication that Shell Capital Management, LLC is offering to sell or soliciting to sell advisory services to residents of any state in which the firm is not registered as an investment advisor. The views and opinions expressed in ASYMMETRY® Observations are those of the authors and do not necessarily reflect a position of Shell Capital Management, LLC. The use of this website is subject to its terms and conditions.
The Dow Jones Industrial Average is down 460 points and headlines mostly blame the coronavirus outbreak in China as it spreads around the world.
A few headlines this morning:
Stocks Tumble Around the World on Virus Jitters
China Deaths Jump as Measures Fail to Slow Spread of Virus
What’s Being Done to Limit the Spread of the China Virus
Millions Left Worried, Angry and Isolated After Wuhan Lockdown
Stocks Drop on Coronavirus Fears
The Dow industrials fell about 400 points as detection of coronavirus in new patients in the U.S., Australia and France led to escalating concerns about the containment and potential economic impact.
People love a good story, so the narrative gets the blame for falling prices.
As I shared in What’s the stock market going to do next? and Periods of low volatility are often followed by volatility expansions, it’s really just the market, doing what it does.
The stock market is declining simply because it was priced for perfection. You can see in the chart below, as the price trend of the S&P 500 stock index trended up the past several months, its volatility, or the range of prices, was tight.
Who doesn’t love a quiet uptrend?
It was a nice quiet uptrend, suggesting investors were complacently enjoying the ride. I was to until it reached an extreme, then I hedged off some risk, then reduced the possibility of loss completely by taking profits and shifting to short term U.S. Treasuries.
This time, I was just a little early with my hedging, but that was ok. The higher stocks trended up and more volaltity contracted, the more likely the trend would reverse down and volatility expands.
That’s what we’re seeing now.

While an SPX at 3200 is a ‘normal’ range for the market to move, I wouldn’t be surprised to see the price trend decline to the blue line I marked on the chart.
Of course, as I said in Now, THIS is what a stock market top looks like!, it could be an even larger peak, too.
Anything is possible, which is why we necessarily need to actively direct and control the possibility of loss for asymmetric risk-reward.
I don’t believe this price decline is driven by the coronavirus outbreak in China as it spreads around the world. I think it’s just the market, doing what it does, as I’ve shared the past several weeks. Some catalyst gets the blame for it.
Mike Shell is the Founder and Chief Investment Officer of Shell Capital Management, LLC, and the portfolio manager of ASYMMETRY® Global Tactical. Mike Shell and Shell Capital Management, LLC is a registered investment advisor in Florida, Tennessee, and Texas focused on asymmetric risk-reward and absolute return strategies and provides investment advice and portfolio management only to clients with a signed and executed investment management agreement. The observations shared on this website are for general information only and should not be construed as advice to buy or sell any security. Securities reflected are not intended to represent any client holdings or any recommendations made by the firm. Any opinions expressed may change as subsequent conditions change. Do not make any investment decisions based on such information as it is subject to change. Investing involves risk, including the potential loss of principal an investor must be willing to bear. Past performance is no guarantee of future results. All information and data are deemed reliable but is not guaranteed and should be independently verified. The presence of this website on the Internet shall in no direct or indirect way raise an implication that Shell Capital Management, LLC is offering to sell or soliciting to sell advisory services to residents of any state in which the firm is not registered as an investment advisor. The views and opinions expressed in ASYMMETRY® Observations are those of the authors and do not necessarily reflect a position of Shell Capital Management, LLC. The use of this website is subject to its terms and conditions.
Volatility measures the frequency and magnitude of changes, both up and down, that we experience over a certain period of time.
When we speak of volatility in the financial markets, we necessarily mean the magnitude of price movements, both up and down, over time.
So, volatility is how quickly and how far a price trend spreads out.
The more dramatic the price swings, the higher the level of volatility.
Volatility can be measured using actual historical price changes (realized volatility) or it can be a measure of expected future volatility that is implied by option prices.
The VIX Index is a measure of expected future volatility.
The VIX index is a calculation designed to produce a measure of constant, 30-day expected volatility of the U.S. stock market, derived from real-time, mid-quote prices of S&P 500® Index (SPX) call and put options.
When the VIX is low, a lower level of volaltity is implied, or priced in, to the options. When the VIX is high, expected volaltity is high.
Recently, the implied volatility index VIX has been very low at times. As seen below, I added the low of the past year to the chart, which was 11.54, which is lower than today.

But, the long term average VIX level is 19 and the lowest level the VIX has reached since its inception was 9.14 reached late 2018.

To put the 9.14 level into perspective, here is the past three years and how low the VIX was in 2018 as complacency set in.

Can stocks keep trending up and implied volatility drift lower?
Absolutely.
But, what happened after it did?
Mike Shell is the Founder and Chief Investment Officer of Shell Capital Management, LLC, and the portfolio manager of ASYMMETRY® Global Tactical. Mike Shell and Shell Capital Management, LLC is a registered investment advisor in Florida, Tennessee, and Texas focused on asymmetric risk-reward and absolute return strategies and provides investment advice and portfolio management only to clients with a signed and executed investment management agreement. The observations shared on this website are for general information only and should not be construed as advice to buy or sell any security. Securities reflected are not intended to represent any client holdings or any recommendations made by the firm. Any opinions expressed may change as subsequent conditions change. Do not make any investment decisions based on such information as it is subject to change. Investing involves risk, including the potential loss of principal an investor must be willing to bear. Past performance is no guarantee of future results. All information and data are deemed reliable but is not guaranteed and should be independently verified. The presence of this website on the Internet shall in no direct or indirect way raise an implication that Shell Capital Management, LLC is offering to sell or soliciting to sell advisory services to residents of any state in which the firm is not registered as an investment advisor. The views and opinions expressed in ASYMMETRY® Observations are those of the authors and do not necessarily reflect a position of Shell Capital Management, LLC. The use of this website is subject to its terms and conditions.
To no surprise, the CBOE S&P 500 Volatility Index that represents the market’s expectation of 30-day forward-looking volatility, is trending up.

So far, it isn’t much of a volatility expansion, but it’s elevated somewhat higher than it was. At around 15, the VIX is also well below its long term average of 18.23, although it hasn’t historically been drawn to the 18-20 level, anyway. The average is skewed by the spikes in volatility; volatility expansion.
VIX is at a current level of 14.82, an increase of 0.80 or 5.71%% from the previous market day.
Here are the 50 and 200-day moving average values for VIX.

As I shared over the weekend, and it was quoted in today’s MarketWatch article “U.S.-Iran tensions will spark increased volatility — here’s how to play stocks, fund manager says“:
“So, on a short-term basis, the stock indexes have had a nice uptrend since October, with low volatility, so we shouldn’t be surprised to see it reverse to a short-term downtrend and a volatility expansion.
“For those who were looking for a ‘catalyst’ to drive a volatility expansion, now they have it.”
I was referring to the U.S. conflict with Iran, of course.
The VIX index value is derived from the price inputs of the S&P 500 index options, it provides an indication of market risk and investors’ sentiments. VIX measures the implied ‘expected’ volatility of the US stock market. So, many market strategists use the VIX as a gauge for how fearful, uncertain, or how complacent the markets are. The VIX index tends to rise when the market drops and vice versa. During the 2008-2009 bear market, the VIX trended up as high as 80.86. Although the VIX cannot be invested in directly, securities like ETFs and derivatives based on it may provide the potential for an asymmetric hedge. For example, over the past year when the S&P 500 stock index was down -1% or more on the day, some of the ETFs based on long volatility spiked 10% or more. Volatility is difficult to time right, but when we do the payoff can be asymmetric. An asymmetric payoff is achieved when the risk-reward is asymmetric: maybe we risk 1% to achieve a payoff of 5%. Since long volatility has the potential for big spikes when volatility expands, it’s asymmetric payoff doesn’t require the tactical trader and risk manager to be as ‘right’ and accurate. So, the probability of winning can be lower, but the net pay off over time is an asymmetric risk-reward.
You can probably see why I pay attention to volatility and volatility expansions.
Mike Shell is the Founder and Chief Investment Officer of Shell Capital Management, LLC, and the portfolio manager of ASYMMETRY® Global Tactical.Mike Shell and Shell Capital Management, LLC is a registered investment advisor focused on asymmetric risk-reward and absolute return strategies and provides investment advice and portfolio management only to clients with a signed and executed investment management agreement. The observations shared on this website are for general information only and should not be construed as advice to buy or sell any security. Securities reflected are not intended to represent any client holdings or any recommendations made by the firm. Any opinions expressed may change as subsequent conditions change. Do not make any investment decisions based on such information as it is subject to change. Investing involves risk, including the potential loss of principal an investor must be willing to bear. Past performance is no guarantee of future results. All information and data are deemed reliable but is not guaranteed and should be independently verified. The presence of this website on the Internet shall in no direct or indirect way raise an implication that Shell Capital Management, LLC is offering to sell or soliciting to sell advisory services to residents of any state in which the firm is not registered as an investment advisor. The views and opinions expressed in ASYMMETRY® Observations are those of the authors and do not necessarily reflect a position of Shell Capital Management, LLC. The use of this website is subject to its terms and conditions.
“Those who forget the past are doomed to repeat it”
One of the advantages of writing observations in real-time is the ability to go back and read them with perfect hindsight.
We know that global asset allocations of varying mixes of stocks and bonds have had a strong year in 2019.

Most of the gains were achieved in the first four months. Here are the return streams through May 1, 2019, for different targeted allocations.

Since May 1st, global asset allocation portfolios experienced much more volatility and less capital gain.

How did such a great year for stocks and bonds begin?
At the end of a year like this, I like to reflect on this time a year ago, especially since the market state is so radically different between now and then.
If we want to learn from the past and our experiences, it’s essential to revisit things from time to time.
A year ago, we celebrated Christmas with a stunning waterfall decline in stocks.
Today, we’ve enjoyed an equally stunning guiser in gains.
So, what has changed?
To gain an understanding, here is what I’m reading into the new year.
December 17, 2019:
What’s going to happen next for the stock market?
December 20, 2019:
The stock market has reached a short-term extreme as investor sentiment indicates fear
December 23, 2019:
An exhaustive analysis of the U.S. stock market
December 24, 2019:
An exhaustive stock market analysis… continued
January 1, 2019:
Investor Sentiment into the New Year 2019
If you read all of them, you’ll be surprised how much you learn about market trends, behavior, volatility, and internals.
MERRY CHRISTMAS!
Mike Shell is the Founder and Chief Investment Officer of Shell Capital Management, LLC, and the portfolio manager of ASYMMETRY® Global Tactical.
Mike Shell and Shell Capital Management, LLC is a registered investment advisor focused on asymmetric risk-reward and absolute return strategies and provides investment advice and portfolio management only to clients with a signed and executed investment management agreement. The observations shared on this website are for general information only and should not be construed as advice to buy or sell any security. Securities reflected are not intended to represent any client holdings or any recommendations made by the firm. Any opinions expressed may change as subsequent conditions change. Do not make any investment decisions based on such information as it is subject to change. Investing involves risk, including the potential loss of principal an investor must be willing to bear. Past performance is no guarantee of future results. All information and data are deemed reliable but is not guaranteed and should be independently verified. The presence of this website on the Internet shall in no direct or indirect way raise an implication that Shell Capital Management, LLC is offering to sell or soliciting to sell advisory services to residents of any state in which the firm is not registered as an investment advisor. The views and opinions expressed in ASYMMETRY® Observations are those of the authors and do not necessarily reflect a position of Shell Capital Management, LLC. The use of this website is subject to its terms and conditions.
When Donald Trump was elected the President of the United States the headlines read like this one from MarketWatch:
Dow futures plunge 750 points as Trump takes key battleground states
Stock markets are not handling Election Night well.
Futures for the Dow Jones Industrial Average plunged as Republican presidential nominee Donald Trump’s lead widened in the presidential race against Democratic rival Hillary Clinton.
And CNN:
Wall Street welcomes Trump with a bang – Business – CNN.com
Nov 9, 2016 – An overnight panic in global markets evaporated as Wall Street gave an … Trump’s election would bring about a plunge in the stock market. … “The selloff last night was an hysterical reaction,”
Since then I’ve heard a lot of hedge fund type investment managers who operate investment strategies that include risk management, hedging, or trend following complain about the hostile conditions. Some of them blame it on algorithms, but it seems most of them blame it on Trump’s tweets. One trader recently said:
“Trump completely screwed me over these past two years by rocking the markets with constant vol spikes. Had we had a reasonable president, I probably would have made a lot more money.”
To that, I replied:
“Well, ya know, “everyone gets what they want from the market” and personal responsibly (respond-ability) is the foundation of good results. SPX has gained 58% with declining vol since the last election.”

Sure enough, after the “plunge” headlines that probably shocked a lot of individual investors out of the stock market who weren’t already out, the S&P 500 went on to deliver an even more surprising total return since then. I also pointed out volatility as measured by standard deviations has somewhat declined since then.
Who knew?
No one!
Who believed the stock index would gain so much over a period of geopolitical instability and vol spikes?
I don’t know anyone. Well, except those who buy and hold. Periods like this are favorable to those who buy and hold. That is if they can hold through the drawdowns, volatility, and news headlines, which ain’t easy. Don’t forget, that would be the same investors who held through a -56% loss in the S&P 500 that took many years to recover from. Most people can’t do it, because when they’re down -50% they don’t know if the losses are over or will get even worse.
It only takes once.
So, the essential element is knowing your risk tolerance.
Standard deviation, a measure of historical volatility has declined, but that trend doesn’t reflect what real people deal with; drawdowns in their account values. Below are drawdowns in the stock index since the 2016 election. The first year as abnormally quiet, and then we’ve observed two very sharp waterfall declines.

My trader friend goes on to say:
“Yeah 2017 was phenomenal. This year, however, was absolute misery if you weren’t a buy-and-holder. Basically, any sort of “market goes up, quickly shocks down, then continues right back up again” just makes any sort of momentum/trend-follower system look like an idiot.”
To that I replied:
“It didn’t seem too bad to me. The S&P Trend Allocator index tracks the performance of a systematic trend strategy allocating between the S&P 500 and cash, based on price trends. If the SPX is observed to be in a positive trend, its allocated to the SPX therwise, it is allocated to cash.”

As seen in the chart, the S&P 500 recovered from the -20% loss at the end of last year and made an even higher gain. The blue line is the S&P Trend Allocation index, a trend following model applied to the S&P 500 stock index that exits when the index falls. This index cannot be invested in directly, but it shows us the results of the model. You can see it was in cash in January because of the big decline in late 2018. It finally got back in synch with the S&P 500 around March, but it “missed out” on the sharp recover over those first three months. This is the cost of active risk management with a trend following system. If you want to avoid big losses, this is the price you pay.
In the chart, I also included the S&P Target Risk Moderate Index, which is a global asset allocation of 60% stocks and 40% bonds. It was smoother in 2019, but the bonds, too, offset gains. So, for those who say “I’ll put most of my money in stocks, but not all of it” that’s about what it would have looked like. However, indexes don’t include fees and expenses.
Next, I expand the time frame back to about three years to the inception of the S&P Trend Allocator index to see it’s risk-reward. Yes, it achieved less total return and its trend following strategy exits a little late, resulting in missing some of the price trend recoveries, but in a major decline it would potentially pay off.

Here is a comparison of the downside drawdowns where we can see the red line trend model missed half of the drawdown late 2018. For that peace of mind, it didn’t capture all of the 2019 recovery.

The S&P Trend Allocator index is a very simple trend-following model. Though I have similar systems, this isn’t what I do. My systems include many more parts, different parameters, and apply trend following and countertrend in an unconstrained way to a global opportunity set of markets. To me, the issue with the S&P Trend Allocator index is its symmetrical trading system; it enters and exits with the same method. Mine are an asymmetrical trading system: entering the trend one way, exiting another. I believe trends waterfall down faster than they drift up, so my strategy is more focused on those beliefs.
We’ve had a great year in 2019 in regard to risk-adjusted returns because I’ve been more focused on countertrend moves along with some trend following. I believe everyone gets what they want from the market. Most investors can’t tolerate large losses of 100% stocks all the time, so they need active risk management. If we miss those big down moves, we don’t have the asymmetry of losses working against us as we compound capital over the long-term.
If you make investment decisions based on elections and politics, you’re probably going to be surprised over and over.
If your investment strategy doesn’t account for volatility, no matter what causes it, you may be doing the wrong thing at the wrong time.
Mike Shell is the Founder and Chief Investment Officer of Shell Capital Management, LLC, and the portfolio manager of ASYMMETRY® Global Tactical.
Mike Shell and Shell Capital Management, LLC is a registered investment advisor focused on asymmetric risk-reward and absolute return strategies and provides investment advice and portfolio management only to clients with a signed and executed investment management agreement. The observations shared on this website are for general information only and should not be construed as advice to buy or sell any security. Securities reflected are not intended to represent any client holdings or any recommendations made by the firm. Any opinions expressed may change as subsequent conditions change. Do not make any investment decisions based on such information as it is subject to change. Investing involves risk, including the potential loss of principal an investor must be willing to bear. Past performance is no guarantee of future results. All information and data are deemed reliable but is not guaranteed and should be independently verified. The presence of this website on the Internet shall in no direct or indirect way raise an implication that Shell Capital Management, LLC is offering to sell or soliciting to sell advisory services to residents of any state in which the firm is not registered as an investment advisor. The views and opinions expressed in ASYMMETRY® Observations are those of the authors and do not necessarily reflect a position of Shell Capital Management, LLC. The use of this website is subject to its terms and conditions.
Using the S&P 500 stock index as a proxy for the stock market, today we saw a modest uptick. It’s now back within a normal range. Realized volatility as measured by the average true range of the past 14 days has trended up. Volatility isn’t directional, so a volatility expansion involves but down and up days.

Implied volatility of the S&P 500 stocks had a sharp move up and settled back down some today. Applying the same realized volatility measures to the VIX is a view of the realized vol of implied vol. Yesterday may turn out to have been a good time to exit long volatility positions, or maybe it explodes from here.

The VIX futures term structure closed 10% contango. The December VIX futures are 10% lower priced than January. The curve is flatter beyond February.

This contango creates a headwind for VIX ETFs that roll each day as they sell the January futures at a lower price and buy the February at a 10% higher price. It’s why the VIX exchange-traded funds and notes trend dow long term. So, they aren’t suitable for anyone to hold for long.
VIX may stay within the range and the stock market trend back up.
We’ll see.
Mike Shell is the Founder and Chief Investment Officer of Shell Capital Management, LLC, and the portfolio manager of ASYMMETRY® Global Tactical.
Mike Shell and Shell Capital Management, LLC is a registered investment advisor focused on asymmetric risk-reward and absolute return strategies and provides investment advice and portfolio management only to clients with a signed and executed investment management agreement. The observations shared on this website are for general information only and should not be construed as advice to buy or sell any security. Securities reflected are not intended to represent any client holdings or any recommendations made by the firm. Any opinions expressed may change as subsequent conditions change. Do not make any investment decisions based on such information as it is subject to change. Investing involves risk, including the potential loss of principal an investor must be willing to bear. Past performance is no guarantee of future results. All information and data are deemed reliable but is not guaranteed and should be independently verified. The presence of this website on the Internet shall in no direct or indirect way raise an implication that Shell Capital Management, LLC is offering to sell or soliciting to sell advisory services to residents of any state in which the firm is not registered as an investment advisor. The use of this website is subject to its terms and conditions.
On November 16th, about two weeks ago, I shared an observation in “Periods of low volatility are often followed by volatility expansions” that implied and realized volatility had reached such a low level we should expect to see a volatility expansion.
I also pointed out investor sentiment had been reaching excessive optimism. The type of excessive optimism we normally see when less-skilled investors have an urge to buy stocks instead of a hedge or sell them to reduce risk.
It was plenty early, as expected, which is better than being late.
When I share these observations, the intent is to highlight an extreme trend or cycle I expect to shift the other direction. In this case, I saw the range of prices was getting tight, suggesting to me there was little indecision in the market, which also implies confidence and complacency. I say this, having been monitoring these market dynamics daily and professionally for over two decades.
The chart I included showing the S&P 500 price trend peaking at the upper band of its range and its average true range at what I consider an extreme low go included in MarketWatch, then Barron’s, and then today The Daily Shot in the Wall Street Journal.

Since that chart is now two weeks old, here’s an update. The S&P 500 has trended down about -1.2% the past two sessions and its price is back inside the volatility bands. However, notice the bands have contracted since October, so I say again: Periods of low volatility are usually followed by volatility expansions.

So, stay tuned, a volatility expansion with at least a minor price correction seems imminent.
Prepare yourself accordingly.
Mike Shell is the Founder and Chief Investment Officer of Shell Capital Management, LLC, and the portfolio manager of ASYMMETRY® Global Tactical.
Mike Shell and Shell Capital Management, LLC is a registered investment advisor in Florida, Tennessee, and Texas focused on asymmetric risk-reward and absolute return strategies and provides investment advice and portfolio management only to clients with a signed and executed investment management agreement. The observations shared on this website are for general information only and should not be construed as advice to buy or sell any security. Securities reflected are not intended to represent any client holdings or any recommendations made by the firm. Any opinions expressed may change as subsequent conditions change. Do not make any investment decisions based on such information as it is subject to change. Investing involves risk, including the potential loss of principal an investor must be willing to bear. Past performance is no guarantee of future results. All information and data are deemed reliable but is not guaranteed and should be independently verified. The presence of this website on the Internet shall in no direct or indirect way raise an implication that Shell Capital Management, LLC is offering to sell or soliciting to sell advisory services to residents of any state in which the firm is not registered as an investment advisor. The use of this website is subject to its terms and conditions.
The Fear & Greed Index reaches the Extreme Greed level as I got a short term countertrend sell or hedge signal for U.S. stocks.
Investors are driven by two emotions: fear and greed.
Too much fear can drive stocks well below where they should be, an overreaction to the downside.
When investors get greedy, their enthusiasm to buy may drive stock prices up too far, an overreaction to the upside.
The Fear & Greed Index is a simple gauge that attempts to signal which emotion is driving the stock market. It’s made up of seven indicators, and though it doesn’t generate a perfect timing signal, it’s useful for investors to compare to their own sentiment.

As I pointed out last week, expected volatility has also declined to a low level. The VIX is now in the 12 range.

Here is a chart of the Fear & Greed index over time. As we highlighted, it’s at its historical peak.

Investors tend to want to do the wrong thing at the wrong time, so measuring extremes in overall investor sentiment is a useful way to modify investor behavior.
I operate with a massive intention of feeling the right feelings at the right time. Some claim to use systems to overcome their feelings or remove feelings altogether, but as a tactical decision-maker, I know it isn’t actually possible. I prefer to experence my emotions and let them be but have shifted my mindset to feel the right feeling at the right time.
Based on my systems and indicators, suggesting sentiment and price trends have reached a point of extreme, I feel more defense right now. My quantitative methods drive my feelings. I see the signal, get a good sense about it, then pull the trigger.
As sentiment is reaching the extreme greed level, as see the S&P 500 index below is at all-time new highs.

When I see such enthusiasm, it’s initially good for momentum, but it eventually fades and so does the price trend.
But, it doesn’t matter if we monitor quantitative measures without them driving our decisions. When I see points like this, it’s just a reminder to review my portfolio to see if I’m comfortable with the risk/reward exposures. If I see asymmetric risk/reward, I do nothing. If I have too much risk exposure, I reduce it or hedge it off.
We shouldn’t be surprised to see a decline of 2-5% from here or at least a pause, but anything is possible.
Being prepared in advance is a useful way to avoid bad investor behavior, which is why I predefined my exposure to the possibility of loss by knowing in advance when I’ll exit or reduce the exposure.
Mike Shell is the Founder and Chief Investment Officer of Shell Capital Management, LLC, and the portfolio manager of ASYMMETRY® Global Tactical.
Mike Shell and Shell Capital Management, LLC is a registered investment advisor focused on asymmetric risk-reward and absolute return strategies and provides investment advice and portfolio management only to clients with a signed and executed investment management agreement. The observations shared on this website are for general information only and should not be construed as advice to buy or sell any security. Securities reflected are not intended to represent any client holdings or any recommendations made by the firm. Any opinions expressed may change as subsequent conditions change. Do not make any investment decisions based on such information as it is subject to change. Investing involves risk, including the potential loss of principal an investor must be willing to bear. Past performance is no guarantee of future results. All information and data are deemed reliable but is not guaranteed and should be independently verified. The presence of this website on the Internet shall in no direct or indirect way raise an implication that Shell Capital Management, LLC is offering to sell or soliciting to sell advisory services to residents of any state in which the firm is not registered as an investment advisor. The use of this website is subject to its terms and conditions.
The U.S. stock market indices are finally reaching new highs, but momentum indicators show them getting overbought at the same time. Nevertheless, the trend is up and volatility is declining as the trend of the S&P 500, for example, has tightened up with the range of prices not as spread out as it was.

Speaking of volatility, the next chart is an observation of the stock index price trend with the 30 Day Rolling Volatility to see how it interacts. The formula for the 30 Day Rolling Volatility is Standard Deviation of the last 30 percentage changes in Total Return Price x Square-root of 252. YCharts multiplies the standard deviation by the square root of 252 to return an annualized measure. 252 is the number of trading days in a year.
I consider it an observation of realized volatility since it’s a measure of the last 30 percentage changes of price. Here we observe the 30 Day Rolling Volatility has declined recently, though it still isn’t as low as it was a few months ago.

Realized historical volatility is in a contraction, so after it declines we shouldn’t be surprised to see volatility expand again since volaltity is mean-reverting.
It’s an observation that volatility was dynamic, not static, so it’s constantly trending and cycling up and down. Volatility contractions are often followed by volaltity expansions as investors oscillate between the fear of missing out and the fear of losing money.
The CBOE S&P 500 Volatility Index (VIX) on the other hand, is a measure of implied volatility based on options prices of the stocks in the S&P 500. The VIX measures expected volatility. As we see below, the VIX is close to its low around 12 it reached twice this year.

Once again, an indication that we could see a volatility contraction anytime from this starting point. Or, the uptrend in stocks and downtrend in their volatility could continue.
We could look a lot deeper into more measures, such as the VVIX Index, which is an indicator of the expected volatility of the 30-day forward price of the VIX. This volatility drives nearby VIX option prices. CBOE also calculates a term structure of VVIX for different VIX expirations. It’s the vol of implied vol.

At this point, the trend for U.S. stocks is up, and the volaltity is quiet.
At the same time, U.S. stock short term momentum is reaching overbought, long term U.S. treasury bonds are oversold. An example observation is the ICE US Treasury 20+ Year Index. Overall, these bonds are in an uptrend over the past year but have corrected recently. I wouldn’t be surprised to see the long term treasuries find some buying demand here and resume the uptrend. If they don’t, there are prior levels of support for a predefined exit to cut a loss if it doesn’t work out.

Within the U.S. high yielding dividend stocks have shown relative strength and good momentum this year. The trend is seen in the index below.

As seen in the trend of the S&P Global Dividend Opportunities Index, the same is true for global high dividend stocks.

Looking beyond stocks and bonds, the trend of gold has finally turned up after being flat for over five years.

Gold over the past 10 years shows a strong trend post-2010, a downtrend, then a generally non-trending period for years until recently.

You can probably see why a robust trend following system and risk management is useful for markets including gold. If the 10-year chart didn’t make the point, this chart going back to the 1970s probably will.

There is a time for everything under the sun.
There is a time for offense and time for a defense.
The recent trend in gold is more clear over the one-year time frame.

That’s all for now.
Mike Shell is the Founder and Chief Investment Officer of Shell Capital Management, LLC, and the portfolio manager of ASYMMETRY® Global Tactical.
Mike Shell and Shell Capital Management, LLC is a registered investment advisor focused on asymmetric risk-reward and absolute return strategies and provides investment advice and portfolio management only to clients with a signed and executed investment management agreement. The observations shared on this website are for general information only and should not be construed as advice to buy or sell any security. Securities reflected are not intended to represent any client holdings or any recommendations made by the firm. Any opinions expressed may change as subsequent conditions change. Do not make any investment decisions based on such information as it is subject to change. Investing involves risk, including the potential loss of principal an investor must be willing to bear. Past performance is no guarantee of future results. All information and data is deemed reliable, but is not guaranteed and should be independently verified. The presence of this website on the Internet shall in no direct or indirect way raise an implication that Shell Capital Management, LLC is offering to sell or soliciting to sell advisory services to residents of any state in which the firm is not registered as an investment advisor. Use of this website is subject to its terms and conditions.
As I’ve been pointing out all month in August, the stock market is in a period of indecision, that it will eventually break out of.
Looking at the price trend of the S&P 500 index over the past six months, todays 1.4% move so far has the trend tapping the upper end of the range.

Zooming in to the beginning of the month of August, it’s been a month of indecision. Those who want to buy are battling with those who want to sell.

The range of the price trend has spread out, as was implied by the CBOE S&P 500 Volatility Index VIX. It’s been a relatively volatile month with this big-cap stock index swinging up and down in a range of 4%. As we can see in the chart below, the VIX trended up sharply as stocks declined in price.

What we also see, however, is implied is settling back down as the price trend is swinging up and down in this 4% range of indecision.
What’s going to happen next?
I don’t need to know what’s going to happen next. I know exactly what I’ll do next with my positions if they continue trending up, or reverse back down.
Using this stock index as an example, if it breaks below this range it’s bearish, but if it has the buying demand to break above it, the uptrend resumes.
That’s why we call price action as we’ve seen this month a base patter and we’ll eventually see a big move out of it one direction or the other.
The S&P 500 index is an unmanaged index and cannot be invested into directly, but if we could and I wanted to be long stocks, I would exit if it fell below the three recent lows.
If I wanted to be short, I would exit if it broke out above the prior high.
This is just an oversimplified example of how I tactically manage risk.
Hurricane Dorian looks to add to the August volaltity. Hurricane Dorian is now expected to intensify into a Category 4 hurricane as it moves toward Florida and the U.S. Let’s hope it loses its momentum. I’m in Tampa Bay on the other side. It should slow down by the time it reaches us. Our home is made of concrete, tile roof, and 150 MPH hurricane windows, so we’ll be fine.
Mike Shell is the Founder and Chief Investment Officer of Shell Capital Management, LLC, and the portfolio manager of ASYMMETRY® Global Tactical.
Mike Shell and Shell Capital Management, LLC is a registered investment advisor focused on asymmetric risk-reward and absolute return strategies and provides investment advice and portfolio management only to clients with a signed and executed investment management agreement. The observations shared on this website are for general information only and should not be construed as advice to buy or sell any security. Securities reflected are not intended to represent any client holdings or any recommendations made by the firm. Any opinions expressed may change as subsequent conditions change. Do not make any investment decisions based on such information as it is subject to change. Investing involves risk, including the potential loss of principal an investor must be willing to bear. Past performance is no guarantee of future results. All information and data is deemed reliable, but is not guaranteed and should be independently verified. The presence of this website on the Internet shall in no direct or indirect way raise an implication that Shell Capital Management, LLC is offering to sell or soliciting to sell advisory services to residents of any state in which the firm is not registered as an investment advisor. Use of this website is subject to its terms and conditions.
Just yesterday I shared the observation in The value of technical analysis of stock market trends that the stock indexes were in a tight range the past month and we’d likely see a breakout, up or down.
I didn’t mention possible macroeconomic or geopolitical factors, I just pointed it out saying the market does what it does., and something or someone gets the blame.
Today, the stock market has shifted from being positive after the open, shaking off news of China imposing new tariffs on the U.S., to a waterfall decline down -2% at this point. Below is the up-close trend of today’s action so far.

Some probably believe the stock market is falling because of the new China Tariffs on the U.S, Trump Tweet about China, Jackson Hole Comments, or The Federal Reserve.
The reality is, it’s just the market, doing what it does.
I focus on that. The price trend and volatility.
Here is the trend looking at the tight range I observed yesterday. As you can see, the price is still within the range, but it’s trending toward the lower range.

In the meantime, the CBOE S&P 500 Volatility Index (VIX) has spiked up 25% today on the new enthusiasm for expected future volatility.

Wikipedia defines Technical Analysis as:
In finance, technical analysis is an analysis methodology for forecasting the direction of prices through the study of past market data, primarily price and volume.
By that definition, what I’m sharing here isn’t Technical Analysis, I guess.
Investopedia defines it as:
Technical analysis is a popular trading method that analyzes past price action, usually on charts, to help predict future price movements in financial markets.
But, I am analyzing past price action on charts, but not necessarily to predict future price movements.
I’ll just call it charting.
I hope you find it helpful.
Let’s see how it closes.
Mike Shell is the Founder and Chief Investment Officer of Shell Capital Management, LLC, and the portfolio manager of ASYMMETRY® Global Tactical.
Mike Shell and Shell Capital Management, LLC is a registered investment advisor and provides investment advice and portfolio management exclusively to clients with a signed and executed investment management agreement. The observations shared on this website are for general information only and should not be construed as advice to buy or sell any security. Securities reflected are not intended to represent any client holdings or any recommendations made by the firm. Investing involves risk, including the potential loss of principal an investor must be willing to bear. Past performance is no guarantee of future results. All information and data is deemed reliable, but is not guaranteed and should be independently verified. The presence of this website on the Internet shall in no direct or indirect way raise an implication that Shell Capital Management, LLC is offering to sell or soliciting to sell advisory services to residents of any state in which the firm is not registered as an investment advisor. Use of this website is subject to its terms and conditions.
Since I mentioned it a week ago, volatility has indeed expanded.
In fact, it’s increased 32% today alone.

Implied volatility as observed by the VIX has almost doubled the level it was a week ago.

The Fear & Greed Index is now at the “Extreme Fear” level. VIX is one of the signals it uses to measure the degree of investor panic.

Clearly, the options market has now priced in more expected movement in the range of prices. When I mentioned it a week ago, it implied a 12% range, now it’s 23%.
The S&P 500 stock index is down 3.35% today.

We’ll see if this is enough panic selling today to drive prices low enough to attract new buying demand.
Mike Shell is the Founder and Chief Investment Officer of Shell Capital Management, LLC, and the portfolio manager of ASYMMETRY® Global Tactical.
Mike Shell and Shell Capital Management, LLC is a registered investment advisor and provides investment advice and portfolio management exclusively to clients with a signed and executed investment management agreement. The observations shared on this website are for general information only and should not be construed as advice to buy or sell any security. Securities reflected are not intended to represent any client holdings or any recommendations made by the firm. Investing involves risk including the potential loss of principal an investor must be willing to bear. Past performance is no guarantee of future results. All information and data is deemed reliable, but is not guaranteed and should be independently verified. The presence of this website on the Internet shall in no direct or indirect way raise an implication that Shell Capital Management, LLC is offering to sell or soliciting to sell advisory services to residents of any state in which the firm is not registered as an investment advisor. Use of this website is subject to its terms and conditions.
To no surprise, we are observing a volatility expansion.
I say it isn’t a surprise, because I shared my observation on July 28th in Is volatility setting up for an expansion? the following:
I’m not going to be surprised if we see a VIX volatility expansion this week along with the range of stock prices spreading out.
There are plenty of potential catalysts that could drive volatility and uncertainty higher for those who need a story driving it.
This morning, the CBOE Volatility Index® (VIX® Index®) is trending 20% to 21.20, which is its long term historical average. As I pointed out before, it was at 12 when I pointed out the possibility of a volatility expansion. I didn’t expect to see it just because it was at a low level of 12, but instead because there was no shortage of potential catalyst that could cause prices to spread out into a wide range from indecision.

The CBOE Volatility Index® (VIX® Index®) is a key measure of market expectations of near-term volatility conveyed by S&P 500 stock index option prices. Since its introduction in 1993, theVIX®Index has been considered by many to be the world’s premier barometer of investor sentiment and market volatility.
The VIX has gained 76% since I shared the observation.

Is there a way to trade this volatility? Yes, there is, and it’s easier said than done. Tactical traders can trade VIX options, futures, ETFs, or the ETN. I share the below chart for informational purposes only. It’s the iPath® Series B S&P 500® VIX Short-Term FuturesTMETN charted along with the VIX index and does not necessarily represent any position I have taken. As you can see, it has gained 27% over the past week as the VIX gained 76%, but past performance is not necessarily indicative of future results. In fact, trading the VXX is very tricky and timing is everything.

A deep dive into VXX and long volatility ETFs is beyond the scope of my mission here as I just want to show a simple example of “long volatility” for asymmetric hedging. The succinct reason the VXX didn’t track the VIX index perfectly is because he Index offers exposure to a daily rolling long position in the first and second month VIX futures contracts and reflects market participants’ views of the future direction of the VIX index at the time of expiration of the VIX futures contracts comprising the Index. Owning the ETNs is not the same as owning interests in the index components included in the Index or a security directly linked to the performance of the Index. For additional information including the risks associated with VXX and ETNs, please see the VXX prospectus. The bottom line is, to successfully trade the VXX is beyond simply trading its price trend, it also requires understanding its roll yield issues and the VIX term structure.
While CBOE Volatility Index® (VIX® Index®) is a measure of market expectations of near-term volatility conveyed by S&P 500 stock index option prices, I use other measures to observe actual, realized, historical volatility.
Below is the S&P 500 stock index with bands of standard deviation. As you can see, the red arrow shows the price has spread out below the lower volatility band. These volatility bands normally contain the range of price, until it doesn’t. In this case, the volaltity is measured by the standard deviation, so this is a simple observation of the standard deviation shortfall. A price trend can and does trend beyond its normal range.

In the next chart, I use channels that represent a band of the average true range. In this case, the average true range is adapting more responsive by spreading out faster, so the SPX price trend is still within its lower channel as the price trends down.

The bottom line is, we’re seeing a volatility expansion as I suspected we could.
We’ll see where it goes from here…
Mike Shell is the Founder and Chief Investment Officer of Shell Capital Management, LLC, and the portfolio manager of ASYMMETRY® Global Tactical.
Mike Shell and Shell Capital Management, LLC is a registered investment advisor and provides investment advice and portfolio management exclusively to clients with a signed and executed investment management agreement. The observations shared on this website are for general information only and should not be construed as advice to buy or sell any security. Securities reflected are not intended to represent any client holdings or any recommendations made by the firm. Investing involves risk including the potential loss of principal an investor must be willing to bear. Past performance is no guarantee of future results. All information and data is deemed reliable, but is not guaranteed and should be independently verified. The presence of this website on the Internet shall in no direct or indirect way raise an implication that Shell Capital Management, LLC is offering to sell or soliciting to sell advisory services to residents of any state in which the firm is not registered as an investment advisor. Use of this website is subject to its terms and conditions.
I suggested in Is volatility setting up for an expansion? we may see volatility increase.
Sure enough, implied volatility, as measured by the VIX, has trended up from 12.16 to 15.30, which implies the expected volatility over the next 30 days has examined from about 12% to 15%.

The bands around the price trend below use a measure of realized historical volatility (standard deviation) over the past 20 days. As the realized volatility has contracted, it signals the range of prices spreading out has been narrow. This is an uptrending, quiet, market condition. When I see one market condition like this I’m alert for it changing.

In the next chart, we observe another channel of volatility around the stock index measured with average true range (ATR) and it has been a tighter band. The stock index price has also been pushing the upper boundary since the beginning of the year.

Periods of low and contracting volatility are often followed by periods of higher and expanding volatility.
On the other hand, here we see the realized volaltity of implied volatility has reached its upper band, so if it remains within a normal range, it may remain inside the band. However, it can certainly spike up if the market expects higher movement.

So, Semper Gumby, always flexible.
This uptrend could change.
I know when I’ll exit all my positions if they trend down enough to cut my losses short. I also know what percent of drawdown that would lead to if all of my positions decline together. If I wanted, I could tighten it up to reduce the drawdown if prices fall more. Or, I could hedge with a short index position or go long volatility.
You can probably see how everyone decides what they get from the market.
Mike Shell is the Founder and Chief Investment Officer of Shell Capital Management, LLC, and the portfolio manager of ASYMMETRY® Global Tactical.
Mike Shell and Shell Capital Management, LLC is a registered investment advisor and provides investment advice and portfolio management exclusively to clients with a signed and executed investment management agreement. The observations shared on this website are for general information only and should not be construed as advice to buy or sell any security. Securities reflected are not intended to represent any client holdings or any recommendations made by the firm. Investing involves risk including the potential loss of principal an investor must be willing to bear. Past performance is no guarantee of future results. All information and data is deemed reliable, but is not guaranteed and should be independently verified. The presence of this website on the Internet shall in no direct or indirect way raise an implication that Shell Capital Management, LLC is offering to sell or soliciting to sell advisory services to residents of any state in which the firm is not registered as an investment advisor. Use of this website is subject to its terms and conditions.
I’m not going to be surprised if we see a VIX volatility expansion this week along with the range of stock prices spreading out.
There are plenty of potential catalysts that could drive volatility and uncertainty higher for those who need a story driving it.
According to Bloomberg:
As Fed officials begin their discussions on Tuesday they will have some more data with which to assess the economy. Personal income, pending home sales and consumer confidence statistics are all due that morning. Then on Thursday, the ISM manufacturing report is expected to show industry is stabilizing and continuing to expand. Friday’s trade data will be pored over for evidence that the skirmish with China is having an effect. Also next week, the Treasury will say on Wednesday how much money it needs to borrow amid rising budget deficits.
For me, the driver of a volatility expansion $VIX will just seem like a normal countertrend from a historically very low point. As vol has contracted into the 12’s it is at the low level of its cyclical range. This is when I start looking for a reversal.

VIX futures are at a 9.86% contango, so the roll yield is a little steep. That is, the September VIX future is about 10% higher in price than the August VIX price. The difference in the price creates a roll yield those traders who are short VIX options or futures hope to earn.

Those of us more focused on the directional trend, especially countertrends, will be more alert to see volatility expand from here. The trouble is, the contango creates a headwind for the ETFs and ETNs we may want to enter long at some point. That’s because they may invest in both the front month and second month, so as they roll forward through time they are selling the lower-priced august to buy more of the higher-priced September. This negative roll yield is why the VIX based ETFs trend down over the long term. To trade them successfully, timing is important, but it’s also not so simple.
The next chart is the S&P 500 stock index with Bollinger Bands around the price trend set at two standard deviations from its 20 day moving average. While the VIX is an implied volatility index based on how the options market has priced options of the S&P 500 index stocks, these bands are measures of realized volatility. Actual volatility has also contracted recently.

Periods of low and contracting volatility are often followed by periods of higher and expanding volatility.
Let’s see how it goes…
Mike Shell is the Founder and Chief Investment Officer of Shell Capital Management, LLC, and the portfolio manager of ASYMMETRY® Global Tactical.
Mike Shell and Shell Capital Management, LLC is a registered investment advisor and provides investment advice and portfolio management exclusively to clients with a signed and executed investment management agreement. The observations shared on this website are for general information only and should not be construed as advice to buy or sell any security. Securities reflected are not intended to represent any client holdings or any recommendations made by the firm. Investing involves risk including the potential loss of principal an investor must be willing to bear. Past performance is no guarantee of future results. All information and data is deemed reliable, but is not guaranteed and should be independently verified. The presence of this website on the Internet shall in no direct or indirect way raise an implication that Shell Capital Management, LLC is offering to sell or soliciting to sell advisory services to residents of any state in which the firm is not registered as an investment advisor. Use of this website is subject to its terms and conditions.
The CBOE VIX is settling down again after getting after it last year.
The VIX is designed to measure the 30-day expected volatility of the U.S. stock market, derived from real-time, mid-quote prices of S&P 500® Index call and put options.
The VIX Index is a measure of the market’s expectation of future volatility, so the market is pricing in less volatility from here.

VXV calculates based on a 3-month measure instead of VIX’s 1-month measure. The chart gives us an observation of term structure. Typically, we expect longer dated options like the 3-month to be higher than 1-month because they offer “insurance” for a more extended period. If the 1-month is higher than the 3-month, it means near term implied volatility has spiked, so the market is probably buying the protection of options. Right now the 1-month is lower than the 3-month, so the term structure is back to its normal contango.
By the way, anyone trading volatility or hedging with the VXX ETN should be aware that VXX is maturing on January 30th, 2019. Barclays has created a replacement with iPath® Series B S&P 500® VIX Short-Term FuturesTM ETN (VXXB).
Speaking of CBOE, it will be interesting to see the outcome of the earnings report on February 8th and if the volatility last year improves their profitability. Blow is an interesting observation of the stock. The stock has declined -31% since its high last February. The orange line is the forward PE Ratio, with the stocks price over its earnings per share “predicted” by analysts. Keep in mind, analyst estimates are often wrong. Their expectations are no sure thing. The red line is the trailing 12 months earnings per share (EPS). The gap down in Forward P/E corresponding to the trailing twelve month EPS is an interesting observation.

The Forward P/E Ratio can signal analyst sentiment of a stock. If the forward P/E ratio is higher than the current P/E ratio, it indicates decreased expected earnings. A Forward P/E ratio less than the current P/E means expected increased earnings. Charting them below, it doesn’t appear the analyst are overly optimistic about the EPS report. But, what if they’re wrong?

We’ll soon learn if options and futures trading in VIX results in profits for CBOE in a volatility expansion. Over the past year, that hasn’t been the case, so maybe it’s time?

We’ll see.
Only time will tell if VIX implied volatility continues to contract and the CBOE stock trends up or down. But, if any company that should profit from directional movement up or down and a volatility expansion, it’s the CBOE. Analysts can get the CBOE stock wrong and the market can get the future volatility wrong,
Let’s see how it unfolds.
Mike Shell is the Founder and Chief Investment Officer of Shell Capital Management, LLC, and the portfolio manager of ASYMMETRY® Global Tactical.
The observations shared on this website are for general information only and are not specific advice, research, or buy or sell recommendations for any individual. Investing involves risk including the potential loss of principal an investor must be willing to bear. Past performance is no guarantee of future results. The presence of this website on the Internet shall in no direct or indirect way raise an implication that Shell Capital Management, LLC is offering to sell or soliciting to sell advisory services to residents of any state in which the firm is not registered as an investment advisor. Use of this website is subject to its terms and conditions.
I know, you’re thinking this is about the Tennessee Vols.
Nope.
Different vol.
I’m not talking about Tennessee Volunteers, I’m talking about the volatility of the stock market.
Someone asked:
“With the S&P 500 is up 3.43% on Friday, volatility is up, way up. So, why is the VIX down -16%? “
The short answer is the CBOE Volatility Index (VIX) is volatility implied by S&P 500 options prices, so it’s expected future volatility, not actual or realized historical volatility. In fact, the VIX is an estimate of volatility for the next 30 days. Part of the price of S&P 500 options is an estimate of how volatile the S&P 500 will be between now and the option’s expiration date. This estimate is not directly observed but is implied by how much buyers are willing to pay for options. If the market has been volatile as it has been recently, option premiums will increase with the volatility expansion. When the stock market is calm and smooth like it was in 2017, options prices will decrease as a volatility contraction. So, the VIX is implied volatility, not historical realized volatility.
Since investors tend to extrapolate the recent past into the future, they usually expect recent calm markets to continue and violent swings to persist. However, we’ve experienced nearly a year of a high volatility regime with the S&P 500 swinging up and down in a range as high as 20%. However, we’ve now seen two high volume up days and the second is considered to be an upward follow-through day. Such a thrust seems to have the options market expecting lower volatility over at least the next month. That’s how I see it. Others may believe its a reaction to the economic news. It is what it is.
What is perplexing to those not familiar with VIX movement is it decreased so dramatically as the price actually gained a lot. Volatility actually expanded, but to the upside, and implied volatility evaporated. That doesn’t sound like a volatility gauge.
Another issue is not all volatile calculations really measure upside and downside vol the same way. Below is the S&P 500 index.

A few observations:
As the price has spiked up, historical volatility as measured by standard deviation is trending down sharply and so is implied volatility. The only measure actually accounting for this wide range of prices (up in this case) is the average true range.
You may be wondering why?
Standard deviation a statistical model that measures the volatility of a price trend. The calculation assumes that two standard deviations should contain 95% of the price data.
The average true range includes the total “true” range of the price trend by comparing highs, lows, and closes, and compares the price change over different days to account for gaps up and down in price.
As you can see, the average true range of price appears to more accurately reflect the volatility as prices spread out. The standard deviation is recovering from the large deviations as the average true range is reflecting remaining day to day volatility.
What does it matter, anyway?
Volatility measures may be used to create indicators for trading signals. For example, in the chart, I added channels above and below the price trend that are 2 times the standard deviation. These bands are expected to include about 95% of price action.

There are two ways it may be used for tactical trading.
A trend following system may use them to identify a breakout because moves outside the price range are rare. A trend following system expects such strong momentum will continue.
A countertrend system does just the opposite.
I’m just sharing this as an observation to answer a question. We could test these signals to see their results as a system to quantify which one may have a better asymmetric risk/reward. But, for this purpose, we can see how these three volatility indicators are similar or different.
I could have titled this observation “A Tale of 4 Vols” since we can observe the distinctions between “lower volatility” and “higher volatility” by simply looking at the price trend. Over the past two years, we’ve certainly observed a period of low vol change into high vol. I call it a volatility expansion and though, for me, using the VIX and other indicators signaled the possible change, the price trend itself is the final arbiter.

By the way, what about the other vol? The Tennessee Vol? Why do they call Tennessee the “Volunteer State” and the Tennessee Volunteers?
Appalachian Magazine shares the story:
“The proclamation went out from Nashville that the federal government needed 2,600 volunteers to assist in the war with Mexico… Within a week’s time, more than 30,000 Tennesseans responded to the call to arms. And it was from this overwhelming show of patriotism that the State of Tennessee not only assisted in winning the outright sovereignty of the State of Texas, but also in securing its lasting title as The Volunteer State.”
So, there you have it.
I guess I could have titled this observation “A Tale of Five Vols.” You can probably see how observations can spread out to a wider range and become more volatile. It’s even true for the topic of volatility.
Mike Shell is the Founder and Chief Investment Officer of Shell Capital Management, LLC, and the portfolio manager of ASYMMETRY® Global Tactical.
The observations shared on this website are for general information only and are not specific advice, research, or buy or sell recommendations for any individual. Investing involves risk including the potential loss of principal an investor must be willing to bear. Past performance is no guarantee of future results. The presence of this website on the Internet shall in no direct or indirect way raise an implication that Shell Capital Management, LLC is offering to sell or soliciting to sell advisory services to residents of any state in which the firm is not registered as an investment advisor. Use of this website is subject to its terms and conditions.

In the last observation I shared about the stock market, “The stock market trends up with momentum,” we saw the stock market reverse back up with strong momentum. The S&P 500 stock index had declined about -7% from its high, then reversed back up 3%. I discussed how investor behavior and sentiment drives market prices. Many investor sentiment measures signaled investor fear seemed to be in control, driving down prices. Volatility had spiked and then started to settle back down. Many individual stocks in the S&P 500 had declined enough to signal shorter-term downtrends, but then they reversed up. I closed by saying:
In summary, today was a strong upward momentum day for the stock market and most stocks participated in the uptrend. After sharp declines like we’ve seen this month, the stock market sometimes reverses up like this into an uptrend only to reverse back down to test the low. After the test, we then find out if it breaks down or breaks out.
One day doesn’t make a trend, but for those who are in risk taker mode with stocks, so far, so good.
The part I bolded with italics has turned out to be the situation this time.
Below is a year to date price trend of the S&P 500 stock index. As of today, my observation “the stock market sometimes reverses up like this into an uptrend only to reverse back down to test the low” is what we are seeing now.

I’ve always believed investment management is about probability and possibilities, it’s never a sure thing. The only certainty is uncertainty, so all we can do is stack the odds in our favor. As I said before, “After the test, we then find out if it breaks down or breaks out.”
The positive news is, investor sentiment measures are reaching levels that often precede short-term trend reversals back up.
The bad news is if the current trend becomes a bigger downtrend these indicators will just stay at extremes as long as they want. We have to actively manage our exposure to loss if we want to avoid large losses, like those -20% or more that are harder to overcome.
Down -10% is one thing, down -20% is another. Any investor should be willing to bear -10% because they will see them many times over the years. Only the most passive buy and hold investors are willing to bear the big losses, which I define as -20% or more.
Nevertheless, I see some good news and bad, so here it is. I’ll share my observations of the weight of the evidence by looking at relatively simple market indicators. I don’t necessarily make my tactical decisions based on this, but it is instead “market analysis” to get an idea of what is going on. Observations like this are intended to view the conditions of the markets.
Fear is the dominant driver.
The Fear & Greed Index tracks seven indicators of investor sentiment. When I included it a week ago, it was at 15, which is still in the “Extreme Fear” zone. The theory is, the weighting of these seven indicators of investor sentiment signals when fear or greed is driving the market. Clearly, fear is the dominant driver right now.

At this point, we can see investor sentiment by this measure has now reached the low level of its historical range. In this chart, we can see how investor sentiment oscillates between fear and greed over time in cycles much like the stock market cycles up and down.

I believe investor behavior is both a driver of price trends, but investors also respond to price trends.
Investor sentiment and price trends can overreact to the upside and downside and the herd of investors seems to get it wrong when they reach an extreme. We observe when these kinds of indicators reach extremes, these cycles are more likely to reverse. It is never a sure thing, but the probabilities increase the possibility of a reversal. But, since there is always a chance of a trend continuing longer in time and more in magnitude, it is certainly uncertain. Since there is always a chance of a bad outcome, I have my limits on our exposure to risk with predetermined exits or a hedge.
Speaking of a hedge.
I started pointing out my observation several weeks ago of a potential volatility expansion. If you want to read about it, most of the past few weeks observations have included comments about the VIX volatility index. Over the past few days, we’ve observed a continuation in the volatility expansion.

Implied volatility has expanded nearly 100% over in the past 30 days.

As a tactical portfolio manager, my first focus is risk management. When I believe I have defined my risk of loss, I become willing to shift from risk manager to risk taker. I share that because I want to point out the potential for hedging with volatility. Rather than a detailed exhaustive rigorous 50-page paper, I’m going to keep it succinct.
My day job isn’t to write or talk about the markets. I’m a professional portfolio manager, so my priority is to make trading and investment decisions as a tactical investment manager. I’m a risk manager and risk taker. If I never take any risk, I wouldn’t have any to manage. The observations I share here are just educational, for those who want to follow along and get an idea of how I see things. I hope you find it helpful or at least interesting. It’s always fun when it starts new conversations.
To keep the concept of hedging short and to the point for my purpose today, I’ll just share a simple chart of the price trend of the stock index and the volatility index over the past 30 days. The stock index has declined -8.3% as the implied volatility index expanded over 95%. You can probably see the potential for a hedge. However, it isn’t so simple, because these are just indexes and we can’t buy or sell the VIX index.

The purpose of a hedge is to shift the risk of loss from one thing to another. The surest way to reduce the possibility of loss is to simply sell to reduce exposure in the thing that is the risk. That’s what I do most of the time. For example, when I observed a potential volatility expansion, I reduced my exposure to positions that had the possibility of loss due to increased volatility. Once prices fall and volatility contracts, maybe we increase exposure again to shift back to risk-taking. If we take no risk at all, we would have no potential for a capital gain. So, tactical portfolio management is about increasing and decreasing exposure to the possibility of gain and loss. If we do it well, we create the kind of asymmetric risk/reward I aim for.
So, any hedging we may do is really just shifting from one risk to another, hoping to offset the original risk. Keep in mind, as I see it, a risk is the possibility of loss. I’ll share more on hedging soon. I have some observations about hedging and hedge systems you may find interesting.
Most stocks are participating in the downtrend. Below is an updated chart of the percent of the stocks in the S&P 500 that are above their 50-day moving average. If you want to know more about what it is, read the last observations. The simple observation here is that most stocks are declining.

Much like how we saw investor sentiment cycle and swing up and down, we also see this breadth indicator oscillate from higher risk levels to lower risk levels.
The good news is, at some point selling pressure does get exhausted as those who want to sell have sold and prices reach a low enough level to bring in new buying demand.
That’s what stock investors are waiting for now.
These are my observations. I don’t have a crystal ball, nor does anyone. I just predetermine my risk levels in advance and monitor, direct, and control risk through my exits/hedging how much I’m willing to risk, or not. We’ll just have to see how it all unfolds in the days and weeks ahead.
Only time will tell if this is the early stage of a bigger deeper downtrend or just another correction within the primary trend.
I hope you find my observations interesting and informative.
Mike Shell is the Founder and Chief Investment Officer of Shell Capital Management, LLC, and the portfolio manager of ASYMMETRY® Global Tactical.
The observations shared on this website are for general information only and are not specific advice, research, or buy or sell recommendations for any individual. Investing involves risk including the potential loss of principal an investor must be willing to bear. Past performance is no guarantee of future results. The presence of this website on the Internet shall in no direct or indirect way raise an implication that Shell Capital Management, LLC is offering to sell or soliciting to sell advisory services to residents of any state in which the firm is not registered as an investment advisor. Use of this website is subject to its terms and conditions.
When the stock market indexes swing up or down 1% or more I try to share my observations of the directional trend and changes in volatility. Continuing from my observation yesterday in Observations of the stock market decline and volatility expansion when I shared:
The good news is, we’ve now experienced some volatility expansion, stocks have now pivoted down to the lower end of their cycles, so maybe volatility will contract and stock prices resume their uptrend.
We’ll see.
Well, today we saw.
The U. S. stock market gains were broad across all sectors. Communication Services, Consumer Discretionary, Healthcare, and Technology were the relative momentum leaders.

Continuing with the % of S&P 500 stocks above their 50 day moving average as breadth indicator was another indication of broad upward momentum. 86% more stocks are trading above their shorter-term trend, an expansion from a low level. For those of us who like to enter trends early in their stage, this is a positive sign of improvement for the stock market.

We observe the same in the percent of stocks trending back above their longer-term trends. There was a 16% expansion in the stocks in the S&P 500 index trending above their 200 day moving average. The longer-term trend indicators are slower to respond, but this is more evidence of positive directional movement.

This is happening at a time when many investor sentiment indicators suggest fear has been driving stocks recently. A simple example is the Fear & Greed Index, which reached “Extreme Fear” a week ago.

As a portfolio manager for the past two decades, I have observed investor sentiment oscillate between fear and greed, but as a contrarian pendulum. Most investors feel the wrong feeling at the wrong time.
What happens, though, is market trends move in multiple time frames of cycles up and down. Prices can overreact to the upside and downside and the majority of investors seem to get it wrong.
The level and direction of implied volatility is an indication of investor sentiment. I’ve shared my observations of the volatility expansion and noted some volatility contraction yesterday. So far, the volatility expansion has reversed to contraction, so the expected volatility as implied by options prices now suggests the market expects lower volatility in the weeks ahead.

But, just as I pointed out on September 25th in VIX level shows market’s expectation of future volatility implied volatility can get it wrong. I pointed out then the implied volatility was very low signaling to me the market may have been wrong to expect such low future volatility, so it can reverse back up again.
In summary, today was a strong upward momentum day for the stock market and most stocks participated in the uptrend. After sharp declines like we’ve seen this month, the stock market sometimes reverses up like this into an uptrend only to reverse back down to test the low. After the test, we then find out if it breaks down or breaks out.
One day doesn’t make a trend, but for those who are in risk taker mode with stocks, so far, so good.
Mike Shell is the Founder and Chief Investment Officer of Shell Capital Management, LLC, and the portfolio manager of ASYMMETRY® Global Tactical.
The observations shared on this website are for general information only and are not specific advice, research, or buy or sell recommendations for any individual. Investing involves risk including the potential loss of principal an investor must be willing to bear. Past performance is no guarantee of future results. The presence of this website on the Internet shall in no direct or indirect way raise an implication that Shell Capital Management, LLC is offering to sell or soliciting to sell advisory services to residents of any state in which the firm is not registered as an investment advisor. Use of this website is subject to its terms and conditions.

On September 25th I shared in VIX level shows market’s expectation of future volatility when I pointed out a low level of expected volatility as implied by the VIX index.
I said:
The current level of the VIX index has settled down to a lower historical level suggesting the market expects the future range of the price of the S&P 500 to be lower. Below is the current level relative to the past year.
I went on to explain my historical observations of volatility cycles driven by investor behavior:
The VIX Index is intended to provide a real-time measure of how much the market expects the S&P 500 Index to fluctuate over the next 30 days. The VIX Index reflects the actual order flow of traders
Since investors tend to extrapolate the recent past into the future, they usually expect recent calm markets to continue and violent swings to persist.
After the stock market declines and volatility expands, investors extrapolate that recent experience into the future and expect volatility to continue. Sometimes it does continue, but this time it gradually declined as the price trend became calmer.
When markets have been calm, traders and investors expect volatility to remain low. Before February, the VIX implied volatility had correctly predicted low realized volatility for months. But, both realized and expected volatility was so low that many investors were shocked when stock prices fell sharply, and volatility expanded.
When the market expects volatility to be low in the next 30 days, I know it could be right for some time. But, when it gets to its historically lowest levels, it raises situational awareness that a countertrend could be near. It’s just a warning shot across the bow suggesting we hedge what we want to hedge and be sure our risk levels are appropriate.
I shared the chart below, showing implied volatility at the low end of the cycle over the past year:

Since that date, we’ve indeed witnessed a volatility expansion of more than 90% in the VIX index and a decline in the S&P 500 stock index over -6%. Implied volatility has expanded and stocks declined. As implied volatility is now starting to contract, below we can see the recent expansion as it trended from 12 to 24. Today its back to its long-term average of 20.

Stock market indexes, both U. S. and international, have declined 6 – 7% from their highs.

At this point, this has been a normal short-term cycle swing in an ongoing uptrend that is frequently referred to as a “correction.”
To be sure, we can see by looking at the % drawdowns in the primary uptrend that started in March 2009.

Markets cycle up and down, even within overall primary uptrends. As we see over a nine-year period, the current decline is about average and half as deep as the largest declines since 2009.
You can probably see what I meant by situational awareness of the markets cycles, trends, and volatility levels.
It isn’t enough to just say it or write about it. My being aware of the situation helps me to do what I said, which is worth repeating:
But, when it gets to its historically lowest levels, it raises situational awareness that a countertrend could be near. It’s just a warning shot across the bow suggesting we hedge what we want to hedge and be sure our risk levels are appropriate.
As far as the stock market condition, I like to see what is going on inside. Just as volatility swings up and down in cycles, so do price trends. As I’ve pointed out before, I observe prices swinging up and down often driven by investor behavior. For example, many investors seem to oscillate between the fear of missing out and the fear of losing money.
“The less the prudence with which others conduct their affairs, the greater the prudence with which we must conduct our own.” – Warren Buffett
One visual way to observe the current stage is the breadth of the stock market as I shared last week in The Stock Market Trend. Below is the percent of stocks in the S&P 500 index trending above their 50 day moving averages often used as a short-term trend indicator. This is a monthly chart since 2009 so we can see how it oscillates up and down since the bull market started. At this point, the number of stocks falling into short-term downtrends is about what we’ve seen before.

The risk is: this continues to be an aged old bull market, so anything is possible. That is why my focus every day is situational awareness. But, there is always a risk of a -10% or more decline in the stock market, regardless of its age or stage.
The good news is, we’ve now experienced some volatility expansion, stocks have now pivoted down to the lower end of their cycles, so maybe volatility will contract and stock prices resume their uptrend.
We’ll see.
All that is left to do is observe, be prepared, and respond tactically as it all unfolds.
Mike Shell is the Founder and Chief Investment Officer of Shell Capital Management, LLC, and the portfolio manager of ASYMMETRY® Global Tactical.
The observations shared on this website are for general information only and are not specific advice, research, or buy or sell recommendations for any individual. Investing involves risk including the potential loss of principal an investor must be willing to bear. Past performance is no guarantee of future results. The presence of this website on the Internet shall in no direct or indirect way raise an implication that Shell Capital Management, LLC is offering to sell or soliciting to sell advisory services to residents of any state in which the firm is not registered as an investment advisor. Use of this website is subject to its terms and conditions.
The stock market declined with heavy selling pressure on a major stock market anniversary that I haven’t heard anyone mention.
October 10, 2018, is the 10-year anniversary of the waterfall decline of 2008.
Below is the S&P 500 stock index from October 9, 2007 to October 10, 2008. I remember it very well. It was the first part of the waterfall decline up to this day 10 years ago.

But, as a reminder, while this bear market is often called the “2008 Financial Crisis” and misquoted as being only about the year 2008, it actually continued through March 9, 2009.

With stock indexes only about -5% or so off their all-time highs, we are far from that today. But, the stock market decline today was impressive in magnitude and broad across all sectors.

The breadth of the decline was unmistakable by the 50% decline in the % of stocks in the S&P 500 trading above their 50 day moving average. The percentage of stocks trading above the moving average is a breadth indicator that measures internal strength or weakness in the stocks in the index and the index itself. We say that breadth is strong when the majority of stocks in an index are trading above their moving average. Since the 50-day moving average is used to measure the short-medium term trend, it reveals that only 24% of the 500 stocks in the S&P 500 index are above their short-term trend.

I colored the top red and the bottom green because the extreme highs and extreme lows can signal overbought and oversold levels.
The indicator is an oscillator that cycles between 0% and 100%.
After most stocks have trended up, we say an uptrend has broad participation, which is positive. However, markets cycle and oscillate up and down, so once most stocks have already been in uptrends at some point they reverse back down.
After most stocks have trended down, we say a downtrend becomes washed out. As selling eventually gets exhausted because those who want to sell have already sold.
Next, we observe the % of stocks in the S&P 500 index that are trending above their 200 day, which a longer term trend signal. 19% of the stocks declined below their 200 day moving average today leaving about half of the stocks still in a longer-term uptrend.

Since we are talking about moving averages and the S&P 500, below is the index itself with the 50 and 200 day moving average. Notice the 50 day moving average has been too tight to contain the uptrend. In other words, entering and exiting it would lead to many buys and sells and whipsaws like in June. The 200 day has better contained the trend since April, but notice if it were used as an exit it would have resulted in selling at the low. This observation is just using these moving averages as a very simple way to define uptrend vs. downtrend, it is not a complete trading system. Such measures are never perfect, and they don’t have to be.

Today’s decline was impressive because the stock indexes declined over -3% in a single day. One day doesn’t make a trend, but it was enough to erase most of the year to date gains for the stock index.

The Dow Jones Industrial Average of 30 of America’s largest companies declined even more than the S&P 500. There was even more weakness in small companies, momentum stocks, and an ETF tracking the top-ranked growth and momentum stocks by Investor’s Business Daily declined nearly -6%. As a proxy for leading growth and momentum stocks, this is an indication the leaders declined the most today.

You can probably see why I believe it’s essential to actively manage risk by knowing in advance when to exit a loser to cut losses short as well as understanding the market risk level. For those of us who weren’t fully exposed to the decline who have the capital to eventually buy at lower prices, we get to take advantage of a falling trend.
Over the past week, I shared observations of volatility expansion as the implied volatility index has been trending up. Below is its year to date trend.

Here it is over the past week since I mentioned it. I included the S&P 500 stock index to illustrate as the stock market declined about -5% the past week, implied volatility expanded 98%.

We’ll see in the days and weeks ahead if this is the beginning of a more significant downtrend that becomes a waterfall decline or if it was enough to exhaust the selling pressure of those who wanted to sell.
Mike Shell is the Founder and Chief Investment Officer of Shell Capital Management, LLC, and the portfolio manager of ASYMMETRY® Global Tactical.
The observations shared on this website are for general information only and are not specific advice, research, or buy or sell recommendations for any individual. Investing involves risk including the potential loss of principal an investor must be willing to bear. Past performance is no guarantee of future results. The presence of this website on the Internet shall in no direct or indirect way raise an implication that Shell Capital Management, LLC is offering to sell or soliciting to sell advisory services to residents of any state in which the firm is not registered as an investment advisor. Use of this website is subject to its terms and conditions.
The volatility expansion observation I shared last week has continued.
If you haven’t followed along, I suggest reading VIX level shows the market’s expectation of future volatility and Here comes the volatility expansion to see where I am coming from.
Implied volatility as measured by the CBOE Volatility Index $VIX has gained about 45% in the past three trading sessions, so volatility is expanding.

I discussed what a rising VIX and volatility expansion means in the prior observations.
Rising implied volatility means rising expectations for future volatility as implied by options prices. Ultimately, Implied volatility is determined by the price of options contracts.
In other words, implied volatility is driven by supply and demand and order flow.
An increase in options buying increases the price of options which results in higher implied volatility.
The net selling of options decreases the price of options which results in lower implied volatility.
Volatility isn’t directional.
Volatility is a measure of movement and how wide prices spread out, which says nothing about the direction of the price trend. Prices can be trending up sharply and volatility measures could expand.
Here are some examples:
Trending up with volatility expansion: a price trend that gains 10% a day for several days is a directional uptrend, but it’s also volatile. We would say the trend is up, but it’s also a volatility expansion as the price range is expanding.
Non-trending with volatility expansion: a price trend that cycles up and down around 5% a day for a long time with no clear direction up or down is a non-trending condition, but it’s also volatile. We would say it is non-trending, but it’s also a volatility expansion.
Trending down with volatility expansion: a price trend that declines 10% a day for several days is clearly a downtrend, with volatility. We could say the trend is down with expanding volatility.
Most of the time, the risk is asymmetric since we tend to see increased volatility when we see falling prices. As prices fall, more investors and traders respond to the simple fact the prices are falling and they are losing money. This serial correlation with falling prices can lead more prices falling even more as investors sell because prices are falling.
However, occasionally we may observe prices trending down with volatility contraction. A falling price trend with contracting volatility is necessarily going to be a slower downtrend with less directional movement. Instead of 5% or 10% declines, it may be 1 or 2% declines. A downtrend without volatility expansion would be observed as a slower decline that would necessarily take longer for a large loss to develop. For example, a -30% loss would happen much faster with -10% down periods than it would at a rate of -1%. You can probably see how volatility expansions in downtrends get the attention of someone who wants to manage their drawdown.
I’ll share some more detailed ways to observe volatility to decide if volatility is expanding or contracting.
At the top of the chart is the S&P 500 stock index. The bands around the stock index are 2 times the stock index average true range over the past 20 days. The dotted line in the center of the bands is the 10-day moving average. Price trends move in cycles, so they oscillate up and down over time. When we apply bands around the price trend is gives us a visual representation of a “normal” range of prices around the trend. We observe the price trend tends to oscillate or cycle up and down within certain parameters – the range. When this range spreads out, I call it volatility expansion. When the range contracts, it’s volatility contraction. Volatility itself also tends to cycle between expansion and contraction. We can see that here.

Below the price trend chart with bands of the average true range (ATR) I included a chart of ATR, standard deviation, and the VIX. Both standard deviation and average true range are actual, historical, and realized volatility. These indicators are measuring how the price of the index has actually expanded or contracted. As I pointed out before, the VIX is a measure of options prices on the stocks in this index, so it’s driven by expectations of future volatility over the next 30 days determined by the price of options. ATR and standard deviation are the actual range of movement of the index.
I started with the year-to-date time frame to show how the price trend spread out as it started swinging up and down at the beginning of the year and has since trended up with lower volatility; smaller cycles, smaller swings.
Just as we observe market price trends tend to cycle and swing up and down over time, so does volatility. p
When we see volatility reach an extreme low/high point, we can expect to see it drift the other way eventually. Investors and traders who only believe trends in price and volatility only go one way are those who get surprised and caught in a loss trap.
Now, let’s zoom in for a closer look with just a three-month time frame to observe what has been going on more recently.
I highlighted in green the recent volatility expansion I pointed out last week. Notice the forward-looking VIX index at the bottom turned up sharper and has trended up higher than its last cycle high last month. However, realized historical volatility as measured by standard deviation and the average true range of index prices has also trended up, but on a lag relative to the forward-looking VIX.

So, you can probably see why I’m calling it a volatility expansion. It is drifting up, though it could certainly trend up a lot more, or it could reverse back down. For now, the rising prices in options suggest there is demand for protection and it is probably in response to something the market believes may lead to increase risk or volatility. It could be something seasonal like earnings season or it could be as simple as the month of October is historically one of the most volatile months.
Speaking of October…
October is a typical month to see hurricanes in the Gulf and Atlantic, too. Right now, we have Michael (no relation) coming up through the Gulf of Mexico. As of this morning, Michael was just a named storm, but its expected to expand into a Category 2 or 3 hurricane by the time it reaches the Florida panhandle to our favorite places like Sandestin, Miramar Beach, Destin, and the 30A area like Rosemary Beach and Alys Beach. The intensity, speed, and how wide the storm spreads out to reach higher categories is a lot like volatility expansion in market price trends. Most people prefer to experience calm and quiet. We would prefer to see the storm contract and slow down its speed.
Although the tropical storm monitors have ways of measuring the probability of speed, expansion, etc. we are always dealing with the certainty of uncertainty. Hurricanes can shift and drift in different directions, speed up or slow down, and expand or contract. How we respond is a matter of situational awareness of measuring the cone of uncertainty as best we can. Some of us do it better than others. Some of us prepare more timely and respond better than others.
Right now we have some volatility expansion and we are positioned as such. The implied volatility index suggests the market believes we’ll see some price swings (up and down) this month.
We’ll see how it all plays out.
Semper Gumby (Always Flexible).
Let’s hope Michael doesn’t give me a bad name.
Mike Shell is the Founder and Chief Investment Officer of Shell Capital Management, LLC, and the portfolio manager of ASYMMETRY® Global Tactical.
You can follow ASYMMETRY® Observations by click on on “Get Updates by Email” on the top right or follow us on Twitter.
The observations shared in this material are for general information only and are not intended to provide specific advice or recommendations for any individual. Investing involves risk including the potential loss of principal an investor must be willing to bear. Past performance is no guarantee of future results.
Nine days ago in VIX level shows market’s expectation of future volatility I shared an observation that the implied volatility VIX, a measure of expected future volatility that is implied by option prices, had reached an extremely low point. I explained what that means and how I use it:
When the market expects volatility to be low in the next 30 days, I know it could be right for some time.
But, when it gets to its historically lowest levels, it raises situational awareness that a countertrend could be near.
Today we have some volatility expansion.
The VIX Volatility Index has gained 35%. It implies the market now expects higher volatility. Specifically, the market expects the range of prices to spread out over 15% instead of 12%.

The popular stock indexes are down over -1% for the first time in a while.

As I said nine days ago, it should be no surprise to see some volatility expansion. Volatility is mean reverting, which means it tends to oscillate in a high and low range and reverse back to an average after its reaches those cycle highs and lows.
Implied volatility had reached its historical low end, so it’s expanding back out. Stock prices are also spreading out and declining so we shouldn’t be surprised to see more movement in prices in the coming weeks.
At around the same time volatility was contracting and calm, my momentum indicators were signaling stock indexes and many individual stocks were reaching short-term extreme levels that often preceded a short-term decline. These systems prompt me tactically reduce exposure to stocks to dynamically manage our risk.
Only time will tell how it all plays out. We’ll see how it unfolds from here.
Mike Shell is the Founder and Chief Investment Officer of Shell Capital Management, LLC, and the portfolio manager of ASYMMETRY® Global Tactical.
The observations shared in this material are for general information only and are not intended to provide specific advice or recommendations for any individual. Investing involves risk including the potential loss of principal an investor must be willing to bear. Past performance is no guarantee of future results. The presence of this website on the Internet shall in no direct or indirect way raise an implication that Shell Capital Management, LLC is offering to sell or soliciting to sell advisory services to residents of any state in which the firm is not registered as an investment advisor.
Volatility is a measure of the frequency and magnitude of price swings up and down in a market or stock over a period of time.
We can measure volatility using two general methods:
The VIX Index measures the market’s expected future volatility based on options of the stocks in the S&P 500® Index. The VIX Index estimates expected volatility by aggregating the weighted prices of S&P 500 Index put and call options over a range of strike prices.
The last observation I shared of the trend and level of VIX was VIX Trends Up 9th Biggest 1-day Move. I pointed out the VIX level had been very low, and it was an observation of complacency. The VIX spiked up nearly 300% – a volatility expansion. Actually, we could call it a volatility explosion.
The current level of the VIX index has settled down to a lower historical level suggesting the market expects the future range of the price of the S&P 500 to be lower. Below is the current level relative to the past year.
Looking at the current level of 12 compared to history going back to its inception in 1993, we observe its level is indeed near its lowest historical low.

The VIX Index is intended to provide a real-time measure of how much the market expects the S&P 500 Index to fluctuate over the next 30 days. The VIX Index reflects the actual order flow of traders.
Since investors tend to extrapolate the recent past into the future, they usually expect recent calm markets to continue and violent swings to persist.
After the stock market declines and volatility expands, investors extrapolate that recent experience into the future and expect volatility to continue. Sometimes it does continue, but this time it gradually declined as the price trend became calmer.
When markets have been calm, traders and investors expect volatility to remain low. Before February, the VIX implied volatility had correctly predicted low realized volatility for months. But, both realized and expected volatility was so low that many investors were shocked when stock prices fell sharply, and volatility expanded.
When the market expects volatility to be low in the next 30 days, I know it could be right for some time. But, when it gets to its historically lowest levels, it raises situational awareness that a countertrend could be near. It’s just a warning shot across the bow suggesting we hedge what we want to hedge and be sure our risk levels are appropriate.
Mike Shell is the Founder and Chief Investment Officer of Shell Capital Management, LLC, and the portfolio manager of ASYMMETRY® Global Tactical.
You can follow ASYMMETRY® Observations by click on on “Get Updates by Email” on the top right or follow us on Twitter.
The observations shared in this material are for general information only and are not intended to provide specific advice or recommendations for any individual. Investing involves risk including the potential loss of principal an investor must be willing to bear. Past performance is no guarantee of future results.
Christi Shell was recently asked by ETF.com “Does your firm use active ETFs”.

Her answer from the interview:
Our portfolio manager, Mike Shell, doesn’t currently include active ETFs in our universe of tradeable ETFs, but that doesn’t mean he’d never include them. He tactically shifts between ETFs, based on investor behavioral measures and supply/demand. So our portfolio management style itself is the active management; we are, essentially, actively managing beta.
We use ETFs to gain specific exposure to a return stream such as a sector, country, commodity or currency. With an index ETF, we pretty much know what we’re going to get inside the ETF. (Of course, indexes are reconstituted by a committee of people, so we don’t know in advance what they’ll do. However, an index follows some general rules systematically.)
Therefore, if we discover an ETF we believe has a strategy and return stream that we want access to, then we would add it, whether it’s active or not.
Christi Shell is Managing Director and Certified Wealth Strategist® at Shell Capital Management LLC. Christi has 27 years in financial services ranging from bank management to wealth management giving her a unique skill set and experience to help clients get what they want.
Source: http://www.etf.com/publications/etfr/does-your-firm-use-active-etfs
Yesterday we shared the 2nd Quarter 2018 Global Investment Markets Review, which used a broad range of indexes on performance tables to present the year-to-date progress of world markets. The issue with a table that simply shows a return number on it is it doesn’t properly present the path it took to get there. In the real world, investors and portfolio managers have to live with the path of the trend and we can see that only in the price trend itself. So, today we’ll look at the price trends of stocks, bonds, commodities, real estate, sectors, and other alternatives like volatility. I don’t just look for potentially profitable price trends in stocks and bonds, I scan the world.
How is the market doing this year? Which market?
First, a quick glance at global markets including commodities, stock indexes, volatility, ranked by year-to-date momentum. We wee the CBOE Volatility Index $VIX has gained the most. One clear theme about 2018 is that volatility has increased and this includes implied or expected volatility. Overall, we see some asymmetry since the markets in the green are more positive than the markets in the red. The popular S&P 500 stock index most investors point to is in the middle with only a 2% gain for the year. Commodities like Cocoa, Lumber, Orange Juice, and Crude Oil are leaders while sugar, live cattle, and soybeans are the laggards. Most investors probably don’t have exposure to these markets, unless they get it through a commodities ETF.

Most investors probably limit themselves to the broad asset classes, since that’s what most financial advisors do. So, we’ll start there. Below are the trends of broad market ETFs like the S&P 500, Aggregate Bond, Long-Term Treasury. For the year, Emerging Markets has the weakest trend – down nearly -6%. Developed Markets countries are the second weakest. The rising U.S. Dollar is helping to put pressure on International stocks. The leader this year is Commodities, as we also saw above. The Commodity index has gained 8% YTD.

What about alternative investments? We’ll use liquid alternative investments as an example since these are publicly available ETFs. I’ve included markets like Real Estate, Private Equity, Mortgage REITs, and the Energy MLP. Not a lot of progress from buying and holding these alternative investments. This is why I prefer to shift between markets trying to keep capital only in those markets trending up and out of those trending down.

The Volatility VXX ETF/ETN that is similar to the VIX index has gained so much early in the year I left it off the following chart because it distorted the trends of the other markets. It’s one of the most complex securities to trade, but we can see it spike up to 90% when global markets fell in February.

Looking at the price trend alone isn’t enough. It would be incomplete without also considering their drawdowns. That is, how much the market declined off its prior high over the period. Analyzing the drawdown is essential because investors have to live with the inevitable periods their holdings decline in value. It’s when we observe these decline we realize the need for actively managing risk. For me, actively managing risk means I have a predetermined exit point at all times in my positions. I know when I’ll exit a loser before it becomes a significant loss. Many say they do it, I’ve actually done it for two decades.
The alternative investments are in drawdowns YTD and Energy MLP, and Mortgage REIT is down over -10% from their prior highs. The Energy MLP is actually down -51% from its 2014 high, which I don’t show here.

Next, we go back to the global asset class ETFs to see their drawdowns year-to-date. We don’t just experience the gains, we also have to be willing to live with their declines along the way. It isn’t enough to provide an excellent investment management program, we also have to offer one that fits with investors objectives for risk and return. The most notable declines have been in Emerging Market and developed international countries. However, all of these assets are down off their prior highs.

Clearly, markets don’t always go up. The trends so far in the first six months of 2018 haven’t offered many opportunities for global asset allocation to make upward progress.
This is why I rotate, rather than allocate, to shift between markets rather than allocate to them. We also trade in more markets than we covered here, like leading individual stocks. The magnitude of these drawdowns also shows why I believe it is essential to direct and control risk and drawdown.
Mike Shell is the Founder and Chief Investment Officer of Shell Capital Management, LLC, and the portfolio manager of ASYMMETRY® Global Tactical.
You can follow ASYMMETRY® Observations by click on on “Get Updates by Email” on the top right or follow us on Twitter.
The observations shared in this material are for general information only and are not intended to provide specific advice or recommendations for any individual. Investing involves risk including the potential loss of principal an investor must be willing to bear. Past performance is no guarantee of future results.
It is no surprise to see global equity markets stall after such a positive trend last year. As we will see, the weakness is global and across both bonds and stocks.
Before we review the year-to-date gains and losses for indexes, I want to share some of the most interesting asset allocation indexes I’ve seen.
Keep in mind: we don’t offer this kind of asset allocation that allocates capital to fixed buckets of stocks and bonds and then rebalances them periodically. As a tactical portfolio manager, I don’t allocate to markets, I rotate between them to focus my exposure on markets in a positive trend and avoid (or short) those in a negative trend. I don’t need to have exposure to falling markets. We consider our portfolio a replacement (or at least a compliment) to traditional “asset allocation” offered by most investment advisors.
I want to present some global asset allocation indexes because, in the real world, most investors don’t allocate all of their investment capital to just stocks or just bonds; it’s some combination of them. If they keep their money in cash in the bank, they aren’t investors at all.
To observe what global asset allocation returns look like, we can look at the Morningstar Target Risk Indexes:
The Morningstar Target Risk Index series consists of five asset allocation indexes that span the risk spectrum from conservative to aggressive. The family of asset allocation indexes can serve as benchmarks to help with target-risk mutual fund selection and evaluation by offering an objective yardstick for performance comparison.
All of the indexes are based on a well-established asset allocation methodology from Ibbotson Associates, a Morningstar company and a leader in the field of asset allocation theory.
The family consists of five indexes covering the following equity risk preferences:
- Aggressive Target Risk
- Moderately Aggressive Target Risk
- Moderate Target Risk
- Moderately Conservative Target Risk
- Conservative Target Risk
The securities selected for the asset allocation indexes are driven by the rules-based indexing methodologies that power Morningstar’s comprehensive index family. Morningstar indexes are specifically designed to be seamless, investable building blocks that deliver pure asset-class exposure. Morningstar indexes cover a global set of stocks, bonds, and commodities.
These global asset allocation models are operated by two of the best-known firms in the investment industry and the leaders in asset allocation and indexing. I believe in rotating between markets to gain exposure to the trends we want rather than a fixed allocation to them, but if I all I was going to do is asset allocation, I would use these.
Now that we know what it is, we can see the year-to-date return under the YTD column and other period returns. All five of the risk models are down YTD. So, it’s safe to say the first six months of 2018 has been challenging for even the most advanced asset allocation.

Below are the most popular U.S. stock indexes. The Dow Jones Industrial Average which gained the most last year is down this year. The Tech heavy NASDAQ and small-cap stocks of the Russell 2000 have gained the most.

The well-known bond indexes are mostly down YTD – even municipal bonds. Rising interest rates and the expectation rates will continue to rise is putting pressure on bond prices.

Morningstar has even more indexes that break bonds down into different fixed-income categories. Longer-term bonds, as expected, are responding most negatively to rising rates. The most conservative investors have the more exposure to these bonds and they are down as much as -5% the past six months. That’s a reason I don’t believe in allocating capital to markets on a fixed basis. I prefer to avoid the red.

Next, we observe the Morningstar style and size categories and sectors. As I wrote in Growth has Stronger Momentum than Value and Sector Trends are Driving Equity Returns, sectors like Technology are driving the Growth style.

International stocks seem to be reacting to the rising U.S. Dollar. As the Dollar rises, it reduced the gain of foreign stocks priced in foreign currency. Although, some of these countries are in negative trends, too. Latin America, for example, was one of the strongest trends last year and has since trended down.

At Shell Capital, we often say that our Global Tactical Rotation® portfolios are a replacement for global asset allocation and the so-called “target date” funds. Target date funds are often used in 401(k) plans as an investment option. They haven’t made much progress so far in 2018.

It is no surprise to see most global markets down or flat in 2018 after such a positive 2017.
But, only time will tell how it all unfolds the rest of the year.
Mike Shell is the Founder and Chief Investment Officer of Shell Capital Management, LLC, and the portfolio manager of ASYMMETRY® Global Tactical.
You can follow ASYMMETRY® Observations by click on on “Get Updates by Email” on the top right or follow us on Twitter.
The observations shared in this material are for general information only and are not intended to provide specific advice or recommendations for any individual. Investing involves risk including the potential loss of principal an investor must be willing to bear. Past performance is no guarantee of future results.

In case you missed it, below are all of the observations we shared this week. When there are more directional trend changes and volatility, I find more asymmetries to write about. That’s because I look at markets through the lens of “what has changed”?
When I observe more divergence between markets and trends, I see more asymmetries to share.
When global markets are just trending up together and quiet, investor sentiment is usually getting complacent, I typically point it out, since that often precedes a changing trend.
All of it is asymmetric observations; directional trends and changes I see with a tilt.
The opposite is symmetry, which is a balance. Symmetry doesn’t interest me enough to mention it.
When buying interest and selling pressure are the same, the price doesn’t move.
When risk equals the return, there is no gain.
When profit equals loss, there is no progress.
In all I do, I’m looking for Asymmetry®.
I want my return to exceed the risk I take to achieve it.
I want my profits to far surpass my losses.
I want my wins to be much greater than my losses.
I want more profit, less loss.
You probably get my drift.
Here are the observations we shared this week:
Growth has Stronger Momentum than Value
https://asymmetryobservations.com/2018/06/25/growth-has-stronger-momentum-than-value/
Sector Trends are Driving Equity Returns
https://asymmetryobservations.com/2018/06/25/sector-trends-are-driving-equity-returns/
Trend Analysis of the Stock Market
https://asymmetryobservations.com/2018/06/25/trend-analysis-of-the-stock-market/
Trend of the International Stock Market
https://asymmetryobservations.com/2018/06/26/trend-of-the-international-stock-market/
Interest Rate Trend and Rate Sensitive Sector Stocks
https://asymmetryobservations.com/2018/06/27/interest-rate-trend-and-rate-sensitive-sector-stocks/
Expected Volatility Stays Elevated in 2018
https://asymmetryobservations.com/2018/06/27/expected-volatility-stays-elevated-in-2018/
Sector ETF Changes: Indexes aren’t so passive
https://asymmetryobservations.com/2018/06/27/sector-etf-changes-indexes-arent-so-passive/
Commodities are trending with better momentum than stocks
Investor sentiment gets more bearish
https://asymmetryobservations.com/2018/06/28/investor-sentiment-gets-more-bearish/
Is it a stock pickers market?
https://asymmetryobservations.com/2018/06/29/is-it-a-stock-pickers-market/

Sometimes the stock market is trending so strongly that the rising tide lifts all boats. No matter what stocks or stock fund you invest in, it goes up. That was the case much of 2017.
Then, there are periods when we see more divergence.
When we observe more divergence, it means stocks, sectors, size, or style has become uncorrelated and are trending apart from each other.
I pointed out in Sector Trends are Driving Equity Returns; there is a notable divergence in sector performance, and that is driving divergence in size and style. Growth stocks have been outperformance value, and it’s driven by strong momentum in Technology and Consumer Discretionary sectors.
When specific sectors are showing stronger relative momentum, we can either focus more on those sectors rather than broad stock index exposure. Or, we can look inside the industry to find the leading individual stocks.
For example, Consumer Discretionary includes industries like automobiles and components, consumer durables, apparel, hotels, restaurants, leisure, media, and retailing are primarily represented in this group. The Index includes Amazon, Home Depot, Walt Disney, and Comcast. Consumer Discretionary is the momentum leader having trended up 9.7% so far this year as the S&P 500 has only gained just under 1%.

If we take a look inside the sector, we see the leaders are diverging farther away from the sector ETF and far beyond the stock market index.

In fact, all the sectors 80 stock holdings are positive in 2018.
The Consumer Discretionary sector is about 13% of the S&P 500. As you can see, if these top four or five sectors in the S&P 500 aren’t trending up it is a drag on the broad stock index.

So, Is it a stock pickers market?
When we see more divergence, it seems to be a better market for “stock pickers” to separate the winners from the losers.
Another way to measure participation in the market is through quantitative breadth indicators. Breadth indicators are a measure of trend direction “participation” of the stocks. For example, the percent of the S&P 500 stocks above or below a moving average is an indication of the momentum of participation.
Below is the percent of stocks above their 50 day moving average tells us how many stocks are trending above their moving average (an uptrend). Right now, the participation is symmetrical; 52% of the stocks in the S&P 500 are in a positive trend as defined by the 50 day moving average. We can also see where that level stands relative to the stock market lows in February and April and the all-time high in January when over 85% of stocks were in an uptrend. By this measure, only half are trending up on a shorter term basis.

The 200-day moving average looks back nearly a year to define the direction of a trend, so it takes a greater move in momentum to get the price above or below it. At this point, the participation is symmetrical; 55% of stocks are above their 200-day moving average and by this time frame, it hasn’t recovered as well from the lows. The percent of stocks above their 200-day moving average is materially below the 85% of stocks that were participating in the uptrend last year. That is, 30% fewer stocks are in longer trend uptrends.

In the above charts, I only showed a one-year look back of the trend. Next, we’ll take a step back to view the current level relative to the past three years.
The percent of stocks above their 50 day moving average is still at the upper range of the past three years. The significant stock market declines in August-September 2015 and December-January hammered the stocks down to a very washed out point. During those market declines, the participation was very asymmetric: 90% of the stocks were in downtrends and only about 10% remained in shorter-term uptrends.

The percent of stocks above their 200 day moving average also shows a much more asymmetrical situation during the declines in 2015 and 2016 when the stock index dropped around -15% or more. Only 20% of stocks remained in a positive trend.

Is it a stock pickers market?
Only about half of the stocks in the index are in uptrends, so the other half isn’t. So, if we avoid the half that are in downtrends and only maintains exposure to stocks in uptrends and the trends continue, we can create alpha.
But, keep in mind, that doesn’t necessarily mean we should have any exposure at all in the S&P 500 stock index because happens to have the highest sector exposure in the leading sectors.
But, for those who want to engage in “stock picking”, the timing has a higher probability now to diverge from the stock index than last year because so fewer stocks are in uptrends and more are in downtrends.
For individual stocks traders willing to look inside the box, this is a good thing.
Mike Shell is the Founder and Chief Investment Officer of Shell Capital Management, LLC, and the portfolio manager of ASYMMETRY® Global Tactical.
You can follow ASYMMETRY® Observations by click on on “Get Updates by Email” on the top right or follow us on Twitter.
The observations shared in this material are for general information only and are not intended to provide specific advice or recommendations for any individual. Investing involves risk including the potential loss of principal an investor must be willing to bear. Past performance is no guarantee of future results.

Commodities are trending with better momentum than stocks over the past year.
A commodity is a raw material or primary agricultural product that can be bought and sold, such as copper or coffee. A commodity is a basic good used in commerce that are usually used as inputs in the production of other goods or services.
Soft commodities are goods that are grown, such as wheat, or rice.
Hard commodities are mined. Examples include gold, helium, and oil.
Energy commodities include electricity, gas, coal, and oil. Electricity has the particular characteristic that it is usually uneconomical to store, and must, therefore, be consumed as soon as it is processed.
The Commodity Trend
At first glance, we see in the chart commodities ETF Invesco DB Commodity Index Tracking ETF has trended meaningfully above the popular S&P 500 index of U. S. stocks. The relative outperformance is clear over this one-year time frame. Commodities, as measured by this ETF, are in an absolute positive trend and registering relative momentum.

Examining a price trend is incomplete without also considering its downside. On the downside, I look at the % off high drawdowns over the period. We see that commodities were more volatile than stocks before 2018 with four dips around -4%. Since the stock market -10% decline that started in February, commodities declined, too, but not as much as U. S. stocks.

Looking back at the trend chart, I added a simple trend line to show that communities are trending directionally better than the popular U. S. stock index. So, my quantitative Global Tactical Rotation® system that ranks an unconstrained global universe of markets including bonds, stocks, commodities, currencies, and other alternatives like real estate signaled this trend has been generating asymmetric risk/return.

What is the that Invesco DB Commodity Index Tracking ETF? (the bold emphasis is mine)
The Invesco DB Commodity Index Tracking Fund seeks to track changes, whether positive or negative, in the level of the DBIQ Optimum Yield Diversified Commodity Index Excess Return™ (DBIQ Opt Yield Diversified Comm Index ER) plus the interest income from the Fund’s holdings of primarily US Treasury securities and money market income less the Fund’s expenses. The Fund is designed for investors who want a cost-effective and convenient way to invest in commodity futures. The Index is a rules-based index composed of futures contracts on 14 of the most heavily traded and important physical commodities in the world. The Fund and the Index are rebalanced and reconstituted annually in November.
This Fund is not suitable for all investors due to the speculative nature of an investment based upon the Fund’s trading which takes place in very volatile markets. Because an investment in futures contracts is volatile, such frequency in the movement in market prices of the underlying futures contracts could cause large losses. Please see “Risk and Other Information” and the Prospectus for additional risk disclosures. Source: Invesco
The challenge for some investors, however, is that Invesco DB Commodity Index Tracking ETF generates a K-1 tax form for tax reporting. That isn’t a terrible issue, but it means instead of receiving the typical 1099 investors receive a K-1. Some investors aren’t familiar with a K-1, and they can obtain them later than a 1099.
Then, there may be other investors who simply prefer not to own futures for the reason in the second paragraph of the above discription: “Because an investment in futures contracts is volatile, such frequency in the movement in market prices of the underlying futures contracts could cause large losses.” In reality, all investments have risk and stocks can have just as much risk of “large losses” as commodity futures, but it’s a matter of investor preference and perception.
Since we have a wide range of investor types who invest in my ASYMMETRY® Investment Program I could gain my exposure to commodities in other ways. For example, the SPDR® S&P® Global Natural Resources ETF often has a similar return stream as ETFs like DBC that track a commodity futures index, except is actually invests in individual stocks instead.
Key features of the SPDR® S&P® Global Natural Resources ETF
The SPDR® S&P® Global Natural Resources ETF seeks to provide investment results that, before fees and expenses, correspond generally to the total return performance of the S&P® Global Natural Resources Index (the “Index”)
Seeks to provide exposure to a number of the largest market cap securities in three natural resources sectors – agriculture, energy, and metals and mining
Maximum weight of each sub-index is capped at one-third of the total weight of the Index
Below we see the price trend of this ETF of global natural resources stocks has been highly correlated to an ETF of commodities futures.

In fact, as we step the time frame out to the common inspection date of each ETF in 2011, the SPDR® S&P® Global Natural Resources ETF has actually outperformed Invesco DB Commodity Index Tracking ETF overall in terms of relative momentum.

ETFs are subject to risk similar to those of stocks including those regarding short-selling and margin account maintenance. Ordinary brokerage commissions apply. In general, ETFs can be expected to move up or down in value with the value of the applicable index. Although ETF shares may be bought and sold on the exchange through any brokerage account, ETF shares are not individually redeemable from the Fund. Investors may acquire ETFs and tender them for redemption through the Fund in Creation Unit Aggregations only. Please see the prospectus for more details. After-tax returns are calculated based on NAV using the historical highest individual federal marginal income tax rates and do not reflect the impact of state and local taxes. Actual after-tax returns depend on the investor’s tax situation and may differ from those shown. The after-tax returns shown are not relevant to investors who hold their fund shares through tax-deferred arrangements such as 401(k) plans or individual retirement accounts. Performance of an index is not illustrative of any particular investment. It is not possible to invest directly in an index. As with all stocks, you may be required to deposit more money or securities into your margin account if the equity, including the amount attributable to your ETF shares, declines. Unless otherwise noted all information contained herein is that of the SPDR S&P Global Natural Resources ETF. S&P – In net total return indices, the dividends are reinvested after the deduction of withholding tax. Tax rates are applied at the country level or at the index level.

In late 2017, implied volatility, as measured by the VIX CBOE Volatility Index, was at abnormally low levels. I pointed out many times that vol is mean reverting, so when expected volatility is extremely low we can expect it to eventually reverse. The VIX spiked up over 200% in February and has remained more elevated than before.

In the chart, I used a 50-day moving average for observation of how the VIX has remained more elevated than pre-February.
Volatility is asymmetric; when the stock market falls, implied volatility tends to spike up.
The VIX long-term average is 20, so the current level of 15-16 still isn’t high by historical measures, but the expected volatility is elevated above where it was.
Below is the VIX so far in 2018 in percentage terms. It shows the 200% gain that has since settled down, but it’s remaining higher than before.

The VIX has spiked up 45% the past 5 days.

As I shared in The enthusiasm to sell overwhelmed the desire to buy March 19, 2018, I expect to see more swings (volatility) than last year, and that would be “normal” too. I said:
I define this as a non-trending market. When I factor in how the range of price movement has spread out more than double what it was, I call it a non-trending volatile condition.
Until we see either a new all-time high indicating a continuing longer-term uptrend or a new low below the February and April low indicating a new downtrend, the above holds true.
It’s a good time for a VIX primer from the CBOE:
What does it mean?
Some consider the VIX the “fear gauge”. When there is a demand for options, their premiums rise. Investor demand for options typically increases when they are concerned about the future, so they use options to hedge or replace their stocks with limited risk options strategies. Rising volatility also drives the VIX, since the VIX Index is a calculation designed to produce a measure of constant, 30-day expected volatility of the U.S. stock market, derived from real-time, mid-quote prices of S&P 500® Index
What is volatility?
Volatility measures the frequency and magnitude of price movements, both up and down, that a financial instrument experiences over a certain period of time. The more dramatic the price swings in that instrument, the higher the level of volatility. Volatility can be measured using actual historical price changes (realized volatility) or it can be a measure of expected future volatility that is implied by option prices. The VIX Index is a measure of expected future volatility.
What is the VIX Index?
Cboe Global Markets revolutionized investing with the creation of the Cboe Volatility Index® (VIX® Index), the first benchmark index to measure the market’s expectation of future volatility. The VIX Index is based on options of the S&P 500® Index, considered the leading indicator of the broad U.S. stock market. The VIX Index is recognized as the world’s premier gauge of U.S. equity market volatility.
How is the VIX Index calculated?
The VIX Index estimates expected volatility by aggregating the weighted prices of S&P 500 Index (SPXSM) puts and calls over a wide range of strike prices. Specifically, the prices used to calculate VIX Index values are midpoints of real-time SPX option bid/ask price quotations.
How is the VIX Index used?
The VIX Index is used as a barometer for market uncertainty, providing market participants and observers with a measure of constant, 30-day expected volatility of the broad U.S. stock market. The VIX Index is not directly tradable, but the VIX methodology provides a script for replicating volatility exposure with a portfolio of SPX options, a key innovation that led to the creation of tradable VIX futures and options.
To learn more about the CBOE, Volatility Index VIX visit their VIX website.
Mike Shell is the Founder and Chief Investment Officer of Shell Capital Management, LLC, and the portfolio manager of ASYMMETRY® Global Tactical.
You can follow ASYMMETRY® Observations by click on on “Get Updates by Email” on the top right or follow us on Twitter.
The observations shared in this material are for general information only and are not intended to provide specific advice or recommendations for any individual. Investing involves risk including the potential loss of principal an investor must be willing to bear. Past performance is no guarantee of future results.
The enthusiasm to sell overwhelmed the desire to buy. The S&P 500 stock index closed down -1.42% today. Stocks trended down most of the day and at 2:35pm it was down -2%. As you can see on the chart, it reversed up in the last 90 minutes and closed with positive directional movement. It almost closed above its Volume Weighted Average Price (VWAP).

There are many notable economic reports out this week, so maybe investors are concerned about to the jobs report and the Fed FOMC Meeting. The options market has priced in a 94% chance of a rate hike, so it shouldn’t be a surprise. But, this week is the first FOMC meeting for the new Chairman Powell.
Implied volatility in recent weeks is one of many signals that suggest a volatility regime change. The CBOE Volatility Index® (VIX® Index®) is a key measure of market expectations of near-term volatility conveyed by S&P 500 stock index option prices. The VIX® doesn’t seem to want to go back to those prior low levels, so the expectation is higher volatlity.

At this point, the decline today was nothing too abnormal. The stock index is -3.% off it’s high a few weeks ago and -5.4% off its all-time high. However, as you can see below it is within a normal trading range. Speaking of trading range, notice the bands of realized volatility I added to the chart are drifting sideways rather than trending up or down. I see higher lows, but equal highs in the most recent trend and lower highs looking back to January. The VIX is expected volatility, the blue bands are realized volatility.

My systems define this as a non-trending market. When I factor in how the range of price movement has spread out more than double what it was, I call it a non-trending volatile condition. It is useful for me to identify the market regime because different trend systems have different results based on the situation. For example, non-trending volatile market conditions can be hostile situations for both passive and trend following strategies. However, countertrend systems like the swings of a non-trending volatile market.
Trend following systems thrive in markets that are trending and smooth. When a market is trending and smooth, the trend following system can earn gains without having to deal with significant adverse price action. When a market trend shifts to non-trending and volatile, the trend following signals can result in whipsaws. A whipsaw is when the price was moving in one direction (and the trend follower buys) but then quickly reverses in the opposite direction (and maybe the trend follower exits with a loss). Even if the trend following system doesn’t enter and exit with a loss, in a non-trending volatile market the trend follower has to deal with the same hostile conditions as a passive investor as the market swings up and down.
My U. S. equity exposure since early February has come from my shorter term countertrend systems. My focus and the focus of my systems isn’t to predict the direction of markets but instead to identify when a market is undergoing a regime change or shifts to a distinct environment. I don’t analyze the markets to try to predict what it will do next. I look at what the market is actually doing and react to it.
Mike Shell is the founder and Chief Investment Officer of Shell Capital Management, LLC, and the portfolio manager of ASYMMETRY® Global Tactical.
You can follow ASYMMETRY® Observations by click on on “Get Updates by Email” on the top right or follow us on Twitter @MikeWShell
The is no guarantee that any strategy will meet its objective. Past performance is no guarantee of future results.
About a week after a hedge fund manager who is popular with the media but has a poor track record of managing risk said “please stop talking about the low VIX”, it gains 44.4% in a single day – its 9th biggest 1-day move. He was suggesting the low VIX wasn’t an indication of high risk. If you have followed my observations, you know that I disagree. I’m one who has been talking about the low VIX and suggesting it is one of many indications of complacency among investors. That is, investors hear “all time new highs” and get overly optimistic instead of reducing their risk or being prepared to manage downside loss.

I point out the hedge fund manager’s comment because I believe a low VIX is an indication of complacency because it measures expected implied volatility for options on the S&P 500 stocks. When implied volatility gets to historical low points, it means options traders aren’t paying high premiums for hedging “protection”. Others can believe what they want to believe. I don’t just point out observations at extremes. I actually do something.
As I pointed out recently in “No Inflection Point Yet, But… ” the VIX was at an extreme low. About a week later this other fund manager implies it may not be meaningful. That’s exactly what we expect to hear when the expected volatility gets to such an extreme low. We expect to see it shift the other direction at some point. I like to follow trends until they reach an extreme – and reverse.
Here is what it looked like.

More importantly, here is what the stock indexes looked like on Google Finance after the close:

Another observation I shared in “No Inflection Point Yet, But…” is that leading stocks can sometimes be more volatile and yesterday was no exception. While the stock indexes were down around -1.5% some of the most popular stocks were down about twice as much:
 Source: Google Finance
Of course, this is all just one day. We’ll see if it continues into a longer trend.
It’s always a good time to manage risk, but sometimes it’s more obvious than others.
You must be logged in to post a comment.