During the waterfall decline in March 2020, the Cboe S&P 500 5% Put Protection IndexSM (PPUT) successfully hedged off stock market beta, but it hasn’t done the same in 2022.
The green highlight shows the Cboe S&P 500 5% Put Protection IndexSM in black and S&P 500 stock index in red. Clearly, the systematic put protection index helped to hedge off downside risk in the SPX during the waterfall decline of March 2020, but that same hedge hasn’t protected long beta portfolios in 2022.
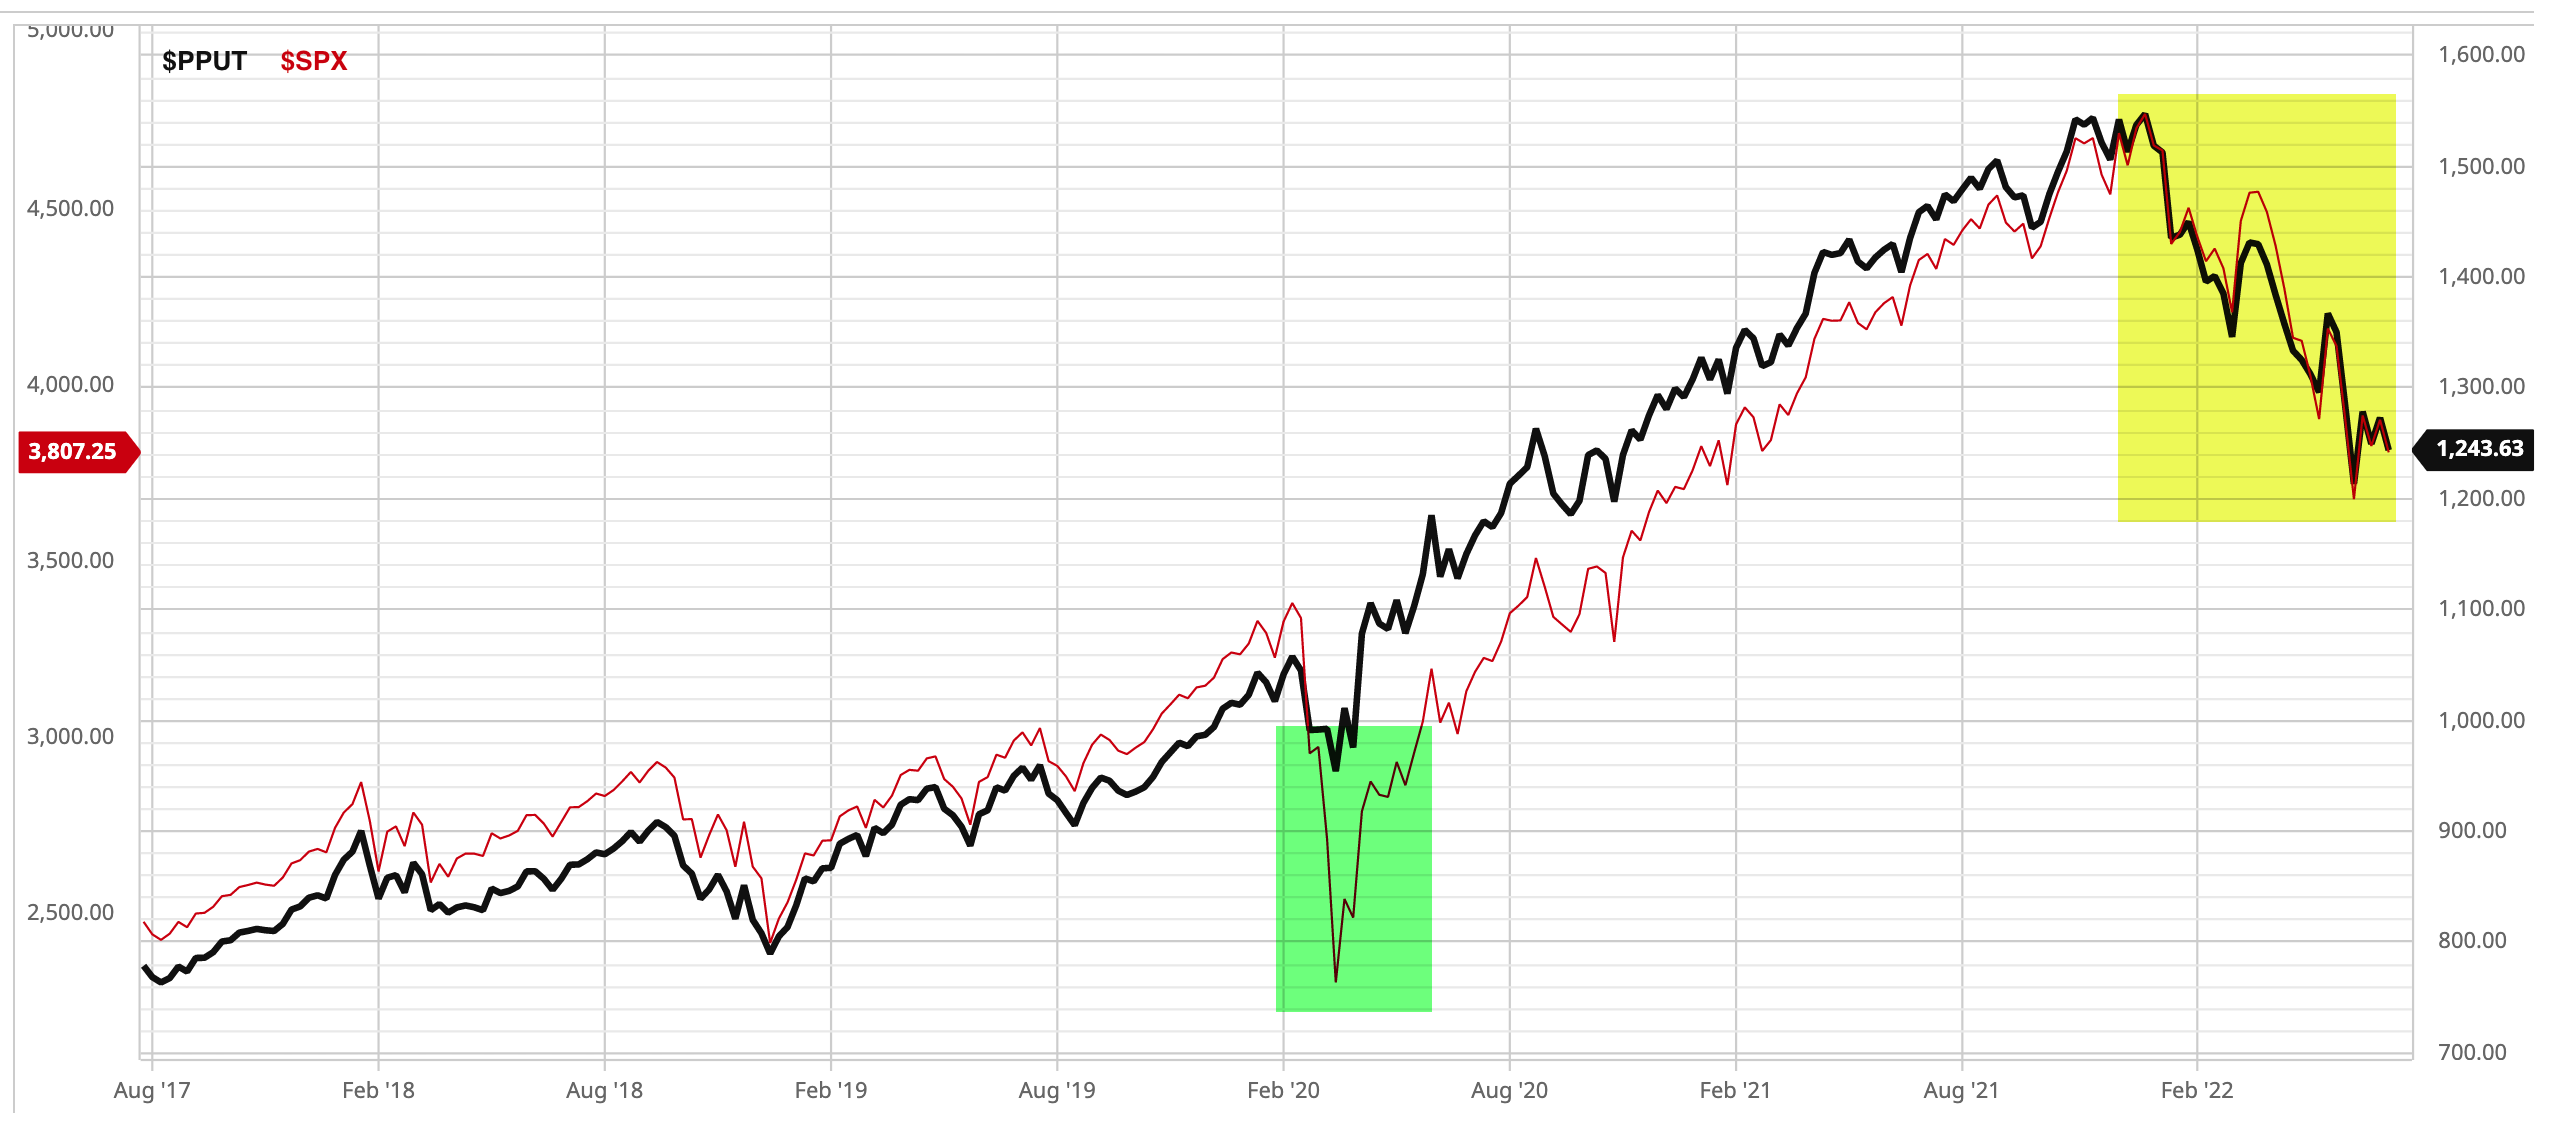
Cboe S&P 500 5% Put Protection IndexSM (PPUT) tracks the value of a hypothetical portfolio of securities (PPUT portfolio) designed to protect an investor from negative S&P 500 returns. The PPUT portfolio is composed of S&P 500® stocks and of a long position in a one-month 5% out-of-the-money put option on the S&P 500 (SPX put).
Let’s see what happened over these two very different outcomes, and I’ll share my observations of what changed that impacted the outcomes.
Using data from YCharts, we see the full year 2020 in the chart comparing the S&P 500 Total Return Index (SPX) to the Cboe S&P 500 5% Put Protection IndexSM (PPUT) which is long the SPX, but adds one-month 5% out-of-the-money put option on the S&P 500 (SPX puts) options to hedge.
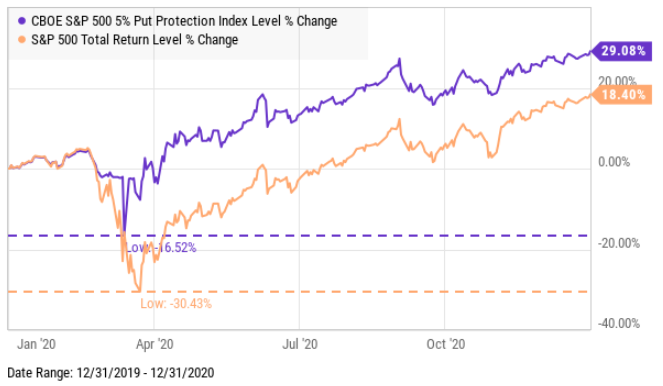
For the systematic put hedge strategy, 2020 was a fine example of risk management resulting in not only drawdown control, but also how avoiding large losses can increase the portfolio return in some conditions.
The S&P 500 declined over -30% around March 2020 as COVID spread, but the 5% SPX put lowered the drawdown to -16.52%.
That’s asymmetry and a key part of creating asymmetric investment returns.
The 5% put hedging strategy limited the downside by 50%, then went on to allow the long-only exposure to the S&P 500 to nearly double the stock index.
This is what I look for in the pursuit of asymmetric payoffs to produce asymmetric returns.
Naturally, the incredible performance of this very simple systematic hedging strategy tracked by PPUT got some attention after it performed so well. But, no method is perfect, and all strategies are fallible.
Fast forward to 2022, and the outcome has been completely different. Investors and traders who relied on a 5% monthly put option have fully participated in the downside of the SPX this year.

This phenomenon has driven many to ask, why such a radically different outcome?
I’ll attempt to explain my observations as succinctly as possible because understanding derivatives like options is the most complex task in the capital markets for most people.
For more than two decades, I’ve focused on alternative trading strategies in pursuit of asymmetric payoffs that lead to asymmetric investment returns.
Asymmetry isn’t just about finding low-risk positions that offer a higher expected payoff, like a 2-to-1 reward to risk.
Instead, asymmetry is even more focused on limiting the downside in hopes to avoid the negative asymmetry of loss.
Losses compound against us exponentially the deeper we allow losses to get.
So, my focus has been actively trading momentum growth stocks, tactically trading more systematically a global universe of ETFs, and volatility trading/hedging, all of which are unconstrained in my primary portfolio.
So, I have a unique perspective on this topic.
The short and sweet answer to why this time was so different than 2020 is a function of these issues.
- During the waterfall decline of March 2020, prices spread out (to the downside) very quickly. It was one of the sharpest waterfalls in history. When prices spread out, I call it a volatility expansion, and rising vol increases the premium for options. For the same reason, the VIX spiked to > 80 in March 2020, but it’s been constrained under 40 so far in 2022.
- This year, the stock indices have declined over -20%, but it’s been a much slower grind down. SPX is down about -20% over six months instead of down over -30% in three weeks. The speed of prices spreading out is volatility, and volatility is a significant driver of option premiums. Think of it this way: home insurance in Florida is expected to be cheaper before a catastrophic hurricane when people are complacent than after the hurricane does its damage. The good news is, that options pricing allows for better timing of relative value if you have a system for it.
- Another difference is the luck of roll and expiration dates for this systematic strategy that executes about every 30 days. My friend Russell Rhoads, who is one of the most well-known VIX experts, pointed out to me that the ability to use a series that expires on days that don’t contribute to the VIX calculation would have been helpful this year. That is, the systematic strategy of buying 30-day SPX put options has the potential to fall on days that aren’t efficient. The roll is a risk.
- Finally, we believe most institutional money managers were already hedged. This has been a long drawn-out decline, a lower vol downtrend, so it’s given time for money managers to add protection, so demand for puts hasn’t been a spike, but instead more methodical.
The bottom line is the asymmetric volatility phenomenon has impacted the put option hedging strategy.
The asymmetric volatility phenomenon suggests that prices trend down faster and sharper than they trend up, which can be an advantage of put option hedging, or a disadvantage when it’s calmer like this year.
All of the above has also kept the VIX below 40 this year.
Mike Shell is the Founder and Chief Investment Officer of Shell Capital Management, LLC, and the portfolio manager of ASYMMETRY® Managed Portfolios. Mike Shell and Shell Capital Management, LLC is a registered investment advisor focused on asymmetric risk-reward and absolute return strategies and provides investment advice and portfolio management only to clients with a signed and executed investment management agreement. The observations shared on this website are for general information only and should not be construed as investment advice to buy or sell any security. This information does not suggest in any way that any graph, chart, or formula offered can solely guide an investor as to which securities to buy or sell, or when to buy or sell them. Securities reflected are not intended to represent any client holdings or recommendations made by the firm. In the event any past specific recommendations are referred to inadvertently, a list of all recommendations made by the company within at least the prior one-year period may be furnished upon request. It should not be assumed that recommendations made in the future will be profitable or will equal the performance of the securities on the list. Any opinions expressed may change as subsequent conditions change. Please do not make any investment decisions based on such information, as it is not advice and is subject to change without notice. Investing involves risk, including the potential loss of principal an investor must be willing to bear. Past performance is no guarantee of future results. All information and data are deemed reliable but are not guaranteed and should be independently verified. The presence of this website on the Internet shall in no direct or indirect way raise an implication that Shell Capital Management, LLC is offering to sell or soliciting to sell advisory services to residents of any state in which the firm is not registered as an investment advisor. The views and opinions expressed in ASYMMETRY® Observations are those of the authors and do not necessarily reflect the position of Shell Capital Management, LLC. The use of this website is subject to its terms and conditions.

You must be logged in to post a comment.