It can be interesting to revisit previous observations to see what has changed. The last time I shared an observation about the overall state of the stock market was “Is this the Inflection Point for Stocks?” written on April 28th. I shared a few observations of the actual market trend and then some indicators that may give warning of an inflection point. Understanding the market state is an examination of the weight of the evidence. At that time, the weight of the evidence seemed to suggested defense. We’ll see if that is the case today.
I make it clear to follow the actual trend itself. For me, there is no better indication of what I really believe than my actual positions and exposures to the markets. Writing an observation about the market state is one thing, what we actually do is our reality. I am a portfolio manager, not a market commentator, so I make no bones about it. For a portfolio manager, market and portfolio commentary is not necessary.
On the last day of April, I said:
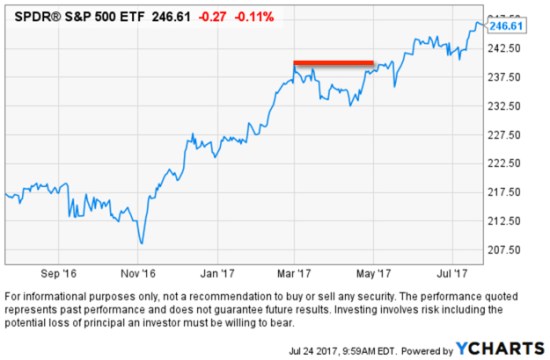
My first indicator is always the actual price trend itself. If we want to know what is going on, there is no better observation than the actual price trend. The price action tells us what force is in control: supply or demand. And, we can see the potential for the inflection point – when the direction is changing. In the chart below, I highlight a recent point of “resistance”. I call it resistance because the stock index hasn’t broken above the March high and is instead drifting sideways.
What has changed?
Here is what I said at the end of April:
Investors sometimes assume a prior price high will automatically become “resistance” just because it’s the price range they expect to see the price trend stall. Resistance is the price level where selling is expected to be strong enough to prevent the price from rising further. We can see that recently in the chart. As the price advances towards the prior peak, supply may overcome demand and prevent the price from rising above resistance. For example, it may be driven by investors who wished they had sold near the prior peak and had to wait as the price recovered again. They anchor to that prior high. Once it gets back to the prior peak, they exit. Prior highs don’t always become “resistance” as expected. Sometimes demand is strong enough to break through and keep trending up. At this point, we see there has been some resistance at the prior high. I highlighted it in yellow in the chart above. So, we shouldn’t be surprised to see the price decline if this resistance holds for a while. Or, it could be an inflection point.
Below is the chart of what actually happened. The red line marked the potential for resistance I spoke of. The S&P 500 stock index did decline about -2% since then, twice, but overall it has trended up with higher highs and higher lows. That is, it broke above what I said could have become resistance. As I said, that’s the thing about trend concepts like support and resistance – they don’t exist until they do. At this point, the stock index is near its all-time high with no previous high that could act as “resistance”. As we’ll see, such headlines make investors very optimistic as people tend to extrapolate the recent past into the future.
I had also pointed out the directional trend of the small company stock index. I said:
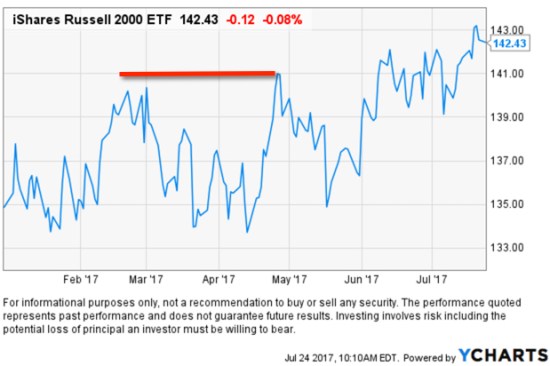
The S&P 500 stock index is mainly large companies. Smaller companies tend to lead larger companies. Their price trends move in a wider range and they sometimes move faster, so they get to a point sooner. That’s why we say small company stocks “lead” large company stocks. In that case, I highlight below that the small company stock index, the S&P 600 Small Cap ETF, reached its prior, but found resistance and reversed down. The soldiers may lead the way for the Generals.
What has changed?
Below I marked the red line in the same place as the end of April. As you can see, since then, smaller stocks indeed continued to move in a wider range, but though they have been more volatile. they have trended to slightly higher highs. At this point, this index is also at its all-time high, a headline that makes investors optimistic.
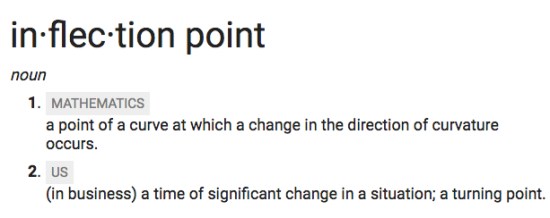
This is a good time to remind ourselves of the definition of an inflection point. You see, we want to go with the flow of what is, but, we may also want to apply some situational awareness of the current state so we aren’t surprised when things change.
I went on to say:
As I continue sharing some observations, I’m going to get farther away from my main decision maker which is the directional price trend, but you’ll see how these indicators help to quantify the state of the trend and the potential for an inflection point. As we keep going, keep in mind that indicators are a derivative of the price at best or a derivate of something unrelated to the directional price trend. In the case of the VIX® Index index above, it’s a measure of options (a derivative) on the stocks in the S&P 500. When we start looking at things like economic growth and valuations we are necessarily looking at things that are a derivative of price, but not as absolute as the price trend itself. The direction of the price trend is the arbiter.
At the end of April, I pointed out:
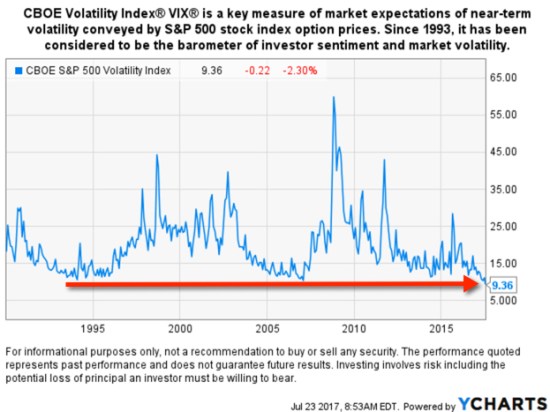
It seems that the stock index is stalling at a time when investors are complacent. When investors are complacent or overly optimistic an inflection point is more likely. The CBOE Volatility Index® (VIX® Index) is very low. The CBOE Volatility Index® (VIX® Index®) is a key measure of market expectations of near-term volatility conveyed by S&P 500 stock index option prices. The VIX® historically trends between a long-term range. When the VIX® gets to an extreme, it becomes more likely to eventually reverse. In the chart below I show the price level of the VIX® since its inception in 1993. We can see its long-term average is around 20. I highlighted in red its low range is around 12 and it has historically spiked as high as 25 or 60. This means the traders of options are expecting lower volatility in the weeks ahead at a time when other things seem to suggest otherwise.
What has changed?
The CBOE Volatility Index® (VIX® Index) actually spiked up 55% in May but since has declined to its all time low.
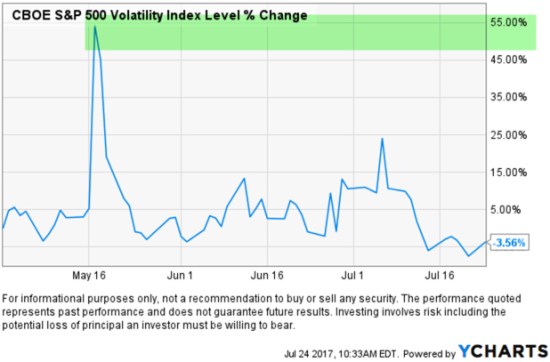
The VIX® is now at a historically low point, suggesting that investors may be unusually complacent. Such low levels of expected future volatility tend to proceed market tops, declining markets, and rising volatility.
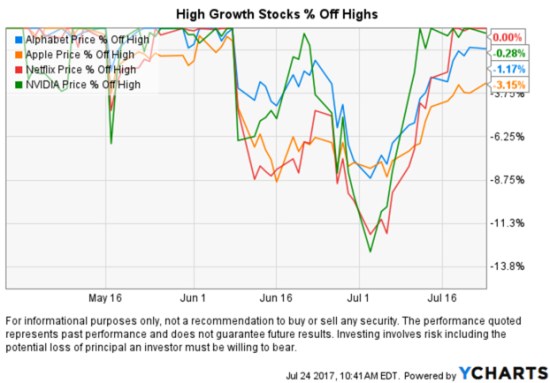
When volatility spiked, the stock indexes only dropped -2% to -4%. However, some of the most popular growth stocks in the technology sector declined much more creating a short term trading opportunity for those of us willing to manage our risk. These have been the leading stocks, so when they decline more than broad market indexes it’s an indication of the overall risk level. Eventually, these short downtrends may continue to deeper drawdowns, so drawdown control is essential.
I also mentioned on April 28th that the following Monday was the beginning of May, a seasonally weak period. Specifically, I said:
I’m not a huge fan of using seasonality as an indicator to enter or exit the stock market, but there is some tendency for certain periods to gain or lose value historically. For example, a common seasonality is “Sell in May and go away”. Depending on the historical time frame you look and which index, some periods show a “summer slump”. One theory is many investors and traders go on vacation in the summer, so volume is light. They return after the summer and take more action.
While I certainly don’t use “Sell in May and go away” as a trading indicator, we usually do see a “summer slump” at some point. We haven’t seen that, yet, so we shouldn’t be surprised if we do.
Aside from the historically low VIX® the other warning sign is the current valuation of the stock indexes. As the stock indexes are gradually making higher highs which seems to be leading to investor complacency, it comes at a time when stocks are “significantly overvalued”, according to my friend Ed Easterling in Crestmont Research Stock PE Report July 2017:
CURRENT STATUS (Second Quarter 2017) In the second quarter, the stock market added 2.9% for a cumulative 8.2% gain in the first half, well more than underlying economic growth. As a result, normalized P/E increased to 29.8—significantly above the level justified by low inflation and low interest rates. The current status remains “significantly overvalued.”
There are no perfect indicators; it’s all about the weight of the evidence. What we do know is this is a very aged old bull market that has now lasted eight years. Historically, bull markets have lasted 4 – 5 years. We also know the most astute fundamental analyst, Crestmont warns that the current status remains “significantly overvalued.” As to be expected, as the primary stock trend continues up, investors are getting more and more complacent expecting the trend to continue. The same investors who got caught in the loss trap last time are likely to get caught again.
Eventually, there will be an inflection point. The higher and more overvalued a market becomes the more significant the inflection point may be.
We’ll see how it all plays out.
Mike Shell is the Founder and Chief Investment Officer of Shell Capital Management, LLC and the portfolio manager of ASYMMETRY® Global Tactical.

Pingback: VIX Trends Up 9th Biggest 1-day Move « ASYMMETRY® Observations