I want to share a secret with you about unrelated nonsense

I want to share a secret with you.

Take a close look at this map and think about each of these states.

US Map Rug Rectangle 36" X 80" | Classroom Map Rug

What you see on TV, in the news, doesn’t necessarily reflect the beliefs of all of us.

Do you think they have the same concerns in Montana as New York City?

Do Tennesseans really care what they think in Los Angeles?

Does someone living in the Florida Keys need to be told by people in Minnesota how to live their life?

Successful people, especially wealthy people who we advise, focus on what’s inside their own boat.

Where are you getting the information you feed your mind?

Because the algorithm is very simple;

Garbage in, garbage out.

That is all.

Make it a great day.

Don’t miss out! Stay informed and sign up for an email of new ASYMMETRY® Observations, including some that may not be posted here.

Join 39,466 other followers

Mike Shell is the Founder and Chief Investment Officer of Shell Capital Management, LLC, and the portfolio manager of ASYMMETRY® Global TacticalMike Shell and Shell Capital Management, LLC is a registered investment advisor focused on asymmetric risk-reward and absolute return strategies and provides investment advice and portfolio management only to clients with a signed and executed investment management agreement. The observations shared on this website are for general information only and should not be construed as advice to buy or sell any security. Securities reflected are not intended to represent any client holdings or any recommendations made by the firm. Any opinions expressed may change as subsequent conditions change.  Do not make any investment decisions based on such information as it is subject to change. Investing involves risk, including the potential loss of principal an investor must be willing to bear. Past performance is no guarantee of future results. All information and data are deemed reliable but is not guaranteed and should be independently verified. The presence of this website on the Internet shall in no direct or indirect way raise an implication that Shell Capital Management, LLC is offering to sell or soliciting to sell advisory services to residents of any state in which the firm is not registered as an investment advisor. The views and opinions expressed in ASYMMETRY® Observations are those of the authors and do not necessarily reflect a position of  Shell Capital Management, LLC. The use of this website is subject to its terms and conditions.

Everything is Relative: Florida COVID – 19 Trend Update

“It doesn’t matter what we think about a trend, it matters what the crowd thinks about it, but more importantly, how they will respond to it.”

– Mike Shell

For a quick update on the Coronavirus COVID – 19 trend, I’ll use my home state of Florida as the example.

The first cases of Coronavirus (COVID-19) were confirmed on March 1st, 2020, which occurred in Manatee and Hillsborough County. During the initial outbreak of Coronavirus in the United States, Florida’s public beaches and theme parks were under scrutiny as being areas of large crowds. Some in the news media criticized Florida for being relatively late in issuing a “Shelter-At-Home” order, finally putting it in place beginning April 3rd, 2020. Cases ramped quickly from 2 on March 4th, to over 5000 by the end of the month. Since then, however, the number of cases in Florida has leveled off, slowing the rate of change.

I focus on the direction of the trend and its rate of change.

The COVID Tracking Project has now tracked 85,826 cumulative Florida Coronavirus cases , up from 82,719 Thursday. This is a change of 3.88%. Here, I show the standard arithmetic scale on the chart.

The concern I see in the above chart is it seems to be forming a rough S-shaped curve. That is, cases trended up though April and May around the same pace, but this month the rate of change is notably stronger in the  linear price scale of an arithmetic chart. The arithmetic or linear chart doesn’t illustrate or scale movements in relation to their percent change, but instead, the linear price scale plots price level changes with each unit change according to a constant unit value. So, there is an equal distance between the data points as each unit of a change on the chart is represented by the same movement up the scale, vertical distance, regardless of what the level when the change happened. The arithmetic chart is the standard basic chart, especially over shorter time series, and it shows absolute trends.

To see how the time series unfolds with a focus on percentage of change, we changed the scale to logarithmic. The logarithmic chart is plotted so that two equal percent changes are plotted as the same vertical distance on the scale. Logarithmic scales are better than linear scales for normalizing less severe increases or decreases. Applying a logarithmic scale, the vertical distance between the data on the scale the percent change, so we can better identify changes in rates of change. Here, we see a strong uptrend in March, then the rate of change has since leveled off. The trouble, however, is it is still trending up and at its high.

Florida Coronavirus Tests Administered is at a current level of 1.5 million, which up from 1.486 million the day before, an increase of 1.72%.

COIVD – 19 Deaths have increased 1.4% since Thursday. Deaths are obviously an essential factor to track. Florida Coronavirus Deaths is at a current level of 3,154.00, up from 3,110.00 yesterday.

The steep uptrend in deaths is scary looking using the arithmetic scale showing the absolute trend in cumulative deaths. In the next chart, we observe the same trend as a log scale, which shows the rate of change is in an uptend, but has been slowing. I labeled the highest high (now) and the average over the period for reference.

Florida Coronavirus Hospitalizations is at 12,862, up from 12,673 the prior day, which is a change of 1.49%. To focus on the rate of change, here is the log scale chart.

Keep in mind, my objective here isn’t to rehash the research of others, but instead to share what I see in the trends and rates of change. As such, this isn’t a complete analysis of the virus. It’s my observations, as a quant and trend system developer and operator. The data source is The COVID Tracking Project which can only report the data as provided by the states.

ZOOMING IN TO PER DAY

The per day trends are important if we want to spot a change in trend quickly. As I warned in “In addition to the equity markets entering a higher risk level of a drawdown and volatility expansion, we now have a renewed risk of the scary COVID narrative driving more fear” a week ago, the uptrend got some attention last week. It doesn’t matter what we think about a trend, it matters what the crowd thinks about it, but more importantly, how they will respond to it.

The uptrend in Florida Coronavirus cases per day has indeed continued and with a notable new high.

I don’t like to see an uptrend like this because it’s a virus, and viruses are contagious, so they spread. In the case of Coronavirus, we can get an idea of the speed and rate of spread by the reproductive number (R0), or ‘R-naught’, represents the number of new infections estimated to stem from a single case. The reproductive number (R0) is relatively high, according to a research paper on the CDC: Assuming a serial interval of 6–9 days, we calculated a median R0 value of 5.7 (95% CI 3.8–8.9). 

I’m not going into the details here, but, with a reproductive value of 5.7, an increase in new cases is material in my opinion. That is, once it trends up as we are seeing now, it seems more likely to continue.

Are new cases a function of increased testing?

Some say the increase in new cases per day is a result of more testing. That doesn’t seem to be the case. Below is a charge of cases per day with a time series of tests administered per day under it. Visually, we see no correlation. However, there are many caveats to the data. So, anyone who wants to make a cased leaning one way or another can find ways to skew it, but it is what it is. We have a material increase in cases in Florida.

QUANTIATIVE ANALYTICS

Now, we’ll take a deeper dive and apply some analytics to the trends by observing some ratios.

The Florida COVID – 19 Death Rate has been gradually trending down. Florida Coronavirus Death Rate is at 3.67%.

In the past two weeks of May, the death rate was 4.6%, so it is falling.

In our investment management, I’ve been drawing ratio charts for over two decades to determine which market or stocks has greater trend momentum than another. When the numerator (top) is trending stronger than the denominator (bottom value) we say it has stronger relative strength or momentum. In this case, I have used Florida Coronavirus Cases Per Day as the numerator (top value) and Florida Coronavirus Tests Per Day as the denominator (bottom value), which shows a clear uptrend in the cases per day relative to the tests per day. This concerns me because of the rate of spread. As you look at the ratio chart, consider that a value of 0 would mean new cases per day is the same as new tests per day. Instead, new cases is currently trending higher than testing.

Florida cumulative cases relative to tests administered is also showing some change in trend. the past few weeks. Again, not of the date collected is perfect, but it’s still representative of a statistically significant sample of the population.

My objective for trend following is to identify a trend early in its stage to capitalize on it until it changes.

Comparing per day cases to other states doesn’t mean a lot, since the data needs to be normalized. For example, what President Trump said a few weeks ago is a true statement: the number of cases are a function of testing. If we didn’t test and didn’t categorize a case as COVID, there would be no “COVID cases.” Some people, politically motivated, seem to have difficult understanding that simple statement. I’m not politically motivated, so I just say it like it is. With that said, California is winning the match of the most cases per day followed by Texas. Florida is above Arizona.

Again, this doesn’t tell us anything aside from the absolute number. A relative comparison is often necessary and this is an example. For example, we could first calculate per day cases relative to tests or population, then compare them. That’s beyond the scope of my objective today.

Here are the states that reported over 500 new cases. We are seeing some large bubbles in the southwestern United States right now.

Image

The bottom line is, we want to see these levels drifting down, not up. We want to see this trend down.

People who are at high risk should continue to operate according to the risks, but also keep it in perspective that at this point, it isn’t yet so wide spread.

In the big picture, the population in Florida is 22 million and about 86 thousand cases have been labeled COVID 19. 86,0000 out of 22 million is about 4 tenths of a percent, or 0.40%.

That’s 40 cents of $100.

Our changes of contracting COVID 19 in Florida, then, is less than half of 1% at this point.

Everything is relative.

Join 39,466 other followers

Mike Shell is the Founder and Chief Investment Officer of Shell Capital Management, LLC, and the portfolio manager of ASYMMETRY® Global TacticalMike Shell and Shell Capital Management, LLC is a registered investment advisor focused on asymmetric risk-reward and absolute return strategies and provides investment advice and portfolio management only to clients with a signed and executed investment management agreement. The observations shared on this website are for general information only and should not be construed as advice to buy or sell any security. Securities reflected are not intended to represent any client holdings or any recommendations made by the firm. Any opinions expressed may change as subsequent conditions change.  Do not make any investment decisions based on such information as it is subject to change. Investing involves risk, including the potential loss of principal an investor must be willing to bear. Past performance is no guarantee of future results. All information and data are deemed reliable but is not guaranteed and should be independently verified. The presence of this website on the Internet shall in no direct or indirect way raise an implication that Shell Capital Management, LLC is offering to sell or soliciting to sell advisory services to residents of any state in which the firm is not registered as an investment advisor. The views and opinions expressed in ASYMMETRY® Observations are those of the authors and do not necessarily reflect a position of  Shell Capital Management, LLC. The use of this website is subject to its terms and conditions.

What trends are driving emerging markets into a bear market?

In Emerging Markets Reached a Bear Market Level we noted the emerging markets index has declined -20%, which is considered to be in bear market territory. The emerging markets index includes 24 countries classified as emerging countries.

To see the country exposure, we examine the iShares MSCI Emerging Markets ETF holdings. China is about 31%, South Korea is about 15%, Taiwan is over 12%, so the top three countries make up 58% of the country exposure. Add India at 10% and the top four countries is a dominant 68% of the exposure. Clearly, we’d expect the drift of these top holdings to dominate the trend.

what countries are emering markets ETF ETFs

Below we see the 2018 price trends of the emerging markets ETF and the top four countries that make up 68% of the emerging markets index ETF exposure. We see that South Korea and China are the primary downtrends that are trending close to the emerging markets index ETF. Taiwan and India have stronger relative momentum.

emerging markets $EEM china $FXI india south korea 2018 trend

To get a better understanding of what is driving the downtrend, we draw the % off high charts to see the drawdowns. From this observation, we can see what is really driving the trend. Of the top four countries in the index, the negative momentum of China and South Korea are driving the trend down. China is down -24% over the past year as South Korea is down -17%.

emerging market ETF trends

Taiwan and India have stronger relative momentum since they have trended up more recently since July. Prior to July, they were trending closer to China and South Korea.

You can probably see why I include the individual countries in my global universe rather than just the broad emerging markets index ETF that includes 24 countries. I want to find potentially profitable price trends, so I increase my opportunity to find them when I give myself more options.

There are 24 countries represented in the MSCI Emerging Markets Index and we’ve looked at the top 4 because they are given 68% of the exposure. That leaves only 32% in the other 20 countries. So, in regard to understanding what is driving the MSCI Emerging Markets Index, viewing the trend of the top holdings is enough to get an idea of the countries driving returns. But, in wanting to go find potentially profitable price trends, I research all the countries trends.

What about the rest of the emerging markets countries? 

Looking at the other 20 countries classified as emerging markets, I’ll divide them into groups. First, we’ll look at the other countries that are down -10% or more year-to-date. Then, I’ll draw a chart of those that are down this year,  but not as much. We’ll end with the few that are positive in 2018.

Emerging markets countries down the most year-to-date include Turkey, South Africa, Indonesia, Brazil, Philippines, Chile, Poland, and Peru. Priced in U.S. dollars, these countries are down between -14% and -52%. Turkey is down the most.

emerging markets countries down 2018 $EEM

Looking at their % off high shows us the drawdown over the past year, which is a different perspective. If you had held one of these ETFs, this is the amount it would be down from its highest price over the past year.

Emerging markets countries down the most 2018

Clearly, these emerging countries are in downtrends and a bear market if we define a bear market as a -20% decline. Keep in mind, these ETFs are foreign stocks priced in U.S. dollars, so to U.S. investors, this is what the trends of these countries look like.

Next, we observe emerging markets countries that are down less than -10% in 2018. Russia, Columbia, Thailand, and Malasia are down between -3% and 8% so far. Their trends are generally down: lower highs and lower lows.

emering markets year to date 2018

We can see the downtrends in a different perspective when we view their drawdowns as a % off high over the past year.

emering market countries percent off high asymmetric risk reward

I saved the best for last. The strongest trending top momentum emerging markets countries so far in 2018 are Mexico, Taiwan, Saudi Arabia, and Qatar. Saudi Arabia was previously classified as a smaller frontier market, but, this summer MSCI announced it will include the MSCI Saudi Arabia Index in the MSCI Emerging Markets Index.

top momentum emerging markets countires 2018

Hearing names like Mexico, Taiwan, Saudi Arabia, and Qatar may highlight home country bias for some investors. Home country bias is the tendency for investors to favor companies from their own countries over those from other countries or regions.

I don’t have a home country bias. I am open to finding potentially profitable price trends in any country around the world. We encourage investors to be open to global trends and not limit their choices, but if our clients don’t want exposure to any specific country, we are able to exclude it in our ASYMMETRY® Managed Portfolios.

While the United States is the single largest economy in the world, according to JP Morgan it accounts for only a small fraction of global GDP and just over 35% of the world’s capital markets. Yet, studies show that U.S. investors have nearly 75% of their investments in U.S.-based assets. As we’ve shown here, there has been a good reason to avoid emerging countries for now, but as we explain in Emerging Markets Reached a Bear Market Level there are times when these countries present strong relative momentum over U.S. stocks.

This is why I tactically shift between global markets based on their directional price trends rather than a fixed buy and hold global asset allocation.


Mike Shell is the Founder and Chief Investment Officer of Shell Capital Management, LLC, and the portfolio manager of ASYMMETRY® Global Tactical.

You can follow ASYMMETRY® Observations by click on on “Get Updates by Email” on the top right or follow us on Twitter.

The observations shared in this material are for general information only and are not intended to provide specific advice or recommendations for any individual. Investing involves risk including the potential loss of principal an investor must be willing to bear. Past performance is no guarantee of future results.


The week in review shows some shifts

Much of the observations I shared last week are continuing to be more apparent this week.  So, in case you missed it, this may be a good time to read them.

Earnings season is tricky for momentum growth stocks

I discussed how earnings season can drive a volatility expansion in stocks, especially high growth momentum stocks. The stock market leaders can become priced for perfection, so we never know how investors will react to their earnings reports. To achieve asymmetric returns from momentum stocks, we need a higher magnitude of positive reactions than adverse reactions over time. On a quarterly basis, it can be tricky. The gains and losses as much as 20% or more in the most leading momentum stocks like Facebook ($FB), Google ($GOOGL), Twitter ($TWTR), Grub ($GRUB), and NetFlix ($NFLX) have since provided a few examples.

Front-running S&P 500 Resistance

In Front-running S&P 500 Resistance I shared an observation that many market technicians incorrectly say support and resistance appear before it actually does. We won’t know if resistance to a price breakout exists until the price actually does pause and reverse. I suggested the S&P 500 may indeed pause and reverse, but not because the index drives the 500 stocks in it, but instead because my momentum indicators suggested the $SPY was reaching a short-term overbought range “So, a pause or reversal, at least some, temporarily, would be reasonable.” As of today, the S&P 500 has paused and reversed a little. We’ll see if it turns down or reserves back up to continue an uptrend.

Asymmetry of Loss: Why Manage Risk?

asymmetry of loss losses asymmetric exponential

In Asymmetry of Loss: Why Manage Risk? I showed a simple table of how losses compound exponentially. When losses become greater than -20%, it becomes more exponential as the gains required to recover the loss are more and more asymmetric.  This simple concept is essential and a cornerstone to understanding portfolio risk management. Buy and hold type passive investors who hold a fixed allocation of stocks and bonds are always fully exposed to market risk. When the market falls and they lose -20%, -30%, -50% or more of their capital, they then face hoping (and needing) the market to go back up 25%, 43%, or 100% or more just to get back to where they were. This can take years of valuable time. Or, it could take a lifetime, or longer. Just because the markets have rebounded after being down for four or five years from their prior highs doesn’t guarantee they will next time. Past performance is no guarantee of future results.

Trend following applied to stocks

In Trend following applied to stocks, the message was short and sweet: gains are produced by being invested in stocks or markets that are trending up and losses are created by stocks trending against us. Investors prefer to be in rising stocks and out of falling stocks. But, as I showed in Earnings season is tricky for momentum growth stocks the trick is giving the big trends enough room to unfold. In fact, applying trend following and momentum methods to stocks is also tricky. It’s a skill that goes beyond just looking at a chart and it’s not just a quantitative model.

Stock market investor optimism rises above the historical average

About two weeks ago,  the measures of investor sentiment showed a lot of optimism about future stocks prices, so we shouldn’t have been surprised to see some stocks fall. When a lot of enthusiasm is already priced in, investors can respond with disappointment when their stocks don’t live up to high expectations.

Much of the momentum and trend following in stocks is driven by an overreaction to the upside that can be accompanied by an overreaction to the downside. A robust portfolio management system factors these things in.


Mike Shell is the Founder and Chief Investment Officer of Shell Capital Management, LLC, and the portfolio manager of ASYMMETRY® Global Tactical.

You can follow ASYMMETRY® Observations by click on on “Get Updates by Email” on the top right or follow us on Twitter.

The observations shared in this material are for general information only and are not intended to provide specific advice or recommendations for any individual. Investing involves risk including the potential loss of principal an investor must be willing to bear. Past performance is no guarantee of future results.

Front-running S&P 500 Resistance

The S&P 500 stock index closed just -1% from its all-time high it reached on January 26, 2018, and hasn’t been that high since. It’s been in a drawdown that was as much as -10% and it has taken six months to get back near its high point to break even.

SPY SPX $SPX $SPY S&P 500 STOCK INDEX

Before the madness begins saying “The S&P 500 is at resistance,” I want to point out an observation of the truth. It is one thing to draw a trend line on an index to indicate its direction, quite another to speak of “support” and “resistance” at those levels.

Is the S&P 500 at resistance? 

Depending on which stock charting service or data provider you use, it may appear the S&P 500 ETF (SPY) closed at its prior high. Many market technicians would draw a line like I did below in green and say “the S&P 500 is at resistance.”

S&P 500 stock index at resitance SPY SPX

In technical analysis applied to stock market trends, support and resistance is a concept that the movement of the price of a security will tend to stop and reverse at certain predetermined price levels.

Support is when a price trends down and stalls at a prior low. The reasoning is that investors and traders who didn’t buy the low before (or wish they’d bought more) may have buying interest at that prior low price if it reaches it again.

Resistance is when a price trends up and stalls at a prior high. The reasoning is that investors and traders who didn’t sell the high before (or wish they’d sold short to profit from a price decline) may have the desire to sell at that prior high price if it reaches it again.

Whether everyone trades this way or not, enough may that it becomes a self-fulling prophecy. I believe it works this way on stocks and other securities or markets driven by supply and demand, but an index of stocks?

To assume a market or stock will have support or resistance at some price level (or a derivative of price like a moving average) that hasn’t been reached yet is just a predictive assumption. Support and resistance don’t exist unless it is, which is only known after the fact.

One of the most fascinating logical inconsistencies I see by some technical analysts is the assumption that “support” from buying interest and “resistance” from selling pressure “is” there, already exists, before a price is even reached. Like “SPY will have resistance at $292.” We simply don’t know until the price does indeed reverse after that point is reached.

But, it gets worse.

To believe an index of 500 stocks is hindered by selling pressure at a certain price requires one to believe the price trend is controlled by the index instead of the 500 stocks in it.

Think about that for a moment. Let it sink in. 

  • Do you believe trading the stock index drives the 500 stocks inside the index?

or

  • Do you believe the 500 stocks in the index drive the price of the index?

What you believe is true for you. But, to believe an index of 500 stocks is hindered by selling pressure or buying interest at a certain price requires you believe the price trend is controlled by the index instead of the 500 stocks in it. That’s a significant belief.

To complicate it more. If we want to know the truth, we have to look a little closer.

Is the S&P 500 at resistance? 

As I said, it depends on which stock charting service or data provider we use and how we calculate the data to draw the chart. Recall in the prior chart, I used the SPDRs S&P 500 ETF (SPY) which shows the ETF closed near its prior high. I used Stockcharts.com as the data provider to draw the chart. I’ve been a subscriber of their charting program for 14 years so I can tell you the chart is based on Total Return as the default. That means it includes dividends. But, when we draw the same chart using the S&P 500 index ($SPX) it’s based on the price trend. Below is what a difference that makes. The index isn’t yet at the prior high, the SPY ETF is because the charting service includes dividends.

SPY SPX TOTAL RETURN RESISTANCE

Here is another charting service where I’m showing the S&P 500 ETF (SPY) price return, total return, and the S&P 500 stock index. Only one is at the January high.

spy spx S&P 500 resistance

So, we don’t know if the S&P 500 is at resistance and we won’t know if there exists any “resistance” there at all unless the price does pause and reverse down. It so happens, it just may pause and reverse at this point. Not because more tactical traders are looking at the total return chart of SPY or because the index or ETF drives the 500 stocks in it, but because momentum measures indicate its potentially reaching an “overbought” level. So, a pause or reversal, at least some, temporarily, would be reasonable.

Some may call this charting, others call it technical analysis, statistical analysis, or quantitative analysis. We could even say there is some behavioral finance included since it involves investor behavior and biases like anchoring. Whatever we choose to call it, it’s a visual representation of supply and demand and like most things, it’s based on what we believe to be true.

I’ve been applying charting, pattern recognition, technical analysis, statistical analysis, and quantitative analysis for over twenty years. Before I started developing computerized programs based on quantitative trend systems that apply evidence-based scientific methods, I was able to trade successfully using visual charts. I believe all of it has its usefulness. I’m neither anti-quant or anti-charting. I use both, but for different reasons. I can argue for and against both because neither is perfect. But, combining the skills together has made all the difference for me.

Is the S&P 500 at resistance? 

We’ll see…


Mike Shell is the Founder and Chief Investment Officer of Shell Capital Management, LLC, and the portfolio manager of ASYMMETRY® Global Tactical.

You can follow ASYMMETRY® Observations by click on on “Get Updates by Email” on the top right or follow us on Twitter.

The observations shared in this material are for general information only and are not intended to provide specific advice or recommendations for any individual. Investing involves risk including the potential loss of principal an investor must be willing to bear. Past performance is no guarantee of future results.

Happy Birthday, America!

242 years ago, the British told Americans to put down their guns.

How did that work out?

Happy Birthday, America!

Please enjoy your freedom and have a happy 4th of July

land of the free because of the brave .jpg

My Introduction to Trend Following

I have noticed more investors are talking about “trend following” these days and more traders and advisors are calling themselves trend followers. As a professional portfolio manager who has been applying trend systems to global markets for two decades, one of the most common questions I get asked is “how did you get started?” Specifically, how my investment strategy, risk management, and trend systems evolved over time.

I’ll explain it here, so you know where I am coming from.

Why do you think we learn math by hand before using a machine?

We learn to do the math manually because it teaches us the basics before we use a computer. We learn to ask the right questions, turn problems into math formulas, then do the calculations. By working it out manually by hand, we get a feel for the math, an instinct for it.

I learned trend following the same way.

What is trend following?

Trend following or trend trading is a trading strategy according to which one should buy an asset when its price trend goes up, and sell when its trend goes down, expecting price movements to continue.”

My first introduction to the term “trend following” was John Murphy‘s Technical Analysis of the Financial Markets: A Comprehensive Guide to Trading Methods and Applications published by New York Institute of Finance in 1999. It was the first book I read clearly dedicated to charting price trends and technical analysis.

In the early 1990’s the first book I read on investment and trading was How to Make Money in Stocks: A Winning System in Good Times and Bad by William J. O’Neil. He described a systematic quantitative approach to screen for stocks with high relative price strength, high earnings growth, and then determine the entry and exit viewing a price chart. O’Neil’s research discovered the best stocks display seven common traits just before they make their biggest gains.  O’Neil calls his strategy the CAN SLIM® Investment System. The CAN SLIM® system for deciding what to buy is based on things like strong earnings growth, which is believed to be the primary driver of a stocks price trend. Once he has screened for this criteria, O’Neil applies trend following to stocks because he requires them to be in a positive trend.

After researching and applying his investment system for years in the late 1990’s, I wanted to create my own system that fit me.  My first interest was to become more advanced in understanding and identifying directional price trends. Naturally, that was the beginning of my extensive research that began with studying every book I could find on technical analysis and completing every training program I could.

I went on to read over 500 books covering a broad range of portfolio management topics including trading, technical analysis, and maths like probability and statistics. I wanted to understand how markets interact with each other, what typically drives trends, and what trends look like. Studying price trends naturally led me to investigate investor sentiment, trading psychology, and investor psychology. I have always had a strong interest in math and I think in terms of systems and algorithms, so fifteen years ago I shifted from looking at charts visually to testing and developing trading systems based on price trends.

By 2006, I had already been testing and developing quantitative computerized trading systems for a few years, but I was still also working on the craft of charting and CAN SLIM®. In 2006, I flew out to Santa Monica, CA to attend the first CAN SLIM® Masters Program training with O’Neil and his portfolio managers and passed the exam for the CAN SLIM® Masters certification. I also had become skilled at all kinds of charting including bar charts, point & figure charting, and candlestick charting. I believe becoming a craftsman at all of these different methods provided me with unique skills to understand price trends, how markets interact, and developing computerized trading systems.

I have spent over two decades fully immersed in learning about methods of identifying trends and systems and how to trade them across multiple time frames and multiple markets. My own experience started with basic charting, evolved with more technical analysis tools, then I developed computerized trading systems based on the knowledge and skills I cultivated. Reading books (or writing them) only discovers knowledge. The only way to develop skill is through the intentional practice of actually doing it.

Before I share one of the first things I read on trend following, I want to explain there is more than one way to execute a trend system.

Whether you are an investor who invests in an investment program or a trader who makes the portfolio management decisions in an investment program, you have to choose which fits you and your own beliefs. I can only tell you what I believe. What you believe is true, for you. As I have been successful doing what I do, I can only tell you that the key to success if finding what fits you. Reading information like this is intended to help you decide what you believe and what you don’t believe.

I see tactical traders applying two main methods for trend following.

Some of them say they are “rules-based” others say they are “systematic”, but we don’t often see them say they are “discretionary” even if they are. Here is how I see it.

Discretionary trend following trading and investment decisions can include a wide range of operations, but I’m specifically talking about a discretionary trend follower. A discretionary trend follower is someone who looks at a chart, sees the signal, sees that it looks right, and pulls the trigger. The discretionary trend follower may be rules-based and may have a systematic process, but the discretionary trend follower is ultimately making the decision to buy or sell.

Systematic trend following trading and investment decisions apply a set of rules and procedures for trading and investment decisions. To me, a trend follower can be systematic but also be discretionary. A systematic “discretionary” trend follower may be still discretionary but has rules and a process. For example, they look at a chart, see the signal, see that it looks right, and pulls the trigger. Or, a trend follower can be systematic and automated by a computerized trading system that generates the signals. However, when the professional investment industry says “systematic trading” or “systematic trend following” we usually mean more automated and mechanical.

Automated Systematic trend following is necessarily systematic because it’s when we use a computer program to generate the signals automatically. But, a fully systematic trend follower who is automated has a program that not only generates a trend following signal but also generates trade instructions to the broker. A fully mechanical and automated trend following system is computerized to the point that it enters the trades.

I explained these operational methods so you will know where I am coming from as you read about trend following in a technical analysis book. Which of these you believe is best is up to you. I believe that either discretionary trend following or systematic with automation both have the potential to work. It’s just a matter of which method fits you. There are potential advantages and disadvantages of both methods of application and depending on your personal preference, you’ll see them that way. If you are an investor in an investment program, you need to invest with a portfolio manager that fits your preference. If you are a trend following trader, you may lean toward one or the other.

Some traders simply like looking at charts and making their decision that way. They need to see the signal and see that it looks right according to their rules to get the confidence to execute. Others may not be so skilled at seeing the signal on a chart, or maybe they don’t want to spend their time doing it so we can program a computerized system. It seems many new systematic traders weren’t good at discretionary decisions using charts, so their backtesting makes them feel more confident. Only time will tell if these newer systematic traders will be able to follow their automated systems when they invariably don’t perform as they hoped all the time.

Ultimately, it comes down to beliefs and confidence. If you aren’t confident in your ability to see the signal and execute from a chart consistently, then an automated system may help. Some trend followers gain more confidence seeing the signal and pulling the trigger. Those same trend followers would likely have difficulty executing system generated trades.

I often hear things like “our systematic model removes the emotion”, which is far from the truth. Anyone who believes an automated system will remove their emotional issues will eventually experience a whole new set of emotions they may not have felt yet. But, some have a real problem with pulling the trigger, so an automated system may help if they have someone else execute the trades. For example, a professional money management firm like mine has professional traders who execute our trades. But, this still doesn’t assure anyone the trend follower will be able to follow the system through different market conditions.

If someone lacks the self-discipline required to pull the trigger, execute the trades, and follow whatever systems they follow, no method or automation will help. If a trader or investor lacks self-discipline, that issue has to be resolved another way before they’ll find success.

I know at least 100 or so professional investment managers who have been tactical trading including trend following a few decades. I’ve seen a range of experiences and outcomes. I can tell you that it isn’t easy. The only people who will say it is are those who aren’t actually doing it. Developing an edge either personally as a discretionary trader or through an automated trading system requires a tremendous amount of knowledge, skills, and self-discipline. Few have it, but some of us do. I believe in human performance because I’ve experienced it first hand. It’s like hockey or Indy racing. Anyone can attempt it, but only the most dedicated will achieve long-term success. Rest assured, discretionary or systematic, it’s still a human endeavor as long as it’s their money.

By now, you may be wondering what I believe and what I do.

I do a combination of these. I am Man + Machine.

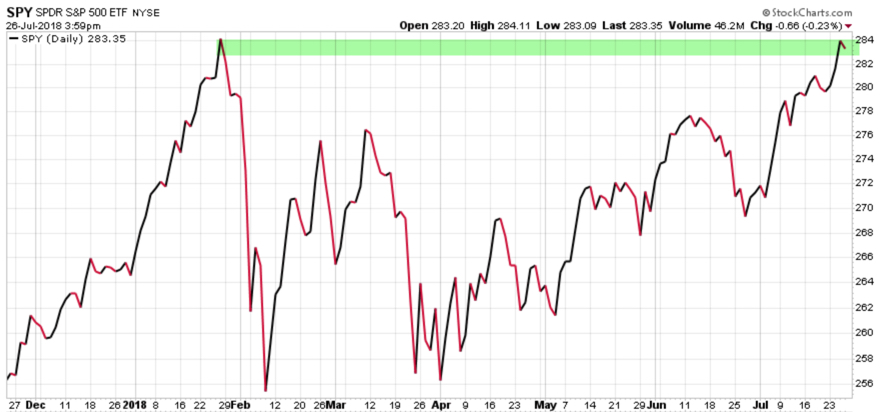
I started charting over two decades ago and applied what I knew to develop computerized systems fifteen years ago. I still enjoy drawing charts like I share here on ASYMMETRY® Observations to see how trends are unfolding. I have several systems that are fully automated that trade all kinds of markets. I’ve learned a lot from just operating them for so long. But ultimately, I use my systems to inform decisions and generate signals and I have the necessary discipline to pull the trigger by sending instructions to my professional traders who execute my trades. That’s what works for me. What works for others may be different. I know where I am sitting right now and it’s where I want to be.

Without further ado, I present one of the first things I read on trend following published in 1999. As you will see, trend following and technical analysis are related. Trend following uses technical indicators like trend lines, moving averages, directional movement, and momentum to generate signals for following trends.

John Murphy is a well-known technical analyst whose books I have read for over two decades. His first book I read was Technical Analysis of the Futures Markets published in 1986 which was charting applied to commodities futures. One of my first introductions to the “trend following” strategy was John Murphy’s Technical Analysis of the Financial Markets published in 1999. I share the following with permission from John Murphy. He starts with the philosophy or rationale of technical analysis, which has an objective of following trends in hopes they will continue. The rest of the book describes many ways to actually identify trends.

Excerpt from Technical Analysis of the Financial Markets:

“There are three premises on which the technical approach is based:

  • Market action discounts everything.
  • Prices move in trends.
  • History repeats itself.

The statement “market action discounts everything” forms what is probably the cornerstone of technical analysis. Unless the full significance of this first premise is fully understood and accepted, nothing else that follows makes much sense. The technician believes that anything that can possibly affect the price— fundamentally, politically, psychologically, or otherwise— is actually reflected in the price of that market. It follows, therefore, that a study of price action is all that is required.

All the technician is really claiming is that price action should reflect shifts in supply and demand. If demand exceeds supply, prices should rise. If supply exceeds demand, prices should fall.

The technician then turns this statement around to arrive at the conclusion that if prices are rising, for whatever the specific reasons, demand must exceed supply and the fundamentals must be bullish. If prices fall, the fundamentals must be bearish.

Most technicians would probably agree that it is the underlying forces of supply and demand, the economic fundamentals of a market, that cause bull and bear markets. The charts do not in themselves cause markets to move up or down. They simply reflect the bullish or bearish psychology of the marketplace.

As a rule, chartists do not concern themselves with the reasons why prices rise or fall. Very often, in the early stages of a price trend or at critical turning points, no one seems to know exactly why a market is performing a certain way.

While the technical approach may sometimes seem overly simplistic in its claims, the logic behind this first premise— that markets discount everything— becomes more compelling the more market experience one gains.

It follows then that if everything that affects market price is ultimately reflected in market price, then the study of that market price is all that is necessary.

By studying price charts and a host of supporting technical indicators, the chartist in effect lets the market tell him or her which way it is most likely to go. The chartist does not necessarily try to outsmart or outguess the market.

All of the technical tools discussed later on are simply techniques used to aid the chartist in the process of studying market action.

The chartist knows there are reasons why markets go up or down. He or she just doesn’t believe that knowing what those reasons are is necessary in the forecasting process.

Prices Move in Trends

The concept of trend is absolutely essential to the technical approach. Here again, unless one accepts the premise that markets do in fact trend, there’s no point in reading any further.

The whole purpose of charting the price action of a market is to identify trends in early stages of their development for the purpose of trading in the direction of those trends. In fact, most of the techniques used in this approach are trend following in nature, meaning that their intent is to identify and follow existing trends.

There is a corollary to the premise that prices move in trends— a trend in motion is more likely to continue than to reverse. This corollary is, of course, an adaptation of Newton’s first law of motion. Another way to state this corollary is that a trend in motion will continue in the same direction until it reverses.

This is another one of those technical claims that seems almost circular. But the entire trend following approach is predicated on riding an existing trend until it shows signs of reversing.”


He explained the philosophy or rationale of technical analysis, which has an objective of following trends in hopes they will continue. The rest of the book describes many ways to actually identify trends.

As I see it, trend following uses technical indicators to generate signals for following trends.

Mike Shell is the Founder and Chief Investment Officer of Shell Capital Management, LLC, and the portfolio manager of ASYMMETRY® Global Tactical.

You can follow ASYMMETRY® Observations by click on on “Get Updates by Email” on the top right or follow us on Twitter.

The observations shared in this material are for general information only and are not intended to provide specific advice or recommendations for any individual. Investing involves risk including the potential loss of principal an investor must be willing to bear. Past performance is no guarantee of future results.

Asymmetric force was with the buyers

In Asymmetric force direction and size determines a trend, I explained how the net force of all the forces acting on a trend is the force that determines the direction. The force must be asymmetric as to direction and size to change the price and drive a directional trend.

The asymmetric force was with buyers as they dominated the directional trend on Friday.

Friday’s gain helped to push the stock market to a strong week and every sector gained.

The S&P 500 stock index is about -3% from it’s January high and closed slightly above the prior high last week. I consider this a short-term uptrend that will resume it’s longer-term uptrend if it can break into a new high above the January peak.

After declining sharply -10% to -12%, global equity markets are recovering. The good news for U.S. stocks is the Russell 2000 small company index is closest to its prior high. Small company leadership is considered bullish because it suggests equity investors are taking a risk on the smaller more nimble stocks.

As you can see in the chart, the Dow Jones Industrial Average and International Developed Countries (MSCI EAFE Europe, Australasia and Far East) are lagging so far off their lows but still recovering.

So far, so good, but only time will tell if these markets can exceed their old highs and breakout into new highs, or if they discover some resistance force at those levels and reverse back down. As we discussed in Asymmetric force direction and size determines a trend it’s going to depend on the direction and size of the buyers vs. sellers.

Mike Shell is the Founder and Chief Investment Officer of Shell Capital Management, LLC, and the portfolio manager of ASYMMETRY® Global Tactical.

You can follow ASYMMETRY® Observations by click on on “Get Updates by Email” on the top right or follow us on Twitter.

The observations shared in this material are for general information only and are not intended to provide specific advice or recommendations for any individual. Investing involves risk including the potential loss of principal an investor must be willing to bear. Past performance is no guarantee of future results.

Asymmetric force direction and size determines trend

In physical science, force is used to describe the motion of a push or pull. Newton’s first law of motion – sometimes referred to as the law of inertia. Newton’s first law of motion is stated as:

“An object at rest stays at rest and an object in motion stays in motion with the same speed and in the same direction unless acted upon by an unbalanced force.” —Newton’s First Law of Motion

Unbalanced force? well well, there’s another asymmetry.

A push or pull is a force. To define a force, we must know its direction and size. It works similar to supply and demand on market prices. If there is enough size in a direction, a price will move in that direction. If there isn’t enough price size in a direction, the price will stay the same.

There are two kinds of forces:

Symmetrical (balanced) forces are equal in size, but opposite in direction. Symmetric forces are balanced, so they lack the direction and size to cause a change a motion. The push and pull are equal and offsets each other. Applying the concept of force to price trends in the market, when balanced forces act on a market price at rest, the market price will not move. When buying enthusiasm and selling pressure are the same, the price will stay the same.

Asymmetrical (unbalanced) forces are not equal and are opposite in direction, so they cause a change in the motion. The size of one directional force is greater than the other, so it’s going to trend in that direction. Some examples of these unbalanced forces can be observed in physical science.

More than one force can be acting at the same time, so the forces are combined into the net force. The net force is the combination of all the forces acting on a trend. The net force determines the direction. If forces are trending in opposite directions, then the net force is the difference between the forces, and it will trend in the direction of the larger force. You can probably see how that is visible in a chart of a price trend.

If buyers are willing to buy more than sellers are willing to sell, the buying pressure is a force that forces up the price until it gets high enough to push sellers to sell.

If sellers are ready to sell more than buyers are willing to buy, the selling pressure is a force that pulls down the price until it gets low enough to pull in buyers to buy.

So, Newton’s first law of motion and inertia is related to Economics 101: When the size of the force of buyers or sellers is larger in one direction, the price will trend. We can observe who is more dominant by simply looking at a price trend chart or quantifying it in a trading system.


Mike Shell is the Founder and Chief Investment Officer of Shell Capital Management, LLC, and the portfolio manager of ASYMMETRY® Global Tactical.

You can follow ASYMMETRY® Observations by click on on “Get Updates by Email” on the top right or follow us on Twitter.

Investment results are probabilistic, never a sure thing. Past performance is no guarantee of future results.


In remembrance of euphoria: Whatever happened to Stuart and Mr. P?

I have recently found myself reminiscing about the late 1990’s – specifically the grand euphoric year of 1999. If you aren’t sure why then maybe you aren’t paying attention. Sometimes not paying attention is a good thing if it prevents you from following a herd off a cliff.

The four most expensive words in the English language are “this time it’s different.” – John Templeton

Lately, I’ve been reminiscing about the tech stock bubble, the .com’s, and how the Nasdaq QQQ replaced the Dow Jones Industrial Average as the favorite index by 1999. Then there were all the infamous statements like “you don’t understand the New Economy”. We’ve been talking about the funny commercials from the baby trader to the college-age guy helping the mature executive start trading online, to “Be Bullish”.

Do you remember Stuart and Mr. P? Back in 1999, there were traditional “stockbrokers” who were registered with a brokerage firm, who bought and sold stocks, bonds, and options for individual and institutional clients. If you were a stockbroker back then, like I was, you probably remember it well. Online trading was the beginning of the end for the traditional “stockbroker” firms earning a $200 commission to buy or sell 100 shares. The great thing about the evolution of online trading is it lowered trading costs dramatically. For someone like me who wanted to be a tactical money manager anyway, that was a great thing. I embraced it and went on to start my investment management company. But the point of this observation is the investor sentiment in 1999. The video below is amazing to watch 20 years later. But what fascinates me the most is how it reminds me of today; different subjects, same sentiment.

Watch:


That may remind you of some of the things we hear today.

Those type of commercials flooded the financial news and evening news channels in 1999. To be sure, below is a WSJ article printed about the “Let’s Light This Candle” ad on December 7, 1999. I’ll tell ya what… that’s about as close to the top as you can get.

So, I wondered, what happened to Stuart and Mr. P? 

Stuart was helping Mr. P buy Kmart stock online. Kmart was then one of America’s leading discount retailers. The Kmart Corporation was the second largest U.S. discount retailer and major competitor to Walmart. Kmart filed for Chapter 11 bankruptcy protection in January 2002. Just two years after Stuart helped Mr. P buy shares online it filed for the largest ever retail bankruptcyKmart was later bought by Sears, which is now a failing company. At least Mr. P was wise enough to only buy 100 shares, young Stuart wanted him to buy 500 shares! They had no position size method to determine how much to buy based on risk, which would include a predefined exit. It is unlikely Mr. P had a predefined exit in place to exit the stock to cut the loss short. During that time, investors were only thinking about what to buy. They rarely considered how and when to exit a stock with a small loss to avoid a larger loss. After such a strong bull market, who is thinking about the risk of loss?

For those of us who remember, in the late 1990’s most investors weren’t just buying the largest retailers – they were buying technology. In hindsight, that period is now referred to as the “tech boom” or “tech bubble”. That’s because almost everyone wanted to buy tech stocks. Literally, even the most conservative seniors were cashing out bank CD’s to buy tech stock.  And… I’m not even going to get into the .com stocks, most of which no longer exist from that time.

Whether you remember the trend as my friends and I do or not, we can use historical price charts to see what happened. Below is the Technology Select Sector SPDR® ETF  since its inception 12/16/1998 to today. I’m starting with the full history to see the initial gain, before the waterfall decline. The Technology Select Sector SPDR® Fund seeks to:

“Provide precise exposure to companies from technology hardware, storage, and peripherals; software; diversified telecommunication services; communications equipment; semiconductors and semiconductor equipment; internet software and services; IT services; electronic equipment, instruments, and components; and wireless telecommunication services.”

Those were the most popular sectors, aside from the actual Internet stocks.

Below is what happened from December 9, 1999, when WSJ printed the article about the ad because it was so interesting and popular, to now. After nearly 20 years an investor buying the diversified tech sector would have just recently realized a profit, assuming they held on for 19 years.

Here is what that -80% drawdown looked like that lasted 19 years.

“Those who cannot remember the past are condemned to repeat it. “

George Santayana


This is a kickoff of a series of articles on this topic I have in queue on current global market conditions. Stay tuned…

Mike Shell is the founder of Shell Capital Management, LLC, a registered investment manager and portfolio manager of ASYMMETRY® Global Tactical.

All Eyes are Now on the Potential Government Shutdown

If the U. S. Government shuts down, it will be the 19th time. Looking at the table below, it doesn’t seem a big deal. The table shows the 18 prior government shutdowns going back to 1976. It lists the start and end date of the shutdown and the gain or loss for the S&P 500 stock index. The average is only a -0.60% loss from beginning to end of the shutdown.

But, here are some considerations: 
1. It is too small of a sample size to draw a statistically significant inference. Basic probability needs 30 data points.
2. It only shows the gain/loss from beginning and end of the shutdown.
3. It doesn’t show what happened before and after those dates. Was there more movement/drawdown before or after?
4. It doesn’t show what happened in between the start and end date so it may have been worse.
5. It doesn’t consider market stage at the time of shutdown. Was it overvalued and overbought? Or was it undervalued and oversold?

The truth is; anything can happen.
We don’t know for sure how it will play out. With such a small sample size of prior events and without factoring in the market conditions at the time, what it did in the past doesn’t provide us with a good expectation.

The current condition: if the government shuts down this time:
1. It will be when the U.S. stock market is at the second most expensive fundamental valuation, ever.
2. When investor and advisor bullish sentiment has reached record highs, at this point a contrary indicator.
3. As recent momentum indicators are at the highest levels ever seen before, at this point a contrary indicator.

My solution? always be prepared that anything can happen.
I know how much risk I’m willing to take given the possible outcomes and define my risk by knowing when I’ll hedge or exit.


Mike Shell is the founder of Shell Capital and the Portfolio Manager of ASYMMETRY® Global Tactical.

Asymmetry in Income Taxes

It seems we hear more about “inequity” in recent years, like income inequality. Income inequality refers to the extent to which income is distributed in an uneven manner among a population. That shouldn’t be a surprise since our efforts are asymmetric. We don’t hear much about the asymmetry in the effort. That is, some try harder and work harder than others, and take bigger risks, which leads to the asymmetry in income.

Regardless of the cause, the progressive U.S. tax system aims to balance it out to spread the wealth.

In “A closer look at who does (and doesn’t) pay U.S. income tax” Pew Research finds that:

…taxpayers with incomes of $200,000 or more paid well over half (58.8%) of federal income taxes, though they accounted for only 4.5% of all returns filed (6.8% of all taxable returns).

By contrast, taxpayers with incomes below $30,000 filed nearly 44% of all returns but paid just 1.4% of all federal income tax – in fact, two-thirds of the nearly 66 million returns filed by people in that lowest income tier owed no tax at all.

Read the full story at: “A closer look at who does (and doesn’t) pay U.S. income tax

What do wealthy people do differently?

This morning a financial planner who knows we are the investment manager to wealthy families asked me a great question:

“What do wealthy people do differently?”

I thought I would just sit here and write it out. These are my own observations over a few decades.

First, let’s define “wealthy”.

I’m going to define “wealthy” as someone who has already achieved “freedom”. Notice I said “freedom”, not just “financial freedom”. I’ve asked thousands of people over the past two decades “what is important about money to you?”. Ultimately, the question leads to one single word: “freedom”. So, there doesn’t seem to be a need to add “financial” in front of “freedom”. But, that isn’t to say you can’t have plenty of money without much freedom. You could say “Some people have far more money than they ever need but they still don’t enjoy their freedom because they keep working for more”. You may consider that person is still getting what they want. Some people just want to produce, and they never stop. They are still free. They have the freedom to keep doing what they love doing. In fact, some wealthy people are driven to create more wealth for a charity. No matter what our goals are in life, traveling, relaxing, time with family and friends, helping others, having enough capital to do what we want seems essential.

Having enough money to do what we want, when we want, seems to be the primary goal of most of us.

So, I define “wealthy” as someone who has already achieved “freedom”, regardless how he or she chooses to enjoy his or her freedom.

What do these people do differently than those who haven’t accumulated enough capital to say they are “wealthy”?

1. They save and invest money. The first thing that I have observed is that they simply save part of their income and invest it.

a. Save: They save it because they don’t spend more than they should. They save a large amount of themselves to use later. Even if they earn $X a year, they don’t the most they can for their home or carts. For example, a person earning $1 million a year may live in a $1 million neighborhood and a neighbor who earns $200,000 a year. Who do you think will be “wealthy”? One is stretched, the other is saving.

b. Invest: People who achieve “freedom” and the “wealthy” status don’t stop and just saving money in a bank account, they invest it. Wealthy people take the time to invest their money. Most of them invest with an investment manager who is fully committed to investment management.

2. Wealthy people care about their money. I know a lot of wealthy people, and I know just as many who aren’t. Those who are wealthy save and invest money, those who don’t spend it. As investment management clients, wealthy families are the first to complete forms, etc. as needed because they care about their money. They also appreciate investment managers who are on top of things as they would be.

3. Wealthy people are focused on that ONE thing they do best. Just like the book The ONE Thing: The Surprisingly Simple Truth Behind Extraordinary Results says: they are focused. If they are a Physician, they focus on being a great Physician. If they own a company, they focus on their business. If they are a country music artist, they focus on being the best they can be. If they are an engineer, that’s their focus. They do what they do best and they find other people to do the things they don’t want to do like lawn maintenance or whatever. If you want to earn more money to save and invest, focus on what earns you the most and pay others for the things you aren’t so great at or don’t want to do.

4. They take some risks and manage their risk. To achieve wealth, we have to be both risk-takers and risk managers. If we take no risks in life, we’ll have no chance of reward. Not graduating from college has some risks, but so does attending. Who we marry, how we title our assets, how we insure our assets, and how we manage our assets all have risks and the potential for reward. Wealthy people tend to take risks in that one thing they are best at. They go “all in”. But wealthy people also direct and control their risks. They try to take good risks that are worth taking. It doesn’t matter how much wealth we accumulate if we aren’t able to keep it. For example, many people can remember how much wealth they created on paper up to 2000 only to see it cut in half. They did it again up to 2007 through 2009, and it took years to break even. Wealthy people know to realize a real profit, you have to take a profit. To avoid a large loss, we have to cut losses off at some point. Proper planning and risk management are essential.

5. Everything is relative, but yet it isn’t to them. I know business owners as well as Physicians who I consider wealthy as well as musicians, and athletes. But, you don’t have to earn $500,000 a year all your life to become wealthy. You don’t have to earn it all in a short time, either. I know people who have a total $500,000 invested who are wealthy. They have “enough”, for them. Depending on the lifestyle, others may not become wealthy until they have over $5 million if they spend a few hundred thousand a year traveling, etc. I also know families with several hundred million. Everything is relative, but wealthy people don’t compare their wealth and assets to others. They aren’t “keeping up with the Joneses”. People who do that often have large debts because they buy things they can’t afford with money they don’t have. Or, they save and invest less.  Wealthy people don’t buy a new car or house because their friend does, or compare their investment account to others. Wealthy people may be more introverted when it comes to personal finance – their focus is on their own family needs.

What do the wealthy do differently? They discover how much capital they need to enable the freedom to do what they want when they want, whatever that may be. Income alone, or the neighborhood we live in, or the cars we drive, or memberships don’t signal that we are wealthy. Some wealthy people are still operating their business, practice,  or “working”. A distinction is that they want to and they could choose to do something else with their time if they want. Wealthy families have saved and invested enough money to have achieved freedom. To do that, they focus on the thing they do best. They delegate the other stuff to someone else. They care about accumulating and managing their money and managing their risks. They appreciate investment managers and wealth managers who help them do it.

Is this the Inflection Point for Stocks?

As if the election result wasn’t enough, the U.S. stock market has surprised most people by trending up since last November.

But, it has been stalling since March. The S&P 500 drifted down about -3% into March and April.

The stock market seems to be at an inflection point now.

Understanding the market state is an examination of the weight of the evidence.

The weight of the evidence seems to suggest defense.

My first indicator is always the actual price trend itself. If we want to know what is going on, there is no better observation than the actual price trend. The price action tells us what force is in control: supply or demand. And, we can see the potential for the inflection point – when the direction is changing. In the chart below, I highlight a recent point of “resistance”. I call it resistance because the stock index hasn’t broken above the March high and is instead drifting sideways.

average age of bull market top

Investors sometime assume a prior price high will automatically become “resistance” just because it’s the price range they expect to see the price trend stall. Resistance is the price level where selling is expected to be strong enough to prevent the price from rising further. We can see that recently in the chart. As the price advances towards the prior peak, supply may overcome demand and prevent the price from rising above resistance. For example, it may be driven by investors who wished they had sold near the prior peak and had to wait as the price recovered again. They anchor to that prior high. Once it gets back to the prior peak, they exit. Prior highs don’t always become “resistance” as expected. Sometimes demand is strong enough to break through and keep trending up. At this point, we see there has been some resistance at the prior high. I highlighted it in yellow in the chart above. So, we shouldn’t be surprised to see the price decline if this resistance holds for a while. Or, it could be an inflection point.

The S&P 500 stock index is mainly large companies. Smaller companies tend to lead larger companies. Their price trends move in a wider range and they sometimes move faster, so they get to a point sooner. That’s why we say small company stocks “lead” large company stocks. In that case, I highlight below that the small company stock index, the S&P 600 Small Cap ETF, reached its prior, but found resistance and reversed down. The soldiers may lead the way for the Generals.

Small Cap

It seems that the stock index is stalling at a time when investors are complacent. When investors are complacent or overly optimistic an inflection point is more likely. The CBOE Volatility Index® (VIX® Index)  is very low. The CBOE Volatility Index® (VIX® Index®) is a key measure of market expectations of near-term volatility conveyed by S&P 500 stock index option prices. The VIX® historically trends between a long-term range. When the VIX® gets to an extreme, it becomes more likely to eventually reverse. In the chart below I show the price level of the VIX® since its inception in 1993. We can see its long-term average is around 20. I highlighted in red its low range is around 12 and it has historically spiked as high as 25 or 60. This means the traders of options are expecting lower volatility in the weeks ahead at a time when other things seem to suggest otherwise.

As I continue sharing some observations, I’m going to get farther away from my main decision maker which is the directional price trend, but you’ll see how these indicators help to quantify the state of the trend and the potential for an inflection point. As we keep going, keep in mind that indicators are a derivative of the price at best or a derivate of something unrelated to the directional price trend. In the case of the VIX® Index index above, it’s a measure of options (a derivative) on the stocks in the S&P 500. When we start looking at things like economic growth and valuations we are necessarily looking at things that are a derivative of price, but not as absolute as the price trend itself. The direction of the price trend is the arbiter.

Another signal of an inflection point is breadth. That is, what percent of stocks are rising or falling. Since I have mentioned the S&P 500 stock index, I’ll show the S&P 500 Bullish Percent Index below. The Bullish Percent is a breadth indicator based on the number of stocks on Point & Figure buy signals. Developed by Abe Cohen in the mid-1950s, the Bullish Percent Index was originally applied to NYSE stocks. Cohen was the first editor of ChartCraft, which later became Investors Intelligence. BP signals were further refined by Earl Blumenthal in the mid 70’s and Mike Burke in the early 80’s. The S&P 500 Bullish Percent shows a composite of the 500 stocks in the S&P 500 index that are in a positive trend. The S&P 500 Bullish Percent recently reversed to a column of O’s from a high point of 80, which means about 80% of the S&P 500 stocks were in a positive trend and about 8% of them are now in a negative trend. In addition to the direction, the level is important because we consider the level above 70% or 80% to be a higher risk (red zone) and the levels below 30% to be lower risk (green zone). So, more and more stocks within the index are starting to decline. This weak “breadth” or participation could be a signal of a change in trend.

Bullish Percent

I’m not necessarily a big user of economic indicators. I believe the stock indexes are the leading indicator for the economy, so that’s my guide. However, I have a strong sense of situational awareness so I like to understand what in the world is going on. The total return of stocks is a function of three things: earnings growth + dividend yield + P/E ratio expansion or contraction. Since earnings growth has made up nearly 5% of the historical total return of the S&P 500 since 1926, it does matter in the big picture in regard to expected return. Today, we observe the headline in the Wall Street Journal:

GDP Slows to Weakest Growth in Three Years

The U.S. economy’s output grew at the slowest pace in three years during the first quarter, underscoring the challenges facing the Trump administration as it seeks to rev up growth.

The New York Times says:

G.D.P. Report Shows U.S. Economy Off to Slow Start in 2017

■ The economy barely grew, expanding at an annual rate of only 0.7 percent.

■ The growth was a sharp decline from the 2.1 percent annual rate recorded in the final quarter of last year. It was the weakest quarterly showing in three years.

■ Consumption, the component reflecting individual spending, rose by only 0.3 percent, well below the 3.5 percent rate in the previous quarter.

The Takeaway

The first-quarter performance upset expectations for a Trump bump at the start of 2017.

If you want an economic catalyst for why prices could stall or reverse down, there you go. You see, earnings growth of stocks is part of GDP. GDP is the sales of all U.S. companies, private and public. The earnings growth of the S&P 500 is the earnings of those 500 companies. In other words, GDP of the economy is highly connected to EPS of an index of 500 stocks.

This recent stall in the price trend and economic growth along with a dash of complacency comes at a time when stocks are “significantly overvalued”, according to my friend Ed Easterling at Crestmont Research:

“In the first quarter the stock market surged 5.5%, well more than underlying economic growth. As a result, normalized P/E increased to 29.4—significantly above the level justified by low inflation and low interest rates. The current status remains “significantly overvalued.” The level of volatility plunged over the past quarter and is now in the lowest 4% of all periods since 1950. The trend in reported earnings for the S&P 500 Index reflects a repeating pattern of overly-optimistic analysts’ forecasts. Earnings and volatility should be watched closely and investors should heighten their sensitivity to the risks confronting an increasingly vulnerable market.”

Oh, and one more thing: Monday will be May. I’m not a huge fan of using seasonality as an indicator to enter or exit the stock market, but there is some tendency for certain periods to gain or lose value historically. For example, a common seasonality is “Sell in May and go away”. Depending on the historical time frame you look and which index, some periods show a “summer slump”. One theory is many investors and traders go on vacation in the summer, so volume is light. They return after the summer and take more action.

So, maybe this will be a good time to sell in May and go away. Not because it’s May, but instead because the weight of the evidence suggests this could be an inflection point.

We’ll see.

Name ONE thing money can’t buy?

money business finance investment

Name ONE thing money can’t buy? asked a friend on Facebook that got responses like happiness, respect, health, love, freedom, and class.

My answer:

Anything.

Money itself can’t buy anything.

Money is a medium of exchange. It is used to facilitate the trade of things between people.

For example, we can trade our time for money or our money for time.

It is people who buys things with it, saves it, or invests it.

Money itself doesn’t buy anything.

It’s what people do with their money that determines its usefulness for them. Perceptions about money are an individual preference based on individual circumstances.

Let’s consider the replies about happiness, respect, health, love, freedom, and class.

Money can’t buy happiness?

Happiness is a mental or emotional state of well-being defined by positive or pleasant emotions ranging from contentment to intense joy.

So, it depends on what makes you happy.

If being at home with the family makes you happy, having more money can facilitate that if you don’t have to leave home for work. If traveling and new experiences make you happy, money can allow you to do it. If playing more golf makes you happy then having an abundance of money allows you the freedom to do the things makes you happy.

But, you have to use your money in a way that makes you happy. Money itself doesn’t do it for you.

Money can’t buy respect?

Respect is a feeling of deep admiration for someone or something elicited by their abilities, qualities, or achievements. Money itself isn’t going to buy us any respect. However, the source of our money and what we do with it may lead to greater respect.

Money itself isn’t going to buy us any respect. However, the source of our money and what we do with it may lead to greater respect. If respect is admiration of abilities, qualities, or achievements, then those things may also lead to more money than less. Money is a medium of exchange, so money is measured and valued to be exchanged for other things.

We have to admit that some of our abilities and achievements can be measured in monetary terms. Professionally, money is the direct exchange from our abilities and achievements. So, someone may not respect us for how much money we have, but they may respect us for what we did to earn it. Money is the measure of whether or not our abilities, qualities, or achievements have paid off. Maybe you know someone who speaks highly of their abilities, qualities, and achievements but never has money, wants to borrow money from you, or is jealous of other people who have money.

Money can’t buy Love?

Can’t buy me love, love
Can’t buy me love

I’ll buy you a diamond ring my friend if it makes you feel alright
I’ll get you anything my friend if it makes you feel alright
Cos I don’t care too much for money, and money can’t buy me love

I’ll give you all I got to give if you say you’ll love me too
I may not have a lot to give but what I got I’ll give to you
I don’t care too much for money, money can’t buy me love
Can’t buy me love, everybody tells me so
Can’t buy me love, no no no, no

Love is or warm personal attachment or an intense feeling of deep affection.

Money doesn’t buy anything itself, so it doesn’t buy love.

But, if you spend your money buying flowers or golf balls to express your affection for another you may discover it leads to greater love.

To be sure, just try it.

If that doesn’t work, buy them some wine.

The reality is, when we spend some money expressing our affection for others we may get some affection in return.

Or, maybe a day hug and kiss will do.

Money can’t buy health?

Health is a state of complete physical, mental, and social well-being and not merely the absence of disease or infirmity.

Since much of health is about staying fit, eating healthy, and a good state of mind, it seems that more money can lead to better health than less. For example, if we have the freedom with our time to get out and walk or train in a gym we may stay more healthy. If we have the money to afford medical care and advanced treatment we may live more healthy. If we don’t have the stress that comes with a lack of money we may have a better overall well-being. But, we have to choose a healthier lifestyle.

We can have less stress and better health without money I suppose, but it seems we need some level of money to achieve good health.

Money can’t buy class?

Classy means elegant, stylish, or having high standards of personal behavior. So, “classy” is certainly relative and dependent.

Class is a tricky one, since “being classy” is very relative and a personal preference.

For example, an aristocratic Southern family may consider going out hunting on horseback to be “classy”. Someone living on a golf course and country club considers their lifestyle to be “classy” and may think horseback riding and hunting is the opposite of “classy”. Those aristocratic Southerners who live on fine farms that ride horses and hunt believe those who live on golf courses are far from “classy”. Someone in New York City may believe walking on concrete to eat in a crowded restaurant in a suit and dress is “classy”.Maybe all of them are “classy”, but in different ways.

Money doesn’t buy anything, so it can’t buy class, either. But, if you want to be classy I suppose you could buy some classes on being classy or money buys the time to spend learning how to be classy if you aren’t already “classy”.  But, class is a relative thing. What is considered classy depends on the person.

My suggestion: be who you really are. Some may consider you classy, others may not. You may not care – if you have enough money!

Money can’t buy freedom?

freedom

Freedom is the power or right to act, speak, or think as one wants without hindrance or restraint.

To better understand who can do that, consider who can’t. Who can’t act, speak, or think as one wants without hindrance or restraint? What may prevent someone from acting, speaking, or thinking as one wants without hindrance or restraint?

You got it.

When you have financial freedom, you not only have the abundance of money to do what you want, when you want, but you also have more freedom to act, speak, or think as one wants without hindrance or restraint.

Money itself can’t buy anything.

It is people who buys things with it, saves it, or invests it.

Money is just the medium of exchange.

What you choose to do with it determines its usefulness, to you.

What you choose to do with money determines if it leads to happiness, respect, health, love, and freedom, for you.

If you have enough money that it allows you the freedom to do what you want, when you want, and with whom you want, you decide what you get in exchange from it.

The reality is, saving and investing money and spending it wisely can lead to greater happiness, freedom, health, respect, and even love if that’s what you want.

Asymmetric Volatility

Volatility is how quickly and how far data points spread out.

Asymmetric is not identical on both sides, imbalanced, unequal, lacking symmetry.

This time of year we are reminded of asymmetric volatility in the weather. The wide range in the temperature is highlighted in the morning news.

This morning, it’s 72 degrees and sunny down south and below freezing and snowing up north.

asymmetric-volatility

Source: MyRadar

Some of the news media presents the variation in a way that invites relative thinking. Just like the financial news programs that show what has gained and lost the most today, the weather shows the extreme highs and lows.

Those who watch the financial news may feel like they missed out on the stock or market that gained the most, then be glad they weren’t in one that lost the most. Some feelings may be more asymmetric: they feel one more than the other.

Prospect Theory says most of us feel a loss much greater that we do a gain. It’s another asymmetry: losses hurt more than gains feel good (loss aversion).

If you are up north trying to stay warm, you may wish you were down south sitting on the beach.

If you are down south trying to stay cool, you may wish you were up north playing in the snow!

It really doesn’t matter how extreme the difference is (the volatility). The volatility is what it is. Volatility is just a range.

What matters is what we want to experience.

If we want to experience snow we can fly up north.

If we want to experience sunny warmth we can fly down south.

If we want less volatility, we could live down south in the winter and up north in the summer.

We get to decide what we experience.

Each of us tends to think we see things as they are, that we are objective. But this is not the case. We see the world, not as it is, but as we are—or, as we are conditioned to see it. When we open our mouths to describe what we see, we in effect describe ourselves, our perceptions, our paradigms.”

– The Seven Habits of Highly Effective People: Powerful Lessons in Personal Change by Stephen R. Covey, Quote Page 28 (2004)

We see the world not as it is but as we are

What would Warren Buffett do?

Few investors have gotten as much media attention than Warren Buffett. He is considered to be the most famous investor in the world. Buffett is the chairman, CEO and largest shareholder of Berkshire Hathaway (BRK.A) and is consistently ranked among the world’s wealthiest people. He earned his money investing. Buffett is often referred to as the “Oracle of Omaha”. Plenty has been said about his performance over the decades.

Below is an interesting view of the Total Return (Price + Dividends) of his Berkshire Hathaway (BRK.A). The chart shows the “% off high” to see its drawdowns. A drawdown is how much a price trend declines from a previous high before it recovers the decline. Berkshire Hathaway (BRK.A) has so far declined -17.2% from its high. During the bear market 2007 to 2009 it declined -50%.

Warren Buffett Berkshire Hathaway

Though -10% declines are fairly common for stocks, 2011 was the last year that stocks declined more than -15% within the year. During 2011, Berkshire Hathaway (BRK.A) dropped about -23% before recovering and eventually trending to new highs.

BERKSHIRE Hathaway 2011

Warren Buffett is 85 years old and has been doing this a very long time. He certainly has some tolerance for stock market declines.

What do you think Warren Buffett is doing right now? 

The successful will do on a daily basis…

“The successful will do on a daily basis what the average won’t consider doing even once.” – Mike Shell

The four most dangerous words…

Every new moment is necessarily unique – we’ve never been “here” before. Probabilities and potential payoffs change based on the stage of the trend or cycle. For example, the current decline in stocks is no surprise, given the stage and magnitude of the prior trends. A few see evidence of the early stages of a bigger move, others believe it’s different this time. We’ll see how it all unfolds. I don’t have to know what’s going to happen next – I am absolutely certain of what I will do given different conditions.

To quote from fellow Tennessean, Sir John Templeton:

“The four most dangerous words in investing are, it’s different this time.”

Sir John Templeton

Sir John Templeton

source: http://www.templeton.org

Here’s to the crazy ones. The misfits. The rebels. The troublemakers. The round pegs in the square holes. The ones who see things differently. They’re not fond of rules. And they have no respect for the status quo. You can quote them, disagree with them, glorify or vilify them. About the only thing you can’t do is ignore them. Because they change things. They push the human race forward. And while some may see them as the crazy ones, we see genius. Because the people who are crazy enough to think they can change the world, are the ones who do.”

Steve Jobs

Steve Jobs

Using the Month of September to Understand Probability and Expectation

probabilty-coin-flip

September is the month when the U.S. stock market’s three most popular indexes usually perform the poorest. So say the headlines every September.

I first wrote this in September 2013 after many commentators had published information about the seasonality of the month of September. Seasonality is the historical tendency for certain calendar periods to gain or lose value. However, when commentators speak of such probabilities, they rarely provide a clear probability and almost never the full mathematical expectation.  Without the mathematical expectation, probability alone is of little value or no value. I’ll explain why.

For those of us focused on actual directional price trends it may seem a little silly to discuss the historical probability of gain or loss for a single month. However, even though I wouldn’t make decisions based on it, we can use the seasonal theme to explain the critical importance of both probability and mathematical expectation.

“From 1928-2012 the S&P 500 was up 39 months and down 46 months in September. It is down 55% of the time in September…”

“Dow Jones Industrial Average 1886-2004 (116 years) 49 years the Dow was up in September, in 67 years the Dow was down in September. It’s down 58% of the time in September…”

Those are probability statements. But they say nothing about how much it was up or down.

First, let’s define probability.

Probability is likelihood. It is a measure or estimation of how likely it is that something will happen or that a statement is true. Probabilities are given a range of value between 0% chance (it will not happen) and 100% chance (it will happen). There are few things so certain as 0% and 100%, so most probabilities fall in between. The higher the degree of probability, the more likely the event is to happen, or, in a longer series of samples, the greater the number of times such event is expected to happen.

But that says nothing about how to calculate probability and apply it. One thing to realize about probability is that it is the math for dealing with uncertainty. When we don’t know an outcome, it is uncertain. It is probabilistic, not a sure thing. Probability provides us our best estimation of the outcome.

As I see it, there are two ways to calculate probability: subjectively and objectively.

Subjective Probability: assigns a likelihood based on opinions and confidence (degree of belief) in those opinions. It may include “expert” knowledge as well as experimental data. For example, the majority of the research and news is based on “expert opinion”. They may state their belief and then assign a probability: “I believe the stock market has a X% chance of going down.” They may go on to add a good sounding story to support their hypothesis. You may see how that is subjective.

Objective Probability: assigns a likelihood based on numbers. Objective probability is data-driven. The popular method is frequentist probability: the probability of a random event means the relative frequency of occurrence of an experiment’s outcome when the experiment is repeated. This method believes probability is the relative frequency of outcomes over the long run. We can think of it as the historical tendency of the outcome. For example, if we flip a fair coin, its probability of landing on heads is 50% and tails is 50%. If we flip it 10 times, it could land on heads 7 and tails 3. That outcome implies 70%/30%. To prove the coin is “fair” (balanced on both sides), we would need to flip it more times to get a large enough sample size to realize the full probability. If we flip it 30 times or more it is likely to get closer and closer to 50%/50%. The more frequency, the closer it gets to its probability. You may see see why I say this is more objective: it’s based on actual historical data.

If you are a math person and logical thinker, you may get this. I have a hunch many people don’t like math, so they’d rather hear a good story. Rather than checking the stats on a game, they’d rather hear some guru’s opinion about who will win.

Which has more predictive power? An expert opinion or the fact that historically the month of September has been down more often than it’s up? Predictive ability needs to be quantified by math to determine if it exists and opinions are often far too subjective to do that. We can do the math based on historical data and determine if it is probable, or not.

As I said in September is statistically the worst month for the stock market the data shows it is indeed statistically significant and does indeed have predictive ability, but not necessarily enough to act on it. Instead, I suggest it be used to set expectations of what may happen: the month of September has historically been the worst performance month for the stock indexes. So, we shouldn’t be surprised if it ends in the red. It’s that simple.

Theory-driven researchers want a cause and effect story to go with their beliefs. If they can’t figure out a good reason behind the phenomenon, they may reject it even though the data is what it is. One person commented to me that he didn’t believe the September data has predictive value, even though it does, and he provided nothing to disprove it. Probabilities do need to make sense. Correlations can occur randomly, so logical reasoning behind the numbers may be useful. For example, one theory for a losing September is it is the fiscal year end of many mutual funds and fund managers typically sell losing positions before year end to realize losses to offset gains.

I previously stated a few different probabilities about September: what percentage of time the month is down. In September is statistically the worst month for the stock market I didn’t mention the percent of time the month is negative, only that on average it’s down X% since Y. It occurred to me that most people don’t seem to understand probability and more importantly, the more complete equation of expectation.

Expectation

There are many different ways to define expectation. We may initially think of it as “what we expect to happen”. In many ways, it’s best not to have expectations about the future. Our expectations may not play out as we’d hoped. If we base our investment decisions on opinion and expectations don’t pan out, we may stick with our opinion anyway and eventually lose money. The expectation I’m talking about is the kind that I apply: mathematical expectation.

So far, we have determined probability of September based on how many months it’s down or up. However, probability alone isn’t enough information to make a logical decision. First of all, going back to 1950 using the S&P 500 stock index, the month of September is down about 53% of the time and ends the month positive about 47% of the time. That alone isn’t a huge difference, but what makes it more meaningful is the expectation. When it’s down 53% of the time, it’s down -3.8% and when it’s up 47% of the time it’s up an average of 3.3%. That results in an expected value of -0.50% for the month of September. If we go back further to 1928, which includes the Great Depression, it’s about  -1.12%.

The bottom line is the math says “based on historical data, September has been the worst month for the stock market”. We could then say “it can be expected to be”. But as I said before, it may not be! And, another point I have made is the use of multiple time frames for looking at the data, which is a reminder that by intention: probability is not exact. It can’t be, it’s not supposed to be, and doesn’t need to be! Probability and expectation are the maths of uncertainty. We don’t know in advance many outcomes in life, but we can estimate them mathematically and that provides a sound logic and a mathematical basis for believing what we do.

We’ve made a whole lot of the month of September, but I think it made for a good opportunity to explain probability and expectation that are the essence of portfolio management. It doesn’t matter so much how often we are right or wrong, but instead the probability and the magnitude. Asymmetric returns are created by more profit, less loss. Mathematical expectation provides us a mathematical basis for believing a method works, or not. Not knowing the future; it’s the best we have.

Rather than seasonal tendencies, I prefer to focus on the actual direction of global price trends and directly manage the risk in individual my positions.

Enter your email address to subscribe to this blog and receive notifications of new posts by email.

Connect with me on Linkedin and Follow me on Twitter

The secret to being successful from a trading perspective is to have an indefatigable and an undying and unquenchable thirst for information and knowledge.

Paul Tudor Jones

Paul Tudor Jones

Source: http://www.newtraderu.com/2015/04/07/paul-tudor-jones-10-trading-principles/

“Nobody who ever gave his best regretted it.”

– George Halas

Nobody who ever gave his best regretted it

Image source: https://www.pinterest.com/pin/375346950164355711/

The Southern Voice: What You Don’t Know About the South and the Southern Accent

Asymmetric Information is when someone has superior or more knowledge than others about a topic. The Illusion of Asymmetric Insight occurs when people perceive their knowledge of others to surpass other people’s knowledge of themselves. An asymmetric advantage goes beyond a normal advantage of knowledge into the realm of having asymmetric information and knowing things others do not.

Over the past few weeks, there has been much in the media about the Confederate Battle flag and misinformation about the South. As it turns out, it seems many people may be more ignorant about these things than they believe they are. So you think the “Southern Accent” is bad English? Au contraire.

In Southern American English, Wikipedia says:

“The Southern U.S. dialects make up the largest accent group in the United States”

Wikipedia cites PBS as the source: “Do You Speak American: What Lies Ahead.” Specifically, that article says: 

  • Due to a huge migration to the South and Southwest and the national appeal of country music, Southern speech is now the largest accent group in the United States.
  • The dominant form is what linguists call Inland Southern…

As a Southerner myself, I have always known my Southern dialect is derived from my European ancestors. If you aren’t from the South or weren’t taught its history, you may not realize that. Most of the settlers in Appalachia and the South came from Scotland, Ireland, the British Isles. If you know anything about those areas and their people, you can probably see how they may have been attracted to the mountains of Tennessee, north Georgia, and North Carolina. Its geography is similar to their motherland. Oh, and they made whiskey and moonshine.

Researchers have noted that the dialect retains a lot of vocabulary with roots in Scottish “Elizabethan English” owing to the make-up of the early European settlers to the area.

Source: “The Dialect of the Appalachian People.” Wvculture.org. Retrieved 2012-11-08.

Oh, and they sang fiddle songs like Rocky Top! This is the origin of what has evolved today as “country music.” They blended popular songs, Irish and Celtic fiddle tunes, and various musical traditions from European immigrant communities.

That leads to this very interesting video clip from the History Channel “You Don’t Know Dixie” explaining the many versions of the Southern Accent:

Want to learn more about the South? Search for the History Channel show “You Don’t Know Dixie” at your cable provider. I found it on Verizon and recorded it. Or, it’s available at Amazon.


Mike Shell is the Founder and Chief Investment Officer of Shell Capital Management, LLC, and the portfolio manager of ASYMMETRY® Global Tactical.

Mike Shell and Shell Capital Management, LLC is a registered investment advisor and provides investment advice and portfolio management exclusively to clients with a signed and executed investment management agreement. The observations shared on this website are for general information only and should not be construed as advice to buy or sell any security. Securities reflected are not intended to represent any client holdings or any recommendations made by the firm. Investing involves risk including the potential loss of principal an investor must be willing to bear. Past performance is no guarantee of future results. All information and data is deemed reliable, but is not guaranteed and should be independently verified. The presence of this website on the Internet shall in no direct or indirect way raise an implication that Shell Capital Management, LLC is offering to sell or soliciting to sell advisory services to residents of any state in which the firm is not registered as an investment advisor. Use of this website is subject to its terms and conditions.

Uncharted Territory from the Fed Buying Stocks

I remember sometime after 2013 I told someone “The Fed is buying stocks and that’s partly why stocks have risen so surprisingly for so long”. He looked puzzled and didn’t seem to agree, or understand.

The U.S. Federal Reserve (the “Fed”) has been applying “quantitative easing” since the 2007 to 2009 “global financial crisis”. Quantitative easing (QE) is a type of monetary policy used by central banks to stimulate the economy when standard monetary policy has become ineffective. The Fed implements quantitative easing by buying financial assets from banks and other financial institutions. That raises the prices of those financial assets and lowers their interest rate or yield. It also increases the amount of money available in the economy. The magnitude they’ve done this over the past seven years has never been experience before. They are in uncharted territory.

I was reminded of what I said, “the Fed is buying stocks” when I read comments from Bill Gross in “Gross: Fed Slowly Recognizing ZIRP Has Downside Consequences”. He says companies are using easy money to buy their own stock:

Low interest rates have enabled Corporate America to borrow hundreds of billions of dollars “but instead of deploying the funds into the real economy,they have used the proceeds for stock buybacks. Corporate authorizations to buy back their own stock are running at an annual rate of $1.02 trillion so far in 2015, 18 percent above 2007’s record total of $863 billion, Gross said.

You see, if we want to know the truth about market dynamics; we necessarily have to think more deeply about how markets interact. Market dynamics aren’t always simple and obvious. I said, “The Fed is buying stocks” because their actions is driving the behavior of others. By taking actions to increase money supply in the economy and keep extremely low borrowing rates, the Fed has been driving demand for stocks.

But, it isn’t just companies buying their own stock back. It’s also investors buying stocks on margin. Margin is borrowed money that is used to purchase securities. At a brokerage firm it is referred to as “buying on margin”. For example, if we have $1 million in a brokerage account, we could borrow another $1 million “on margin” and invest twice as much. We would pay interest on the “margin loan”, but those rates have been very low for years. Margin interest rates have been 1 – 2%. You can probably see the attraction. If we invested in lower risk bonds earning 5% with $1 million, we would normally earn 5%, or $50,000 annually. If we borrowed another $1 million at 2% interest and invested the full $2 million at 5%, we would earn another 3%, or $30,000. The leverage of margin increased the return to 8%, or $80,000. Of course, when the price falls, the loss is also magnified. When the interest rate goes up, it reduces the profit. But rates have stayed low for so long this has driven margin demand.

While those who have their money sitting in in bank accounts and CDs have been brutally punished by near zero interest rates for many years, aggressive investors have borrowed at those low rates to magnify their return and risk in their investments. The Fed has kept borrowing costs extremely low and that is an incentive for margin.

In the chart below, the blue line is the S&P 500 stock index. The red line is NYSE Margin Debt. You may see the correlation. You may also notice that recessions (the grey area) occur after stock market peaks and high margin debt balances. That’s the downside: margin rates are at new highs, so when stocks do fall those investors will either have to exit their stocks to reduce risk or they’ll be forced to exit due to losses. If they don’t have a predefined exit, their broker has one for them: “a margin call”.

Current Margin Debt Stock MarginSource: http://www.advisorperspectives.com/dshort/charts/markets/nyse-margin-debt.html?NYSE-margin-debt-SPX-since-1995.gif

If you noticed, I said, “They are in uncharted territory”. I am not. I am always in uncharted territory, so I never am. I believe every new moment is unique, so I believe everyone is always in uncharted territory. Because I believe that, I embrace it. I embrace uncertainty and prepare for anything that can happen. It’s like watching a great movie. It would be no fun if we knew the outcome in advance.


The right to disagree…

ayn rand the right to agree with others is not the problem in any society it is the right to disagree that is crucial

My 2 Cents on the Dollar, Continued…

In My 2 Cents on the Dollar I explained how the U.S. Dollar is a significant driver of returns of other markets. For example, when the U.S. Dollar is rising, commodities like gold, oil, and foreign currencies like the Euro are usually falling. A rising U.S. Dollar also impacts international stocks priced in U.S. Dollars. When the U.S. Dollar trends up, many international markets priced in U.S. Dollars may trend down (reflecting the exchange rate). Many trend followers and global macro traders are likely “long the U.S. Dollar” by being long and short other markets like commodities, international stocks, or currencies.

Below was the chart from My 2 Cents on the Dollar last week to show the impressive uptrend and since March a non-trending indecisive period. After such a period, I suggested the next break often determines the next directional trend.

dollar trend daily 2015-04-23_16-05-04

Chart created by Shell Capital with: http://www.stockcharts.com

Keep in mind, this is looking closely at a short time frame within a larger trend. Below is the updated chart today, a week later. The U.S. Dollar did break down so far, but by my math, it’s now getting to an even more important point that will distinguish between a continuation of the uptrend or a reversal. This is the point where it should reverse back up, if it’s going to continue the prior uptrend.

U.S. Dollar

Chart created by Shell Capital with: http://www.stockcharts.com

This is a good example of understanding what drives reward/risk. I consider how long the U.S. Dollar I am (by being synthetically long/short other markets) and how that may impact my positions if the trend were to reverse. It’s a good time to pay attention to it to see if it breaks back out to the upside to resume the uptrend, or if it instead breaks down to end it.

That’s my two cents on the Dollar… How long are you?

Stage and Valuation of the U.S. Stock Market

In The REAL Length of the Average Bull Market last year I pointed out different measures used to determine the average length of a bull market. Based on that, whether you believe the average bull market lasts 39 months, 50 months, or 68 months, it seems the current one is likely very late in its stage at 73 months. It’s one of the longest, ever.

I normally don’t consider valuations levels like P/E ratios, but they do matter when it comes to secular bull and bear markets (10 to 20 year trends). That’s because long-term bull markets begin at low valuation levels (10 or below) and have ended at historically high levels (around 20). Currently, the S&P 500 is trading at 27. That, along with the low dividend yield, suggests the expected return for holding that index going forward is low.

Ed Easterling of Crestmont Research explains it best:

The stock market gyrated since the start of the year, ending the first quarter with a minimal gain of 0.4%. As a result, normalized P/E was virtually unchanged at 27.3—well above the levels justified by low inflation and interest rates. The current status remains near “significantly overvalued.”

In addition, the forecast by Standard and Poor’s for 2015 earnings per share (EPS) recently took a nosedive, declining 17% during one week in the first quarter. Volatility remains unusually low in its cycle. The trend in earnings and volatility should be watched closely and investors should remain cognizant of the risks confronting an increasingly vulnerable market.

Source: The P/E Report: Quarterly Review Of The Price/Earnings Ratio By Ed Easterling April 4, 2015 Update

It’s always a good time to actively manage risk and shift between global markets rather than allocate to them. To see what that looks like, visit: http://www.asymmetrymanagedaccounts.com/global-tactical/

The Volatility Index (VIX) is Getting Interesting Again

In the last observation I shared on the CBOE Volatlity index (the VIX) I had been pointing out last year the VIX was at a low level and then later started trending up. At that time, many volatility traders seemed to think it was going to stay low and keep going lower – I disagreed. Since then, the VIX has remained at a higher average than it had been – up until now. You can read that in VIX® gained 140%: Investors were too complacent.

Here it is again, closing at 12.45 yesterday, a relatively low level for expected volatility of the S&P 500 stocks. Investors get complacent after trends drift up, so they don’t price in so much fear in options. Below we observe a monthly view to see the bigger picture. The VIX is getting down to levels near the end of the last bull market (2007). It could go lower, but if you look closely, you’ll get my drift.

Chart created by Shell Capital with: http://www.stockcharts.com

Next, we zoom in to the weekly chart to get a loser look.

Chart created by Shell Capital with: http://www.stockcharts.com

Finally, the daily chart zooms in even more.

Chart created by Shell Capital with: http://www.stockcharts.com

The observation?

Options traders have priced in low implied volatility – they expect volatility to be low over the next month. That is happening as headlines are talking about stock indexes hitting all time highs. I think it’s a sign of complacency. That’s often when things change at some point.

It also means that options premiums are generally a good deal (though that is best determined on an individual security basis). Rather than selling premium, it may be a better time to buy it.

Let’s see what happens from here…

My 2 Cents on the Dollar

The U.S. Dollar ($USD) has gained about 20% in less than a year. We observe it first in the weekly below. The U.S. Dollar is a significant driver of returns of other markets. For example, when the U.S. Dollar is rising, commodities like gold, oil, and foreign currencies like the Euro are usually falling. A rising U.S. Dollar also impacts international stocks priced in U.S. Dollar. When the U.S. Dollar trends up, many international markets priced in U.S. Dollars may trend down (reflecting the exchange rate). The U.S. Dollar may be trending up in anticipation of rising interest rates.

dollar trend weekly 2015-04-23_16-04-40

Chart created by Shell Capital with: http://www.stockcharts.com

Now, let’s observe a shorter time frame- the daily chart. Here we see an impressive uptrend and since March a non-trending indecisive period. Many trend followers and global macro traders are likely “long the U.S. Dollar” by being long and short other markets like commodities, international stocks, or currencies.

dollar trend daily 2015-04-23_16-05-04

Chart created by Shell Capital with: http://www.stockcharts.com

This is a good example of understanding what drives returns and risk/reward. I consider how long the U.S. Dollar I am and how that may impact my positions if this uptrend were to reverse. It’s a good time to pay attention to it to see if it breaks back out to the upside to resume the uptrend, or if it instead breaks down to end it. Such a continuation or reversal often occurs from a point like the blue areas I highlighted above.

That’s my two cents on the Dollar…

How long are you? Do you know?

Asymmetric Nature of Losses and Loss Aversion

Loss Aversion:

“In prospect theory, loss aversion refers to the tendency for people to strongly prefer avoiding losses than acquiring gains. Some studies suggest that losses are as much as twice as psychologically powerful as gains. Loss aversion was first convincingly demonstrated by Amos Tversky and Daniel Kahneman.”

For most people, losing $100 is not the same as not winning $100. From a rational point of view are the two things the same or different?

Most economists say the two are the same. They are symmetrical. But I think that ignores some key issues.

If we have only $10 to eat on today and that’s all we have, if we lose it, we’ll be in trouble: hungry.

But if we have $10 to eat on and flip a coin in a bet and double it to $20, we may just eat a little better. We’ll still eat. The base rate: survival.

They say rationally the two are the same, but that isn’t true. They aren’t the same. The loss makes us worse off than we started and it may be totally rational to feel worse when we go backward than we feel good about getting better off. I don’t like to go backward, I prefer to move forward to stay the same.

Prospect Theory, which found people experience a loss more than 2 X greater than an equal gain, discovered the experience of losses are asymmetric.

Actually, the math agrees.

You see, losing 50% requires a 100% gain to get it back. Losing it all is even worse. Losses are indeed asymmetric and exponential on the downside so it may be completely rational and logical to feel the pain of losses asymmetrically. Experience the feeling of loss aversions seems to be the reason a few of us manage investment risk and generate a smoother return stream rather than blow up.

To see what the actual application of asymmetry to portfolio management looks like, see: Shell Capital Management, LLC.


asymmetry impact of loss

US Government Bonds Rise on Fed Rate Outlook?

I saw the following headline this morning:

US Government Bonds Rise on Fed Rate Outlook

Wall Street Journal –

“U.S. government bonds strengthened on Monday after posing the biggest price rally in more than three months last week, as investors expect the Federal Reserve to take its time in raising interest rates.”

My focus is on directional price trends, not the news. I focus on what is actually happening, not what people think will happen. Below I drew a 3 month price chart of the 20+ Year Treasury Bond ETF (TLT), I highlighted in green the time period since the Fed decision last week. You may agree that most of price action and directional trend changes happened before that date. In fact, the long-term bond index declined nearly 2 months before the decision, increased a few weeks prior, and has since drifted what I call “sideways”.

fed decision impact on bonds
Charts created with http://www.stockcharts.com

To be sure, in the next chart I included an analog chart including the shorter durations of maturity. iShares 3-7 Year Treasury Bond ETF (IEI) and iShares 7-10 Year Treasury Bond ETF (IEF). Maybe there is some overreaction and under-reaction going on before the big “news”, if anything.

Government bonds Fed decision reaction
Do you still think the Fed news was “new information“?

Dazed and Confused?

Many investors must be dazed and confused by the global markets reaction to the Fed. I’m guessing most people would expect if the Fed signaled they are closer to a rate hike the stock and bond markets would fall. Rising interest rates typically drive down stocks along with bonds. Just the opposite has happened, so far.

Markets seems to have moved opposite of expectations, those people have to get on board (increasing demand).

A few things I wrote before and after the Fed decision:

A One-Chart Preview of Today’s Fed Decision: This is what economists are expecting

Fed Decision and Market Reaction: Stocks and Bonds

Trends, Countertrends, in the U.S. Dollar, Gold, Currencies

A One-Chart Preview of Today’s Fed Decision: This is what economists are expecting

I can’t image what it must be like sitting around watching and reading the news trying to figure out what the Fed is going to do next. Even if they could know, they still don’t know how the markets will react. New information may under-react to the news or overreact. Who believed there would be no inflation? bonds would have gained so much? the U.S. dollar would be so strong? Gold and oil would be so low? Expectations like that are a tough way to manage a portfolio. I instead predefine my risk and identify the actual direction and go with it. Others believe it comes down to a single word…

Bloomberg says: Here’s a One-Chart Preview of Today’s Fed Decision: This is what economists are expecting

By far the biggest question is whether the Fed will drop the word “patient” from its statement. If it does drop the word, it creates the possibility of a June rate hike, and it will mark the first time since the financial crisis that the Fed is offering no specific forward guidance as to when rate hikes will come.

About 90 percent of economists surveyed by Bloomberg expect the Federal Reserve to drop the word “patience” in today’s announcement.

fed decision interest rates

source:http://www.bloomberg.com/news/articles/2015-03-18/here-s-a-one-chart-preview-of-today-s-fed-decision

Diversification Alone is No Longer Sufficient to Temper Risk…

That was the lesson you learned the last time stocks became overvalued and the stock market entered into a bear market.

In a Kiplinger article by Fred W. Frailey interviewed Mohamed El-Erian, the PIMCO’s boss, (PIMCO is one of the largest mutual fund companies in the world) he says “he tells how to reduce risk and reap rewards in a fast-changing world.” This article “Shaking up the Investment Mix” was written in March 2009, which turned out the be “the low” of the global market collapse.

It is useful to revisit such writing and thoughts, especially since the U.S. stock market has since been overall rising for 5 years and 10 months. It’s one of the longest uptrends recorded and the S&P 500 stock index is well in “overvalued” territory at 27 times EPS. At the same time, bonds have also been rising in value, which could change quickly when rates eventually rise. At this stage of a trend, asset allocation investors could need a reminder. I can’t think of a better one that this:

Why are you telling investors they need to diversify differently these days?

The traditional approach to diversification, which served us very well, went like this: Adopt a diversified portfolio, be disciplined about rebalancing the asset mix, own very well-defined types of asset classes and favor the home team because the minute you invest outside the U.S., you take on additional risk. A typical mix would then be 60% stocks and 40% bonds, and most of the stocks would be part of Standard & Poor’s 500-stock index.

This approach is fatigued for several reasons. First of all, diversification alone is no longer sufficient to temper risk. In the past year, we saw virtually every asset class hammered. You need something more to manage risk well.

But, you know, they say a picture is worth a thousand words.

Since we are talking about downside risk, something that is commonly hidden when only “average returns” are presented, below is a drawdown chart. I created the drawdown chart using YCharts which uses total return data and the “% off high”. The decline you see from late 2007 to 2010 is a dradown: it’s when the investment value is under water. Think of this like a lake. You can see how the average of the data wouldn’t properly inform you of what happens in between.

First, I show PIMCO’s own allocation fund: PALCX: Allianz Global Allocation Fund. I include an actively managed asset allocation that is very large and popular with $55 billion invested in it: MALOX: BlackRock Global Allocation. Since there are many who instead believe in passive indexing and allocation, I have also included DGSIX: DFA Global Allocation 60/40 and VBINX: Vanguard Balanced Fund. As you can see, they have all done about the same thing. They declined about -30% to -40% from October 2007 to March 2009. They also declined up to -15% in 2011.

Vanguard DFA BlackRock PIMCO Asset Allcation

Charts are courtesy of http://ycharts.com/ drawn by Mike Shell

Going forward, the next bear market may be very different. Historically, investors consider bond holdings to be a buffer or an anchor to a portfolio. When stock prices fall, bonds haven’t been falling nearly as much. To be sure, I show below a “drawdown chart” for the famous actively managed bond fund PIMCO Total Return and for the passive crowd I have included the Vanguard Total Bond Market fund. Keep in mind, about 40% of the allocation of the funds above are invested in bonds. As you see, bonds dropped about -5% to -7% in the past 10 years.

PIMCO Total Return Bond Vanguard Total Bond

Charts are courtesy of http://ycharts.com/ drawn by Mike Shell

You may have noticed the end of the chart is a drop of nearly -2%. Based on the past 10 years, that’s just a minor decline. The trouble going forward is that interest rates have been in an overall downtrend for 30 years, so bond values have been rising. If you rely on bonds being a crutch, as on diversification alone, I agree with Mohamed El-Erian the Chief of the worlds largest bond manager:

“…diversification alone is no longer sufficient to temper risk. In the past year, we saw virtually every asset class hammered. You need something more to manage risk well.”

But, don’t wait until AFTER markets have fallen to believe it.

Instead, I apply active risk management and directional trend systems to a global universe of exchange traded securities (like ETFs). To see what that looks like, click: ASYMMETRY® Managed Accounts

This is When MPT and VaR Get Asset Allocation and Risk Measurement Wrong

This is When MPT and VaR Get Asset Allocation and Risk Measurement Wrong

I was talking to an investment analyst at an investment advisory firm about my ASYMMETRY® Global Tactical and he asked me what the standard deviation was for the portfolio. I thought I would share with you how the industry gets “asset allocation” and risk measurement and management wrong.

Most people have poor results over a full market cycle that includes both rising and falling price trends, like global bull and bear markets, recessions, and expansions. Quantitative Analysis of Investor Behavior, SPIVA, Morningstar and many academic papers have provided empirical evidence that most investors (including professionals) have poor results over the long periods. For example, they may earn gains in rising conditions but lose their gains when prices decline. I believe one reason is they get too aggressive at peaks and then sell in panic after losses get too large, rather than properly predefine and manage risk.

You may consider, then, to have good results over a long period, I necessarily have to believe and do things very differently than most people.

On the “risk measurement” topic, I will share with you a very important concept that is absolutely essential for truly actively controlling loss. The worst drawdown “is” the only risk metric that really matters. The risk is not the loss itself. Once we have a loss, it’s a loss. It’s beyond the realm of risk. Since risk is the possibility of a loss, how often it has happened in the past and the magnitude of the historical loss is the expectation. Beyond that, we must assume it could be even worse some day. For example, if the S&P 500 stock index price decline was -56% from 2007 to 2009, then we should expect -56% is the loss potential (or worse). When something has happened before, it suggests it is possible again, and we may have not yet observed the worst decline in the past that we will see in the future.

The use of standard deviation is one of the very serious flaws of investors attempting to measure, direct, and control risk. The problem with standard deviation is that the equation was intentionally created to simplify data. The way it is used draws a straight line through a group of data points, which necessarily ignores how far the data actually spreads out. That is, the standard deviation is intended to measure how far the data spreads out, but it actually fails to absolutely highlight the true high point and low point. Instead, it’s more of an average of those points. However, for risk management, it’s the worst-case loss that we really need to focus on. I believe in order to direct and control risk, I must focus on “how bad can it really get”. Not just “on average” how bad it can get. The risk in any investment position is at least how much it has declined in the past. And realizing it could be even worse some day. Standard deviation fails to reflect that in the way it is used.

Consider that as prices trend up for years, investors become more and more complacent. As investors become complacent, they also become less indecisive as they believe the recent past upward trend will continue, making them feel more confident. On the other hand, when investors feel unsure about the future, their fear and indecisiveness is reflected as volatility as the price swings up and down more. We are always unsure about the future, but investors feel more confident the past will continue after trends have been rising and volatility gets lower and lower. That is what the peak of a market looks like. As it turns out, that’s just when asset allocation models like Modern Portfolio Theory (MPT) and portfolio risk measures like Value at Risk (VaR) tell them to invest more in that market – right as it reaches its peak. They invest more, complacently, because their allocation model and risk measures tell them to. An example of a period like this was October 2007 as global stock markets had been rising since 2003. At that peak, the standard deviation was low and the historical return was at its highest point, so their expected return was high and their expected risk (improperly measured as historical volatility) was low. Volatility reverses the other way at some point

What happens next is that the market eventually peaks and then begins to decline. At the lowest point of the decline, like March 2009, the global stock markets had declined over -50%. My expertise is directional price trends and volatility so I can tell you from empirical observation that prices drift up slowly, but crash down quickly. The below chart of the S&P 500 is an example of this asymmetric risk.

stock index asymmetric distribution and losses

At the lowest point after prices had fallen over -50%, in March 2009, the standard deviation was dramatically higher than it was in 2007 after prices had been drifting up. At the lowest point, volatility is very high and past return is very low, telling MPT and VaR to invest less in that asset. This is a form of volatility targeting: investing more at lower levels or historical volatility and less at higher levels.

In the 2007 – 2009 decline in global markets, you may recall some advisors calling it a “6 sigma event”. That’s because the market index losses were much larger than predicted by a standard deviation. For example, if an advisors growth allocation had an average return of 10% in 2007 based on its past returns looking back from the peak and a standard deviation of 12% expected volatility, they only expected the portfolio would decline -26% (3 standard deviations) within a 99.7% confidence level – but the allocation actually lost -40 or -50%. Even if that advisor properly informed his or her client the allocation could decline -26% worse case and the client provided informed consent and acceptance of that risk, their loss was likely much greater than their risk tolerance. When they reach their risk tolerance, they “tap out”. Once they tap out, when do they ever get back in? do they feel better after it falls another -20%? or after it rises 20%? There is no good answer. I want to avoid that situation. I prefer to reduce my exposure to loss in well advance.

You can see in the chart below, 3 standard deviations is supposed to capture 99.7% of all of the data if the data is a normal distribution. The trouble is, market returns are not a normal distribution. Instead, stock market gains and losses present an asymmetrical return distribution. Market returns experience much larger gains and losses than expected from a normal distribution – the outliers are critical. However, those outliers don’t occur very often: historically it’s maybe every 4 or 5 years, so people have time to forget about the last one and become complacent.

symmetry normal distribution bell curve black

Source: http://en.wikipedia.org/wiki/68%E2%80%9395%E2%80%9399.7_rule

My friends, this is where traditional asset allocation like Modern Portfolio Theory (MPT) and risk measures like Value at Risk (VaR) get it wrong.

These methods are the most widely believed and used . You can probably see why most investors do poorly and only a very few do well – an anomaly.

I can tell you that I measure risk by how much I can lose and I control my risk by predefining my absolute risk at the point of entry and my exit point evolves as the positions are held. That is an absolute price point, not some equation that intentionally ignores the outlier losses.

As the stock indexes have now been overall trending up for 5 years and 9 months, the trend is getting aged. In fact, according to my friend Ed Easterling at Crestmont Research, at around 27 times EPS the stock index seems to be in the range of overvalued. In his latest report, he says:

“The stock market surged over the past quarter, adding to gains during 2014 that far exceed underlying economic growth. As a result, normalized P/E increased to 27.2—well above the levels justified by low inflation and interest rates. The current status is approaching “significantly overvalued.”

At the same time, we shouldn’t be surprised to eventually see rising interest rates drive down bond values at some point. It seems from this starting point that simply allocating to stocks and bonds doesn’t have an attractive expected return.

I believe a different strategy is needed, especially form this point forward.

In ASYMMETRY® Global Tactical, I actively manage risk and shift between markets to find profitable directional price trends rather than just allocate to them.


Mike Shell is the Founder and Chief Investment Officer of Shell Capital Management, LLC, and the portfolio manager of ASYMMETRY® Global Tactical.

The observations shared on this website are for general information only and are not specific advice, research, or buy or sell recommendations for any individual. Investing involves risk including the potential loss of principal an investor must be willing to bear. Past performance is no guarantee of future results. The presence of this website on the Internet shall in no direct or indirect way raise an implication that Shell Capital Management, LLC is offering to sell or soliciting to sell advisory services to residents of any state in which the firm is not registered as an investment advisor. Use of this website is subject to its terms and conditions.


The State of the Union: What You Need to Read First

Image source: here

atlas

Before you listen to the State of the Union address tonight, consider reading this very closely:

“Happiness is not to be achieved at the command of emotional whims. Happiness is not the satisfaction of whatever irrational wishes you might blindly attempt to indulge. Happiness is a state of non-contradictory joy—a joy without penalty or guilt, a joy that does not clash with any of your values and does not work for your own destruction, not the joy of escaping from your mind, but of using your mind’s fullest power, not the joy of faking reality, but of achieving values that are real, not the joy of a drunkard, but of a producer. Happiness is possible only to a rational man, the man who desires nothing but rational goals, seeks nothing but rational values and finds his joy in nothing but rational actions.

Just as I support my life, neither by robbery nor alms, but by my own effort, so I do not seek to derive my happiness from the injury of the favor of others, but earn it by my own achievement. Just as I do not consider the pleasure of others as the goal of my life, so I do not consider my pleasure as the goal of the lives of others. Just as there are no contradictions in my values and no conflicts among my desires—so there are no victims and no conflicts of interest among rational men, men who do not desire the unearned and do not view one another with a cannibal’s lust, men who neither make sacrifices nor accept them.

The symbol of all relationships among such men, the moral symbol of respect for human beings, is the trader. We, who live by values, not by loot are traders, both in manner and spirit. A trader is a man who earns what he gets and does not give or take the undeserved. A trader does not ask to be paid for his failures, nor does he ask to be loved for his flaws. A trader does not squander his body as fodder, or his soul as alms. Just as he does not give his work except in trade for material values, so he does not give the values of his spirit—his love, his friendship, his esteem—except in payment and in trade for human virtue, in payment for his own selfish pleasure, which he receives from men he can respect. The mystic parasites who have, throughout the ages, reviled the trader and held him in contempt, while honoring the beggars and the looters, have known the secret motive of the sneers: a trader is the entity they dread—a man of justice.”


Atlas Shrugged
by Ayn Rand

This is John Galt Speaking
Chapter VII

The One Thing: The Surprisingly Simple Truth Behind Extraordinary Results

I had a two-hour interview with someone yesterday (that will be available soon) about my firm and investment programs and found myself sharing a few of the same thoughts, over and over.

“Managing the ASYMMETRY® investment programs is all we do. I am fully committed and focused on this one thing: buying, selling, and managing risk in global markets to generate the positive asymmetry needed to compound capital positively within our risk tolerance”.

In a recent letter to our investors to reflect on the 10-year anniversary of my founding Shell Capital Management, LLC, I described the evolution of the firm, ASYMMETRY®, and myself over 10 pages. I called it “10 years of Shell Capital Management”; Christi called it “10 pages of 10 years of Shell Capital Management”! (When talking about these things, I have no short version!)

That’s because I’m fully committed and focused on this one thing we do. In that letter, I went so far as to say: it’s all I have, all I am, and all I ever will be. As I reflected on the past 10 years, it occurred to me that my whole life has revolved around this one thing. Without it, none of the other things, the lifestyle we enjoy, would exist. I believe my priorities are in line with reality. That has been a tremendous advantage for us.

Then this morning, I get an email from getAbstract: “Top 10 Summaries”, the 10 most downloaded getAbstract summaries in 2014.

The first on the list?

“Achieving great success in all aspects of your life calls for devotion to one single thing.”

The One Thing
The Surprisingly Simple Truth Behind Extraordinary Results

Gary Keller and Jay Papasan
Bard Press, 2013

the one thing The Surprisingly Simple Truth Behind Extraordinary Results

getAbstract goes on to describe it: (I highlighted a key part in bold)

“Gary Keller, co-founder of Keller Williams Realty and a best-selling author, overcame his own issues about focus, which makes his claims about cultivating better habits even more compelling. Multitasking isn’t fruitful, he says, since success requires long periods of laser-like concentration, not scattershot swats. If you find your “ONE Thing,” Keller says, everything else will fall into place. Keller, writing with co-author Jay Papasan, breaks his approach down into manageable steps based on research and experience. With an engaging writing style and plenty of bullet points, this reads much faster than its 200-plus pages”

It says the ONE Thing will bring your life and your work into focus. I obviously don’t need a book to tell me that, but it may help me understand myself better. I’ll be reading the abstract, but also listening to the audiobook version on Audible during my long walks in sunny Florida.

The Holiday Party: Mindset of the Active Risk Manager

holiday parties

I keep hearing of symptoms of this awful virus going around. I’ll spare you of the details, but it involves both ends around the porcelain bowl. We’ve all been there, done that, and probably consider it a “bad outcome”.

Then, we have all these holiday party plans to spend time with friends and family, knowing this ‘bug’ is contagious and spreading. Hearing about it, the natural mindset of the active risk manager is to ask:

“Has anyone at the party had the flu recently?”

You wonder if you’re entering into a high risk of a bad outcome. Most people may not even consider it, and it’s those people who will probably be there spreading it around! I know people who never consider the possibility of a bad outcome; they tend to be the ones who have the worst outcomes, more often. Others may be overly afraid of things that may never happen, so they miss out on life. Some even worry about things they fear so much they experience those things, even when they don’t happen.

The active risk manager internally thinks of risk.

Let’s first use the dictionary to better understand the meaning of “active”:

1. engaged in action; characterized by energetic work, participation, etc.; busy: an active life.

2. being in a state of existence, progress, or motion:

3. involving physical effort and action :active sports.

4. having the power of quick motion; nimble: active as a gazelle.

5. characterized by action, motion, volume, use, participation, etc.

So, let’s say that to be active is to be engaged in action, participate, an active life, progress, nimble, motion, and even a state of existence.

Risk is exposure to the possibility of a bad outcome. When we are speaking of money, risk is the exposure to the possibility of loss. If we incur a loss, that isn’t a risk, that’s an actual loss. Some people believe that uncertainty is risk, but we always have uncertainty. So, risk is the exposure to a chance or possibility of loss. It’s the exposure that is the risk, the chance or possibility is always there. So, your risk of loss is your choice. We decide it in advance.

To manage is to take charge of, handle, direct, govern, or control through action.

A bad outcome in money management may be losing money, or in life it may be anything we perceive as unwanted. We can’t be certain about an outcome. Uncertainty is something we live with every day and in all things, so we may as well embrace it and enjoy not knowing the outcome of things in advance. So, risk is the exposure to a chance or possibility of loss. It’s the exposure that is the risk, the chance or possibility is always there. So, your risk of loss is your choice. We decide it in advance.

So, an active risk manager, like me, is someone who engages in the action of actively and intentionally directing and controlling the exposure to a bad outcome. Because I actively management my risks, I am able to trade and invest in things other people perceive as risky, but they aren’t to me because I define my risk exposure and control it. Because active risk management is not only a learned skill I have advanced for myself but also something that is a natural part of me and who I am, I am also able to live my life enjoying and even embracing change and uncertainty. Yet, I do that initially and naturally thinking of what my risk is. Once I understand my risk, I manage it, and then accept it for what I’ve decided it will be, and then I let it all unfold as it will. I control what I can and let the rest do what it’s going to do.

You see, it’s also a big risk to not experience life. Studies show that happiness is more driven by new experiences than any other thing. Hedonic Adaptation means that we tend to get used to things and adapt, good or bad. Broadening our horizons makes and keeps us happy, doing the same old things leads to a dull and less happy life. Much of our happiness comes from new experiences and change, because we get used to even the finest and fastest new car and eventually it becomes our new normal.

Although I feel a strong obligation to keep myself well, I’m not going to miss spending time with people I enjoy. Instead, I’ll take my chances and deal with, and actively manage, any bad outcome that arises from it. So, consider your risks, then get out there and enjoy yourself with new experiences. Even if you get sick for a few days, that too shall eventually pass.

Merry Christmas!

Tomorrow’s Newspaper: the Future, Part One

People often ask me questions of the future. I guess they figure I have such a strong track record, I must know something about the future.

I paused my time machine, the rest of the world stopped; I took one step forward to see what happens next.

Here is what I saw:

Tomorrows Newspaper What the Future Looks LIke

Source: The Future: a period that doesn’t yet exist.

If anyone sees anything different please take a picture, come back here, now, and post it in the comments for all of us to see.

Small vs. Large Stocks: A Tale of Two Markets (Continued)

A quick follow up to my recent comments about the down trend in smaller company stocks in Playing with Relative Strength and Stock Market Peak? A Tale of Two Markets below is a chart and a few observations:

Rusell 2000 Small Caps vs S&P 500 large caps

Source: Bloomberg/KCG

A few observations of the trend direction, momentum, and relative strength.

  • The S&P 500 index (the orange line) of large company stocks has been  in a rising trend of higher highs and higher lows (though that will not continue forever).
  • The white line is the Russell 2000 small company index has been in a downtrend of lower highs and lower lows, though just recently you may observe in the price chart that it is at least slightly higher than its August high. But it remains below the prior two peaks over the past year. From the time frame in the chart, we could also consider it a “non-trending” and volatile period, but its the lower highs make it a downtrend.
  • The green chart at the bottom shows the relative strength between S&P 500 index of large company stocks and the Russell 2000 small company index. Clearly, it hasn’t taken all year to figure out which was trending up and the stronger trend.
  • Such periods take different tactical trading skills to be able to shift profitability. When markets get choppy, you find out who really knows what they’re doing and has an edge. I shared this changing trend back in May in Stock Market Peak? A Tale of Two Markets.

If you are unsure about the relevance of the big picture regarding these things, read Playing with Relative Strength and Stock Market Trend: reverse back down or continuation? and Stock Market Peak? A Tale of Two Markets.


Markets don’t always react the way investors expect, so I focus on what is actually happening

hedge fund market wizards

I noted the below question and answer between Jack Schwager and Ray Dalio in Jack’s book “Hedge Fund Market Wizards: How Winning Traders Win” (2012). Ray Dalio is the founder of Bridgewater, the largest hedge fund in the world and one of the most successful. I saved it when I read the book as a fine example that markets don’t always react the way people expect, and that is why I focus instead on what is actually happening rather than what could or should happen – but may not. Everything is very transient, coming and going, and it’s funny how some of the same kinds of things happen over and over again. As you read comments below you’ll hear it’s always a similar story, different day. 1982 was the end of a 20 year secular bear market made up of huge swings similar to the past decade and the beginning of the largest bull market on record up to 2000.

Below is Jack Schwager asking a question to Ray Dalio:

Any other early experiences stand out where the market behaved very differently from what you expected?

In 1982, we had worse economic conditions than we do right now. The unemployment rate was over 11 percent. It also seemed clear to me that Latin America was going to default on its debt. Since I knew that the money center banks had large amounts of their capital in Latin American debt, I assumed that a default would be terrible for the stock market. Then boom—in August, Mexico defaulted. The market responded with a big rally. In fact, that was the exact bottom of the stock market and the beginning of an 18-year bull market. That is certainly not what I would have expected to happen. That rally occurred because the Fed eased massively. I learned not to fight the Fed unless I had very good reasons to believe that their moves wouldn’t work. The Fed and other central banks have tremendous power. In both the abandonment of the gold standard in 1971 and in the Mexico default in 1982, I learned that a crisis development that leads to central banks easing and coming to the rescue can swamp the impact of the crisis itself.

Source: Schwager, Jack D. (2012-04-25). Hedge Fund Market Wizards (pp. 54-55). John Wiley and Sons. Kindle Edition.

All of this, everything that is happening and expected to happen, will be reflected in the directional trend and volatility of price. The directional price and range of prices (volatility) will overreact at times and under-react at others, but it will reflect what is actually going on. Because the direction and volatility of price “is” what matters.

Business Cycle: Mean Reversion and Trends

The National Bureau of Economic Research publishes U.S. Business Cycle Expansions and Contractions in the economy. During an expansion, economic growth is rising and during a contraction it is slowing or actually falling.

Below is a chart of their idealized expansion and contraction phases. During each phase, different sectors of the economy are expected to do well or poorly. And, you can see what is happening at a peak and what happens afterwards. At a peak, economic data is strongest and news is good. Then it reverses down eventually. At a trough economic data is at its worst and news is bad, then it turns around. You may think about it and consider where the U.S. economy is now if you have an interest in the stage of the business cycle.

NBER Business Cycle

Source: National Bureau of Economic Research

A few concepts to think about.

Does it trend? Yes, it does. A trend is a directional drift over a time frame. The business cycle typically sees drifts up for 4 or 5 years and drifts down for 1 or 2 years. The trends are asymmetric, as you can see in the chart, the upward drifts tend to last longer and progress at a lower rate of change than the faster declining trends down. It seems that economic data, like prices, do trend over time.

Does it mean revert? Yes, while over shorter time frames of 1 year to 5 years we observe trends in the business cycle, when we look over a full business cycle we see that it oscillates up and down. However, the actual meaning of “mean reversion” means that it oscillates around an average, not just oscillates. If the data above has an average, and it necessarily must, then it does oscillate around that average. It’s just that the range up and down may be far away from the average. That is, the peak and trough in the chart above may stray far away from the actual “average” of the data series. Said another way, the business cycle is really volatile when you consider it over its full cycle because of the magnitude in range from high and low.

For those of you following along, you may see how I’m going to tie this in to something else next week…

Fun with Weather Graphs: A Quant View of Knoxville Relative to Tampa

I recently compared the climate differences between two places I call home: Knoxville, Tennessee and Tampa, Florida. They have very different climates, Knoxville is in the Tennessee mountains, the Tampa Bay/Clearwater/St. Pete area is home of the best beaches in America.  Some of us consider the two the best of both worlds. What you believe depends on your own experience. Knoxville is one of the gateways to the Great Smoky Mountains National Park, the most visited national park in America. It had about 10 million visitors in 2013, which was double the Grand Canyon, the second most visited. The two cities have very different climates in the summer and winter months. We think of Tampa, Florida as hot and sunny. Knoxville is cooler in the summer, chilly in the winter. But that’s just my opinion and description. If we really want to understand the absolute level of temperature, humidity, and sunshine, and relative differences we can apply some quantitative methods and draw some visual graphs between them. Here you will see how I see and understand how I make decisions and draw distinctions. For those who otherwise have difficultly understanding data and graphs, you may find it more interesting to apply the same concepts to the weather.  I’ll share with you my study of Knoxville vs. Tampa weather which I think is a good example of applying historical data to understand what to expect. To do this weather comparison, I used this tool with data from the NOAA Comparative Climate Data.

Summer in Knoxville, Winter in Tampa?

Initially, we can compare the average temperature between Knoxville and Tampa to get a quick visual. We can see some positive asymmetry between the winter and summer months. The average temperature in January is in the 60’s in Tampa and only the 30’s in Knoxville: a 30 degree spread. Yet, the average summer months is only a 10 degree spread. I call that positive asymmetry, because we don’t want it too hot in the summer and we don’t want it too cool in the winter. Tampa has the better tradeoff. But, the flaw of averages is that the actual high and low range can be much wider than we realize, so can gain a better understanding by looking specifically at the highs and lows.

AVERAGE TEMP

average temperature knoxville tampa


Although Knoxville is in the south, it still gets cold in the winter months. If we wanted a “winter home” to avoid those cold winter months, we would first focus on the average low temperature. That is, “how cold does it get”? Comparing the lows allows us to understand how cold it gets. As we see in the chart below, January and February are the coldest months in Knoxville when the low is around freezing. On the other hand, in Tampa the average low is above 50. 50 is chilly, not really cold. Notice the other extreme on the chart is the peak, when the average low in Tampa is over 70 during starting in June through September. We could say that that weather in Knoxville is more volatile throughout the year since it has a wider range of temperatures. We can see the visually by how quickly the data spreads out or how steep it is between the summer months and colder months. Clearly, the average lows of Tampa are more comfortable if you enjoy the outdoors.

AVERAGE LOW

average low


What about summer?

We know that the further south we go, the hotter the summers we can expect. To see that visually, we can graph the average high temperatures. In Tampa, the average high is above 70 year around. The cold months in Knoxville have an average high around or below 50. When we consider the average low in Knoxville is in the 30’s and average high is the 50’s, that’s a material difference from an average low in Tampa in the 50’s and average high in the comfortable 70’s. In fact, you may observe the average low in Tampa is the average high in Knoxville.

But what about too much heat? While the average high in Knoxville is in July and just short of 90, Tampa stays as hot as Knoxville hottest month from May up to October. For some, Tampa may be too hot in the summer. But humidity has a lot of do with how hot it feels, we’ll get to that.

AVERAGE HIGH

average high


What about extreme cold?

When we analyze data, we want to look at it in different ways to carve out the things we want (warm weather) and carve away the things we don’t (cold and hot weather). Below we graph for a visual to see the average days below freezing (32F). Clearly, Knoxville experiences some freezing days that are rare in Tampa, Florida. Some of you are probably laughing at my calling below 32F “extreme cold”, thinking it should be instead below zero. What you consider extreme depends on your own judgment and experience.

 AVERAGE DAYS BELOW 32F

average days below 30 degrees knoxville tampa

What about extreme heat?

When we state an extreme, we have to define what we mean by extreme quantitatively. I used 90F to define an extremely hot day. As we see below, while Knoxville has many more days below freezing in the winter, Tampa has many more days of extreme heat in the summer. We are starting to discover when we want to be in Knoxville, Tennessee and when we may want to be in Tampa, Florida. As with investment management, timing is everything.

AVERAGE DAYS ABOVE 90F

average days over 90 degrees tampa florida knoxville tennessee

What about Precipitation?

It doesn’t matter if the weather feels great if it’s raining all the time. Tampa experiences a lot of rainfall in inches starting in May through September. Knoxville rainfall is actually a little less in the summer months. So, we could describe Tampa as hot wet summers and Knoxville as warm dry summers.

AVERAGE PRECIPITATION

AVERAGE RAIN PRECIPITATION KNOXVILLE TAMPA


A little rain is one thing and may not be significant. What if we define a “significant rain” as greater than 0.10 inches? The stand out is that Tampa has “significant rain” in the summer months and little in the winter.

AVERAGE DAYS OF PRECIPITATION LESS GREATER THAN 0.10 INCHES

average rain days over tenth of inch in tampa knoxville


What about Humidity?

If you’ve ever experienced a place like Vail, Colorado in the winter were you can sit outside for lunch in the snow without a coat on when it’s 32F, you’ll have a unique understanding of humidity. We can say the same for south Florida in July. Humidity is the amount of water vapor in the air. Humidity may take more explanation to better understand. According to Wikipedia:

Higher humidity reduces the effectiveness of sweating in cooling the body by reducing the rate of evaporation of moisture from the skin. This effect is calculated in a heat index table or humidex, used during summer weather.

There are three main measurements of humidity: absolute, relative and specific. Absolute humidity is the water content of air. Relative humidity, expressed as a percent, measures the current absolute humidity relative to the maximum for that temperature. Specific humidity is a ratio of the water vapor content of the mixture to the total air content on a mass basis.

Relative humidity is an important metric used in weather forecasts and reports, as it is an indicator of the likelihood of precipitation, dew, or fog. In hot summer weather, a rise in relative humidity increases the apparent temperature to humans (and other animals) by hindering the evaporation of perspiration from the skin. For example, according to the Heat Index, a relative humidity of 75% at 80.0°F (26.7°C) would feel like 83.6°F ±1.3 °F (28.7°C ±0.7 °C) at ~44% relative humidity.

The temperature alone isn’t the full measure of how hot and uncomfortable the climate can be. We can break down humidity into morning and afternoon. Morning humidity in Knoxville is highest in the winter months, which leads to a cold, wet feeling winter. Morning humidity in Tampa is highest in the summer, making hot feel even hotter.

AVERAGE MORNING HUMIDITY

average morning humidity knoxville tampa


As we see below, afternoon humidity is much higher in Knoxville during the summer months.Tampa stays above 82% humidity on average. By now you have probably began to spot directional trends in the data as well as mean reversion. For example, in the chart below the red line (Knoxville) trends upward sharply from March to August. Then it reverses back down to retrace about half the prior gain. I see the same patterns and trends in global markets, though they are more difficult based more on social science than the science of climate and seasons. Yet, there are seasonal patters in global markets, too, such as “sell in May and go away” and “January Effect”. But unlike weather changes, they seasonal changes in the stock market aren’t as sure as the transition from summer to fall to winter to spring to summer again in Tennessee.

AVERAGE AFTERNOON HUMIDITY

average afternoon humidity knoxville tampa

Tampa has a Breeze

Below we see the average wind speed. Tampa has a breeze to help cool us down compared to Knoxville.

average wind speed tampa florida knoxville tennessee

What about Sunshine?

Warm dry weather is nice, but what about sunshine? Below we see why they say “Sunny Florida”. You may notice that Tampa is more sunny in the winter months then even the summer months. Knoxville has a greater possibility of sunshine March through October with a sharp downtrend on both ends.

AVERAGE SUNSHINE POSSIBLE

AVERAGE SUNSHINE POSSIBLE TAMPA KNOXVILLE

What about Cloudy Days?

If you live in the north, you are familiar not only with cold wet winters, but cloudy grey skies. The outliear that stands out on this graph is that Knoxville is cloudy half of the days of each month in the winter. Tampa, on the other hand, has few cloudy days throughout the year, but its highest is the July. You may have noticed some climate patterns between Tampa and Knoxville are negatively correlated. That is, Knoxville tends to be cloudy in January and least cloudy in July and Tampa is nearly the opposite.

AVERAGE DAYS CLOUDY

average cloudy days knoxville tampa

In the late 1990’s I remember listening to Steven Covey audiobook of “7 Habits of Highly Effective People” when he would say: “proactive people carry weather with them”. That is an example of Projection makes perception: seek not to change the weather, but to change your mind about the weather. That may work for some of us for many years, but eventually we may instead decide to “rotate instead of allocate”. That is, we may decide a warm sunny place like Tampa, Florida is a great place when its cold, wet, and cloudy in a place like Knoxville. Though, Knoxville may be better to spend the summer months with its more mild summer than the hot humid wet Tampa summer.

You can “carry weather with you” by perceiving it how you want, or you can carry (rotate) yourself to the weather you prefer. You can probably see how this quantitative data study helps visualize the absolute climate ranges and relative differences to make the decision with a greater understanding of what to expect.


5th Year Anniversary of the Bull Market

This week marked the 5th anniversary since the March 9, 2009 low in stock market. While much of the talk and writing about it seems to be focused mainly on the upside gains since the low point, it is more important to view it within the context of the big picture.

If you knew on March 9, 2009 that was the low point and could handle the 5 – 10% daily swings that were occurring during that time, then you could have made a lot of money. But, the fact is, many people have emotional reactions after a -10% decline over any period, even more it happens in a day or a week. But even if you don’t, in order to have made a lot of money you would have needed to have exited prior to the large loss before then. You needed cash to invest at the low. I heard some are bragging about their gains since the low, but they left out how much they had lost over the full cycle. It doesn’t mean anything to earn 100% over one period if you lose -50% the next period that wipes it out.

It doesn’t actually matter how much the stock index gained from its low point. What matters is its trend over a full market cycle. People sometimes have trouble seeing and understanding the bigger picture, which is one reason they get caught in traps in the short run.

Below is the price trend of the S&P 500 stock index over the most recent full market cycle. I define a full market cycle as a complete cycle from a peak to low to a new peak. That is, it includes both a “bull market” and a “bear market”. To get an accurate picture, I have used the SPDRs S&P 500 ETF and a total return chart, so it does include dividends. After more than 7 years, the stock index has only gained 35%. Yet, it declined -56% along the way. That isn’t the kind of asymmetry® investors seem to want. If you think about risk reward, 20% is great upside if the downside is only -10%; that is positive asymmetry®. We want to imbalance risk and reward, more of one, less the other.

S&P 500 full market cycle 2014-03-14_10-34-31

If you look closely, it took 5 years after the October 2007 peak to get back to break even. Though it has taken a long time to recover from the cascade decline, the recovery was impressive in terms of its gains, but extremely volatile for investors to endure.

When looking at a period of over 7 years, the swings don’t seem so significant. To put them into context, there were about 9 declines around 10% or more with the one in 2011 about -20%. This has kept many investors from buying and holding stocks.

If you are good at visual intuition, you may notice the price swings on the left of the chart are much wider than those more recently. This is a visualization of higher volatility as the trend was down and continued volatility caused by indecision between buying pressure and selling pressure.

After prices have trended down, such as the 2008 and 2009 period, the range of prices is wide and investors who held on too long panic, yet buyers aren’t willing to buy at their price.

After a price trend has been drifting up for several years and investors hear about how much it has gained, they become more and more complacent and more optimistic. They do this near a peak.

You can probably see how most investors who lost a lot of money before are likely to do it again. Unless something like the observations I have shared here helps to change their behavior, they are likely to do the same thing they did before.

Academic: not of practical relevance; of only theoretical interest.

Professors at colleges and universities are often called “Academics”. Much of their job is to write and publish “academic research papers”. It is no wonder you can find such a paper on most any topic. Investment management is a popular topic and it seems we see observe more and more such papers being cited and talked about.

Someone was telling me a story recently about the unethical use of the power of persuasion and influence. It reminded me how academic research is sometimes used to mislead people. For example, I read a book a few years ago that was supposedly in pursuit of finding alpha, but the entire book cited hundreds of academic studies promoting a passive asset allocation strategy. Yet, there wasn’t a single mention of the word “momentum” in the book, even thought there are over 300 academic papers that discovered alpha applying simple momentum/relative strength strategies. Momentum has even dis-proven the “Efficient Market Hypothesis”, but promoters of EMH call it an “anomaly” they can’t explain. I found the book misleading because of its title and content was conflicted – and it left out the one thing that even academics have found alpha.

I am often asked for my opinion about some of their research. I spend every day working on my edge. In addition to constant exploring and proprietary studies, I monitor and read many of the academic papers being published on topics I have interest and expertise, such as trend following, behavior finance (investor/trading psychology), volatility trading, global macro trading. I especially read studies about constructing trades with options and applying momentum. While some of these papers are worth reading and some even excellent, most of them seem to lack real world experience for application.

We have to consider that many of the people writing an academic paper don’t have any meaningful actual experience doing what they are writing about, so the studies are theoretical, conceptual, notional, philosophical, hypothetical, speculative, conjectural, and suppositional.

You may find it interesting that I found all those synonyms by looking up “academic” on Wikipedia. I thought it was interesting that their second definition of “academic” is “not of practical relevance; of only theoretical interest.”

academic stock market research dfa

As we think independently and critically about the world and our quests, we may keep this in mind as we read and cite academic research. That is in fact a function of being a good scholar and researcher, whether you do it for profit, or not. You may consider that it’s what you may be wrong about, or what you are missing, that should be your primary concern.

Oh seven, eight, and nine: Remembering the Last Bear Market

I’ve been working on a report for our clients about the current conditions of global markets and how we’ll know when it changes from positive to negative. I’m calling it something like “What a Market Top Looks Like”. It’s actually a working document; something I’ve added to since 2001. I haven’t sent a piece like this to our clients since late summer of 2007 when I believed global markets were getting closer to a significant peak.

The current bull market in U.S. stocks is now about 58 months old. As I explained in The REAL Length of the Average Bull Market, bull markets have averaged about 39 months and bear markets about 17 months. A full market cycle (average bull + bear) is 56 months. The current bull market, then, is longer than the historical average full market cycle. Probably driven by the Fed’s QE experiment, the advancing part of this cycle is 20 months longer than average. So, it seems to make sense to start watching for signs the topping process has started and remind our investors what that looks like and how we deal with it. Most people will become more and more complacent the higher and longer it goes – I’ll do just the opposite.

As I’ve been thinking about this lately, it occurred to me that, if anything, most thoughts seem more focused on the “bear market” period than they are what a market topping process looks like. Clearly, what is today known as the “Global Financial Crisis” or “Great Recession” will be forever imprinted in people’s memory – especially those who held on to losing stocks and bonds to large losses.

Someone was recently telling me of a strategy that “made money in 08”, but when I looked at it, they left out that it had declined -20% just before 2008. For many investors, that -20% may be just enough to cause them to exit the strategy, so it wouldn’t have mattered what it “did” the next year. Losses as large as -20% turn $1,000,000 into $800,000 or $10 million into $8 million. Whether it’s rational or not, investors start to perceive such losses as permanent. The more they think about it the more they may start to experience disappointment from the dreams of what they could have done with all that money they once had – but is lost. But, while our money is invested in a market and exposed the possibility of a loss – a gain is the markets money until we take it.

When people talk about the last bear market, they call it “2008”. They remember “2008” or “08” pronounced “oh – eight”. When we talk to investors about our investment programs they say “How did it do in 08?”. But, the trend wasn’t just 2008.

Below is a total return price chart of the S&P 500 stock index during the calendar year 2008. It declined -38.49% during the calendar year 2008. However, at one point it was down -48%.

S&P 500 stock index 2008 return

That was just the calendar year 2008. The stock market decline actually started October 10, 2007. Below is a chart of that date through year-end 2007. The S&P 500 stock index had already declined -10% at one point and the -6.18% adds to the total decline.

S&P 500 2007 beginning of bear market

You may start to notice how different the result can seem depending on when you look at it. As it turned out, 2008 was just the middle of the bear market. As we saw in the first chart, October 2008 was the first low. It seems people may call the bear market “Oh eight” because 2009 ended “up”, but the bear market actually continued into 2009. In fact, 2009 was some of the steepest part of the waterfall. Below is the bear market continuation into 2009, an additional  -25% decline.

Bear market continuation 2009

The full bear market was 2007, 2008, and 2009. It was a -56% decline in total.

Full bear market from 2007 to 2009

You can probably see how studying trends closely, we begin to realize that arbitrary time frames, like a calendar year, can be misleading about the bigger picture.

But, what may be more useful today is a strong understanding of the price trends leading up to all the historical bear markets.

Why Investors Fail

why investors fail

People believe they know things they don’t and focus their energy trying to know the unknowable, rather than focusing on those things we can know and can control. The problem starts with one of the most read and respected investment books.

“An investment operation is one which, upon thorough analysis, promises safety of principal and an adequate return. Operations not meeting these requirements are speculative.

-Benjamin Graham, “The Intelligent Investor”, 4 ed., 2003, Chapter 1, page 18.

The trouble with that statement is that it promises the impossible. That is, I believe all operations are speculative and we do best by treating them as such.

First, let’s define the terms, according to Merriam-Webster.

A promise is:

 “a statement telling someone that you will definitely do something or that something will definitely happen in the future.”

Analysis is:

“detailed examination of the elements or structure of something, typically as a basis for discussion or interpretation.”

Speculative is:

“engaged in, expressing, or based on conjecture rather than knowledge. (of an investment) involving a high risk of loss.”

So, to be sure we understand the meaning, let’s read it again and then interpret what it means using these definitions.

“An investment operation is one which, upon thorough analysis, promises safety of principal and an adequate return. Operations not meeting these requirements are speculative.”

In other words, it suggests if you do a thorough examination of the operation, you will gain “safety of principal and an adequate return” and that will definitely happen in the future.

If you have ever wondered why so many don’t do well at investment management, this is one reason. They believe they can do thorough analysis up front that that will assure the outcome and protect against loss.

It doesn’t actually work that way.

We never know for sure in advance. And, if we focus on the things that do matter, we don’t need to know what will “definitely happen in the future”. The exit, not the entry, determines the outcome. The trouble with much of the value investing philosophy, whether buying private companies or exchange traded securities, is the assumption that you can determine what will happen next. But when you are so confident in that, you end up caught in a loss trap when you are wrong with no way out. Instead, the outcome is completely determined by our exit: how we get out of it.

So, I treat all operations as “speculative”. All operations have a high risk of loss.

And, all things are “conjecture”.

Conjecture:

“an opinion or conclusion formed on the basis of incomplete information.”

That is, we always have incomplete information. We never know it all. To me, it makes a lot more sense to focus on the direction prices are trending and know I’ll create my results by my exit, not my entry. I focus my energy on defining the direction and when it’s going in the wrong one… so I can exit.

etf managed portfolio

“The whole problem…

bertrand-russell-quote-fools-wise-men-quote

“The whole problem with the world is that fools and fanatics are always so certain of themselves, but wiser people so full of doubts.”

—Bertrand Russell (British mathematician and philosopher, 1872-1970)