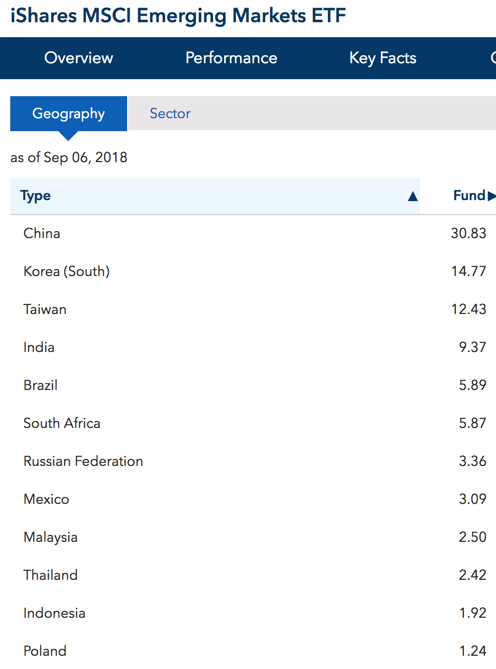
In Emerging Markets Reached a Bear Market Level we noted the emerging markets index has declined -20%, which is considered to be in bear market territory. The emerging markets index includes 24 countries classified as emerging countries.
To see the country exposure, we examine the iShares MSCI Emerging Markets ETF holdings. China is about 31%, South Korea is about 15%, Taiwan is over 12%, so the top three countries make up 58% of the country exposure. Add India at 10% and the top four countries is a dominant 68% of the exposure. Clearly, we’d expect the drift of these top holdings to dominate the trend.
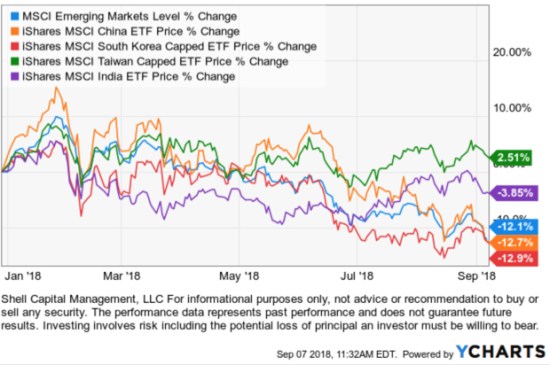
Below we see the 2018 price trends of the emerging markets ETF and the top four countries that make up 68% of the emerging markets index ETF exposure. We see that South Korea and China are the primary downtrends that are trending close to the emerging markets index ETF. Taiwan and India have stronger relative momentum.
To get a better understanding of what is driving the downtrend, we draw the % off high charts to see the drawdowns. From this observation, we can see what is really driving the trend. Of the top four countries in the index, the negative momentum of China and South Korea are driving the trend down. China is down -24% over the past year as South Korea is down -17%.
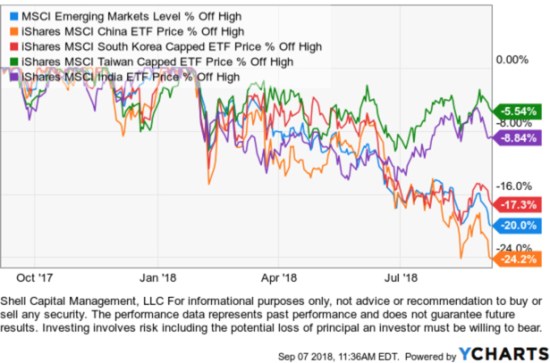
Taiwan and India have stronger relative momentum since they have trended up more recently since July. Prior to July, they were trending closer to China and South Korea.
You can probably see why I include the individual countries in my global universe rather than just the broad emerging markets index ETF that includes 24 countries. I want to find potentially profitable price trends, so I increase my opportunity to find them when I give myself more options.
There are 24 countries represented in the MSCI Emerging Markets Index and we’ve looked at the top 4 because they are given 68% of the exposure. That leaves only 32% in the other 20 countries. So, in regard to understanding what is driving the MSCI Emerging Markets Index, viewing the trend of the top holdings is enough to get an idea of the countries driving returns. But, in wanting to go find potentially profitable price trends, I research all the countries trends.
What about the rest of the emerging markets countries?
Looking at the other 20 countries classified as emerging markets, I’ll divide them into groups. First, we’ll look at the other countries that are down -10% or more year-to-date. Then, I’ll draw a chart of those that are down this year, but not as much. We’ll end with the few that are positive in 2018.
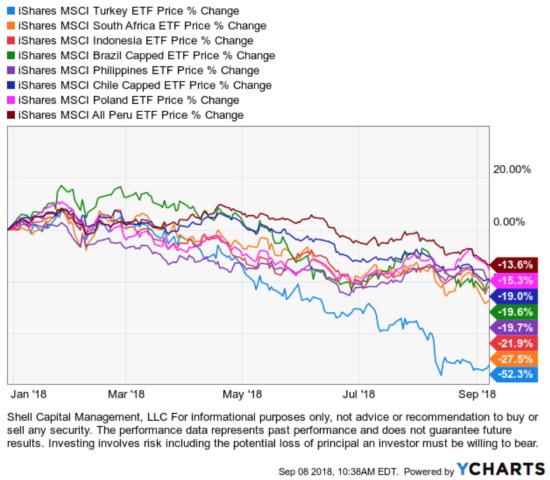
Emerging markets countries down the most year-to-date include Turkey, South Africa, Indonesia, Brazil, Philippines, Chile, Poland, and Peru. Priced in U.S. dollars, these countries are down between -14% and -52%. Turkey is down the most.
Looking at their % off high shows us the drawdown over the past year, which is a different perspective. If you had held one of these ETFs, this is the amount it would be down from its highest price over the past year.
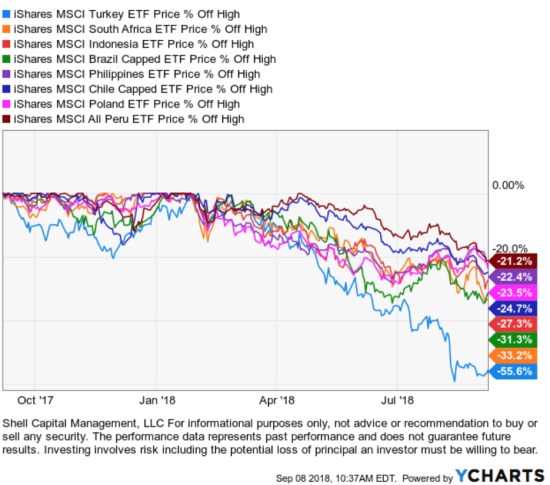
Clearly, these emerging countries are in downtrends and a bear market if we define a bear market as a -20% decline. Keep in mind, these ETFs are foreign stocks priced in U.S. dollars, so to U.S. investors, this is what the trends of these countries look like.
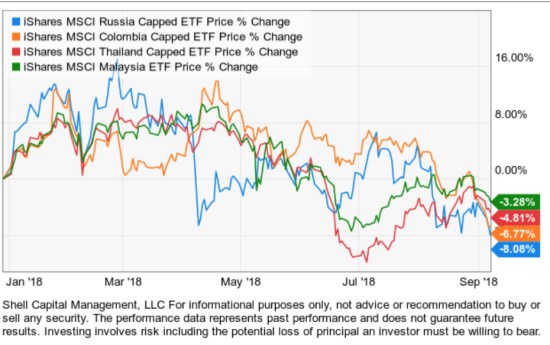
Next, we observe emerging markets countries that are down less than -10% in 2018. Russia, Columbia, Thailand, and Malasia are down between -3% and 8% so far. Their trends are generally down: lower highs and lower lows.
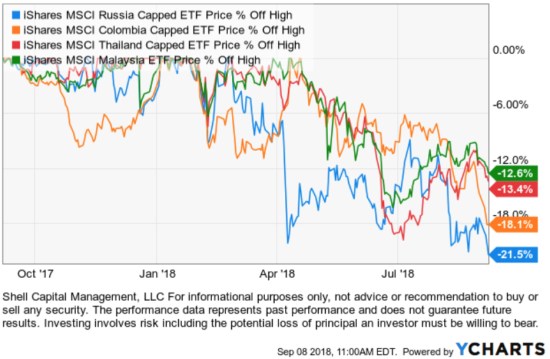
We can see the downtrends in a different perspective when we view their drawdowns as a % off high over the past year.
I saved the best for last. The strongest trending top momentum emerging markets countries so far in 2018 are Mexico, Taiwan, Saudi Arabia, and Qatar. Saudi Arabia was previously classified as a smaller frontier market, but, this summer MSCI announced it will include the MSCI Saudi Arabia Index in the MSCI Emerging Markets Index.
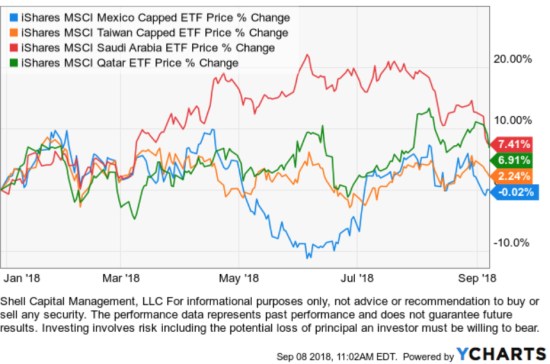
Hearing names like Mexico, Taiwan, Saudi Arabia, and Qatar may highlight home country bias for some investors. Home country bias is the tendency for investors to favor companies from their own countries over those from other countries or regions.
I don’t have a home country bias. I am open to finding potentially profitable price trends in any country around the world. We encourage investors to be open to global trends and not limit their choices, but if our clients don’t want exposure to any specific country, we are able to exclude it in our ASYMMETRY® Managed Portfolios.
While the United States is the single largest economy in the world, according to JP Morgan it accounts for only a small fraction of global GDP and just over 35% of the world’s capital markets. Yet, studies show that U.S. investors have nearly 75% of their investments in U.S.-based assets. As we’ve shown here, there has been a good reason to avoid emerging countries for now, but as we explain in Emerging Markets Reached a Bear Market Level there are times when these countries present strong relative momentum over U.S. stocks.
This is why I tactically shift between global markets based on their directional price trends rather than a fixed buy and hold global asset allocation.
Mike Shell is the Founder and Chief Investment Officer of Shell Capital Management, LLC, and the portfolio manager of ASYMMETRY® Global Tactical.
You can follow ASYMMETRY® Observations by click on on “Get Updates by Email” on the top right or follow us on Twitter.
The observations shared in this material are for general information only and are not intended to provide specific advice or recommendations for any individual. Investing involves risk including the potential loss of principal an investor must be willing to bear. Past performance is no guarantee of future results.

You must be logged in to post a comment.