The popular U.S. stock market indexes almost formed a potential inverse head and shoulders reversal pattern, however, the right side was met with selling pressure that exceeded enthusiasm to buy. For those who care to observe the price action as it unfolds, I’ll share my observations of what I’m watching for to identify a reversal or continuation of the trend. I don’t necessarily make my tactical trading decisions based on these things, it’s instead market analysis I do for observation of the shifts in supply and demand that ultimately drive trends.
At this point, these stock indexes we use as a proxy for the stock market have reached the October lows as we knew they could.
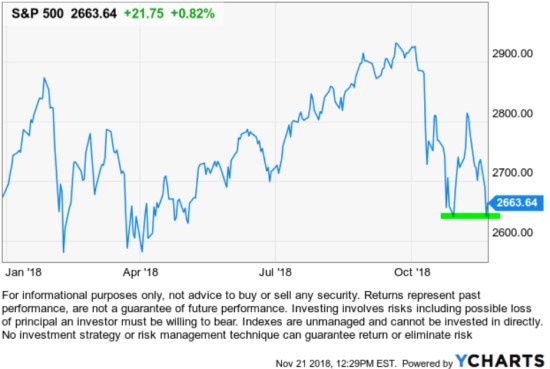
The bad news is we’ve continued to see the desire to sell exceed the enthusiasm to buy. When selling pressure is dominant, prices fall.
The good news is the price level has now reached a point were another potential reversal pattern could form; a double bottom reversal. A double bottom reversal is commonly seen when prices reach a prior low and then find enough buying interest to shift the trend from down to up. Such a shift necessarily requires prices to fall to a low enough point that buyers become willing to buy. For the trend to change; buying demand overwhelms selling pressure. So, the shift involves some combination of the desire to sell becoming exhausted and the desire to buy becoming dominant. Prices trend in the direction of the most asymmetry.
I don’t get caught up in the semantics of the names of patterns, but instead what the formation is showing about the shift in supply and demand. When a potential inverse head and shoulders pattern fails on the right shoulder, the possibility of a double bottom reversal exists, but still needs to be confirmed. For me, the whole point is; in a downtrend (uptrend), no matter what the time frame, I look for signs of a reversal of the trend through a shift in the supply/demand seen in price action. None of them are ever 100% predictive or accurate, it’s always about possible outcomes and observing the trend. It’s always probabilistic, never a sure thing. But, that’s all we need.
We’ll see if the stock indexes can hold the line, or not.
It’s a process, not an event, so we just watch it all unfold.
Let’s see what it does from here.
Have a Happy Thanksgiving!
Mike Shell is the Founder and Chief Investment Officer of Shell Capital Management, LLC, and the portfolio manager of ASYMMETRY® Global Tactical.
The observations shared on this website are for general information only and are not specific advice, research, or buy or sell recommendations for any individual. Investing involves risk including the potential loss of principal an investor must be willing to bear. Past performance is no guarantee of future results. The presence of this website on the Internet shall in no direct or indirect way raise an implication that Shell Capital Management, LLC is offering to sell or soliciting to sell advisory services to residents of any state in which the firm is not registered as an investment advisor. Use of this website is subject to its terms and conditions.

Pingback: To Know Where You’re Going, Look at Where You’ve Been: The 2018 Year in Review « ASYMMETRY® Observations
Pingback: The Stock Market Trend Update: Clearing the Line « ASYMMETRY® Observations