Full Market Cycle
Full Market Cycle
What is a full or complete market cycle? When we say “across a full market cycle” what do we mean?
A complete market cycle (or a full market cycle) is defined as a period of bull, bear, and bull periods generally lasting 4-5 years. The average bull market from 1937 to 2013 is about 39 months. The average bear market is about 17 months, which actually matches the most recent bear market from October 2007 to March 2009 (17 months). The average full market cycle is 56 months.
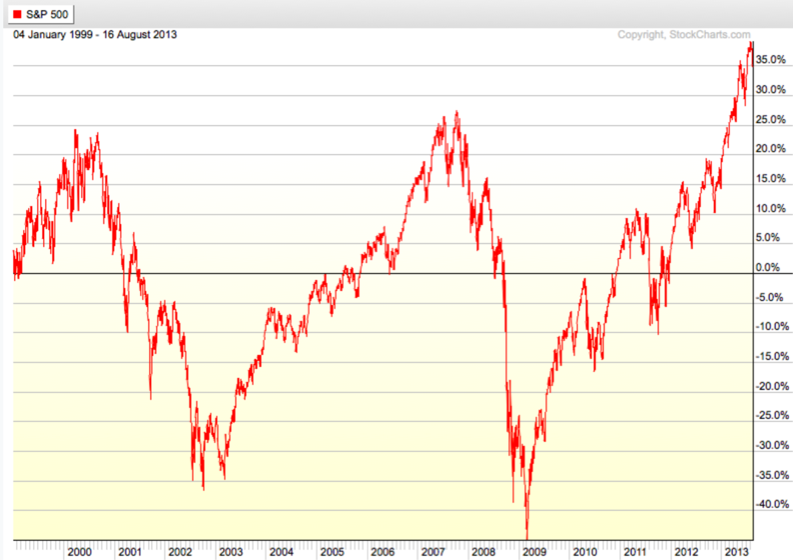
The 5 years from 2005 to 2010 is one of the greatest examples in history. During those years, stocks were rising sharply through 2007 and then reversed down over -50% and then moved back up nearly 70%. It was the highest volatility ever recorded since the Great Depression. That is true both in terms of the swings and the average daily range in prices. From April 2005 through April 2010 the S&P 500 stock index ended with a slight loss across the full market cycle. Many alternative investment strategies or alternative trading strategies have an absolute return objective to create profits across a complete market cycle rather than track a benchmark.

A picture speaks a thousand words. Below is a 13-year chart of the S&P 500 stock index presenting full market cycles.
The next chart overs a full market cycle (a bear market and then bull market) for the S&P 500 stock index from 2007 to 2013. Even with the strong recovery off the low, the stock index achieved only a 10% return over the period but experienced a -56% decline along the way.
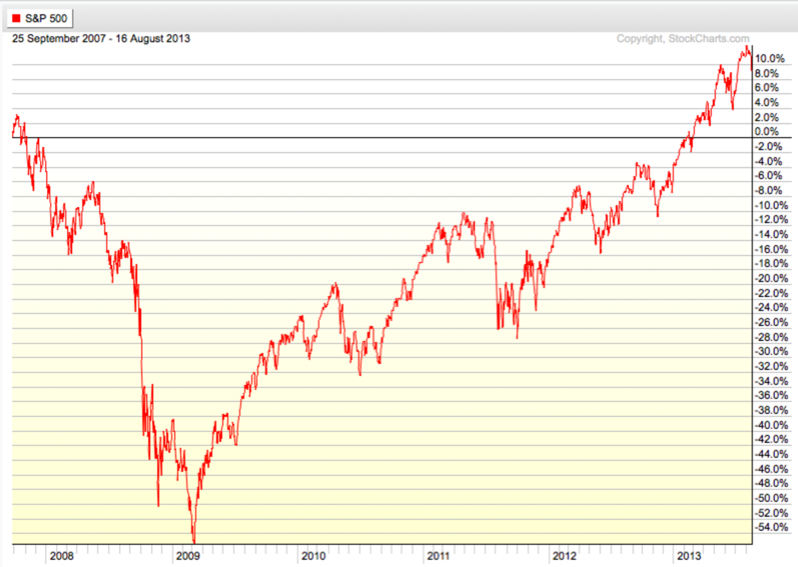
chart source: https://stockcharts.com/freecharts/perf.php?%24spx
For information about ASYMMETRY® visit Shell Capital Management, LLC
You are encouraged to reference this website, but please source ASYMMETRY® Observations and http://www.asymmetryobservations.com
Copyright 2013. ASYMMETRY® Observations All Rights Reserved.

Pingback: The S&P 500 Stock Index at Inflection Points « Asymmetry Observations
Pingback: The REAL Length of the Average Bull Market « Asymmetry Observations
Pingback: Learn from the 5th Year of the Bull Market in Stocks « Asymmetry Observations
Pingback: Investors feel and do the wrong thing at the wrong time… « Asymmetry Observations
Pingback: March 9th is the Bull Market’s 8-Year Anniversary « ASYMMETRY® Observations
Pingback: Investment management can take many years of cycles and regimes to understand an edge. « ASYMMETRY® Observations