In economics, inflation is an increase in the prices of goods and services in an economy.
When the general price level rises, each unit of currency buys fewer goods and services; consequently, inflation corresponds to a reduction in the purchasing power of money.
You may not see the value of your money change online like you do with your investment fund values changing daily, but it’s changing.
Inflation is a real risk for everyone, but it’s worse for people who have their money earning a low rate of interest at a bank or another low-yield fixed asset.
If someone believes they are being a “conservative investor” by investing money in an interest-bearing bank account, it’s only because the bank statement doesn’t show the real value of money after inflation.
The latest inflation report shows U.S. Inflation is 9%, three times higher than the long-term average of 3.25%, so if someone is only earning 3% on a CD, the value of their money is 6% less than it was.
That is, they “lost” 6% of buying power.

But that’s not the main point of this observation, it’s just one of many reasons the trend in prices is important.
The US Inflation Rate is the percentage a chosen basket of goods and services purchased in the US increases in price over a year. Inflation is one of the metrics used by the US Federal Reserve to gauge the health of the economy. Since 2012, the Federal Reserve has targeted a 2% inflation rate for the US economy and may make changes to monetary policy if inflation is not within that range. A notable time for inflation was the early 1980’s during the recession. Inflation rates went as high as 14.93%, causing the Federal Reserve led by Paul Volcker to take dramatic actions.
As an investment manager applying trend systems to global markets, I see it much more granular. I’m applying computerized trend systems to a wide range of global currencies, commodities, stocks, and bond markets, so I see the directional trend changes and shifts in momentum. Although I’ve automated the process of monitoring all these global markets, I still like to review the pictures as charts to see what is going on.
I ranked the S&P GSCI Indices by short-term momentum to see which are trending up the most, so we’ll start there.
I think it’s well known that many commodities markets had been trending up this year, but as we’ll see, many of these markets are now in downtrends.
I’ll share these trends in a way that makes it obvious that commodities aren’t just tradable markets, but they impact all of us, and commodities are interconnected. For example, the price of soybeans impacts livestock.
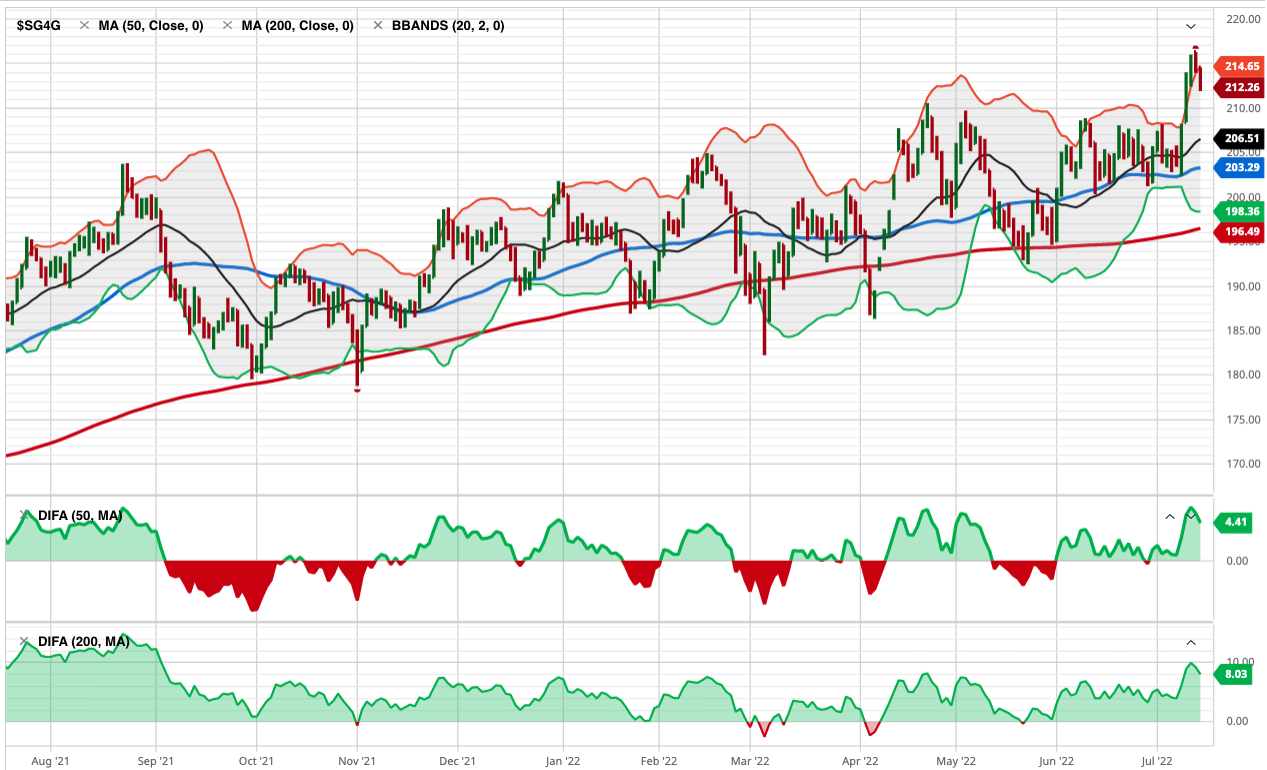
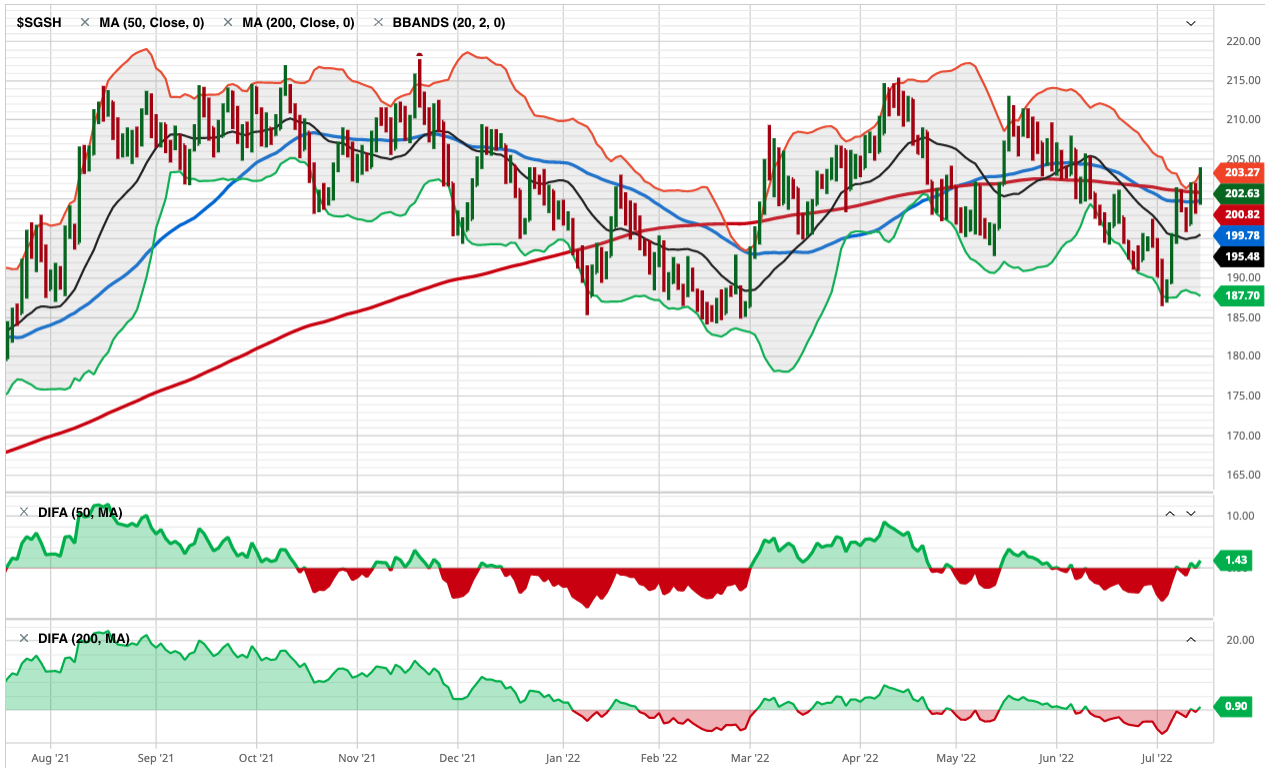
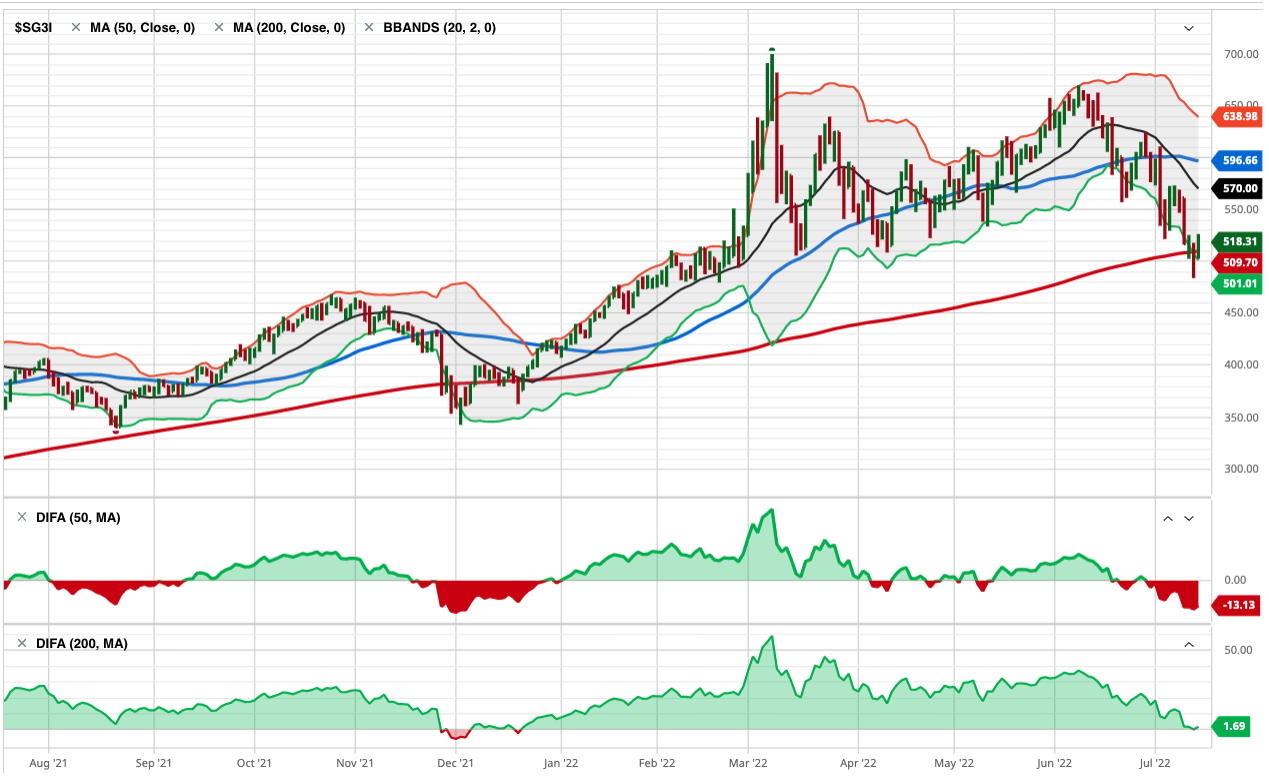
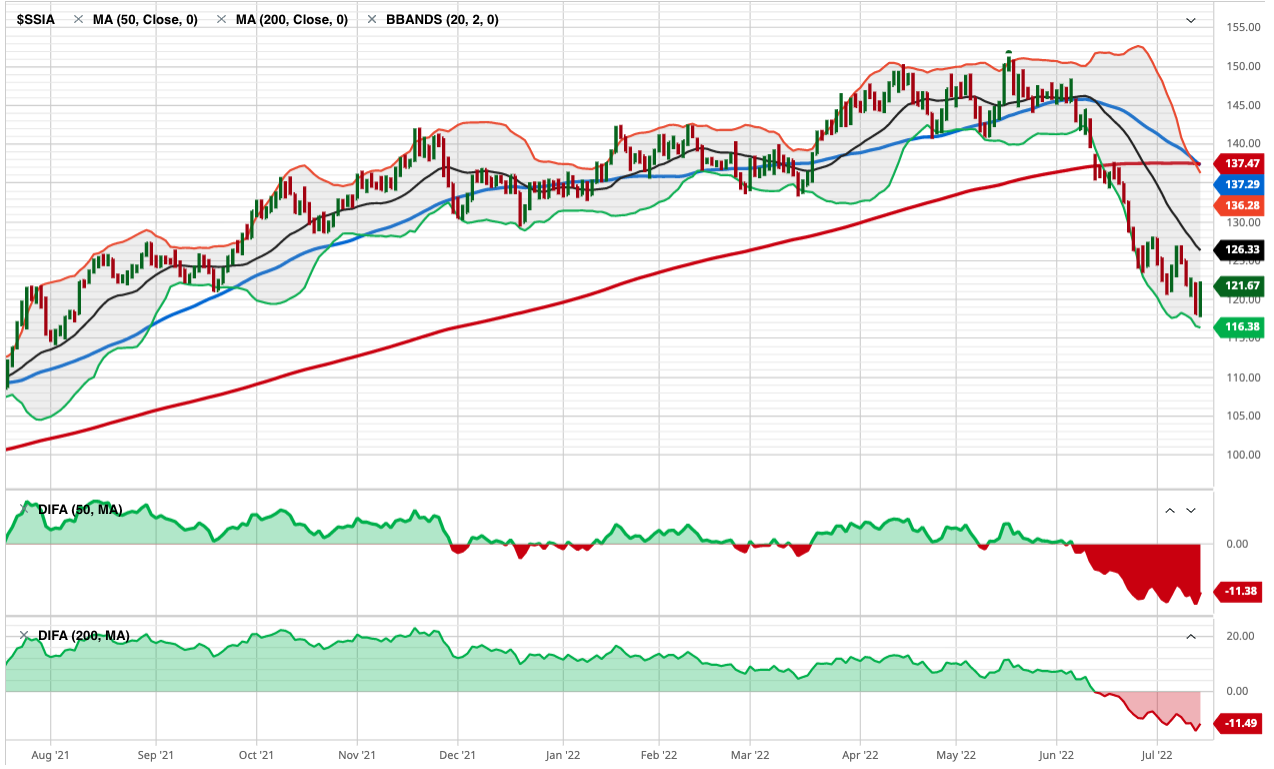
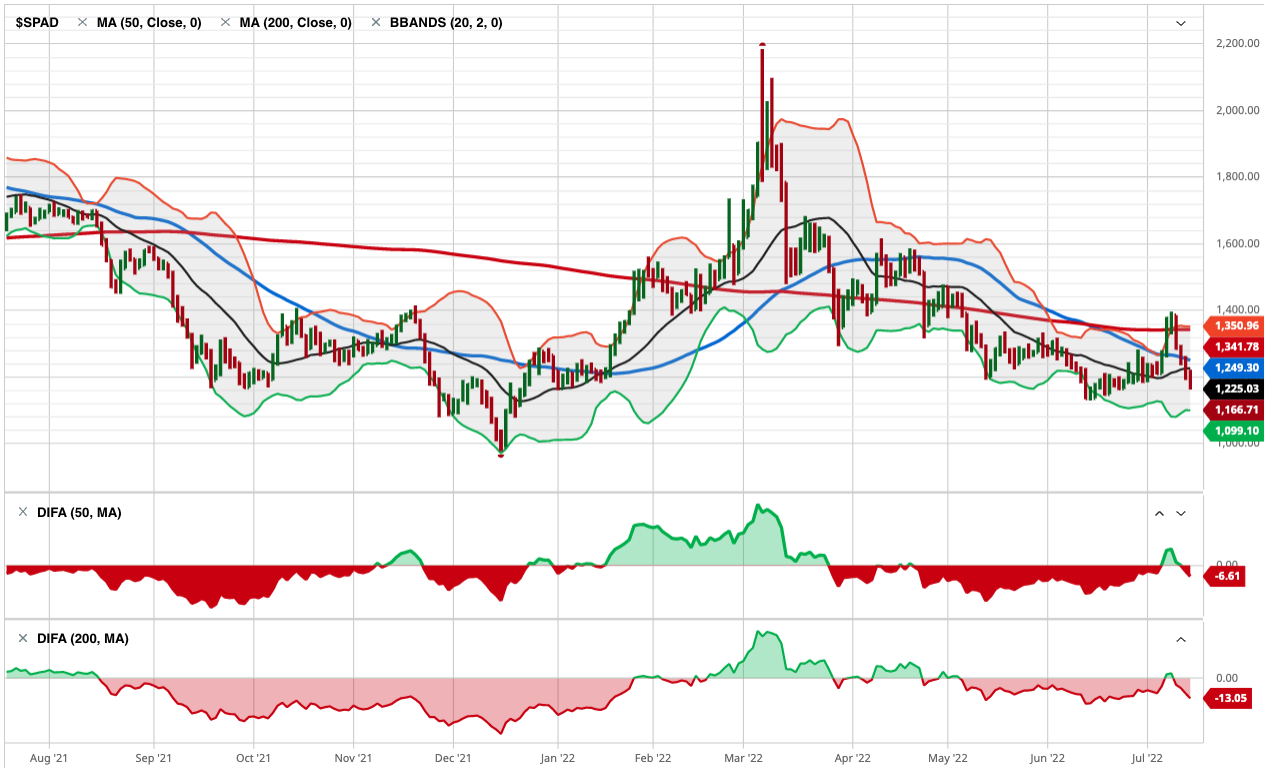
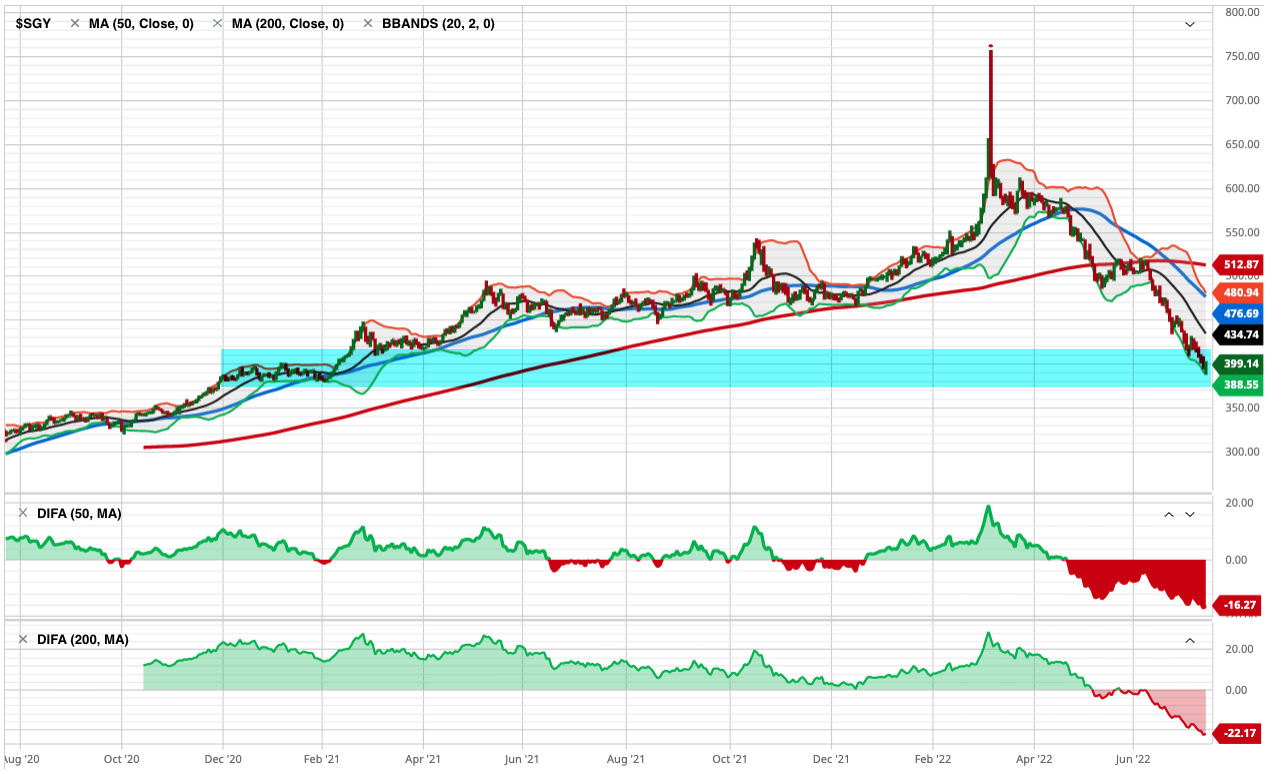
The S&P GSCI Feeder Cattle Index provides investors with a reliable and publicly available benchmark for investment performance in the feeder cattle market. S&P GSCI Feeder Cattle Index is in an uptrend as defined by above the 50 and 200-day moving averages. In fact, in the lower two frames, I include the percent above or below the 50 and 200-day average, and Feeder Cattle is about 5% above its 50-day average and 8% above its 200-day average price.
Feeder Cattle is the strongest uptrend over the past three months. It only gets worse from here.
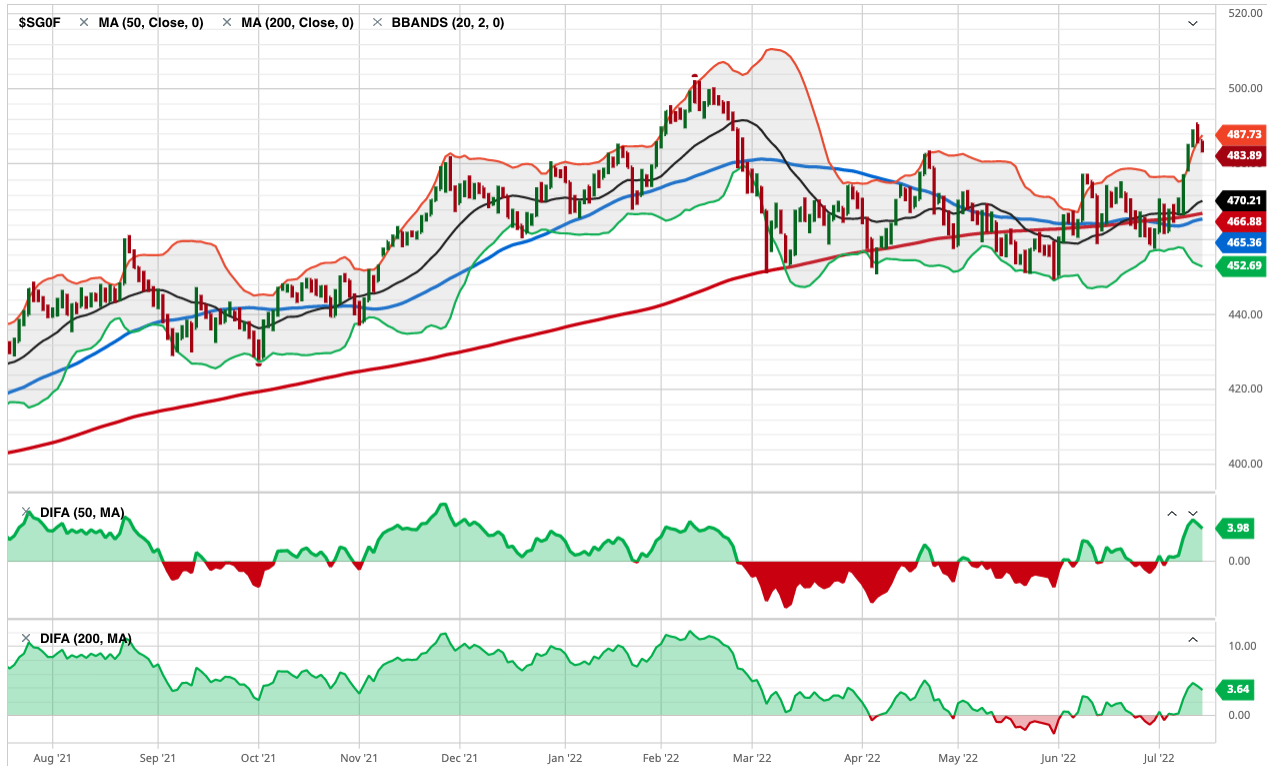
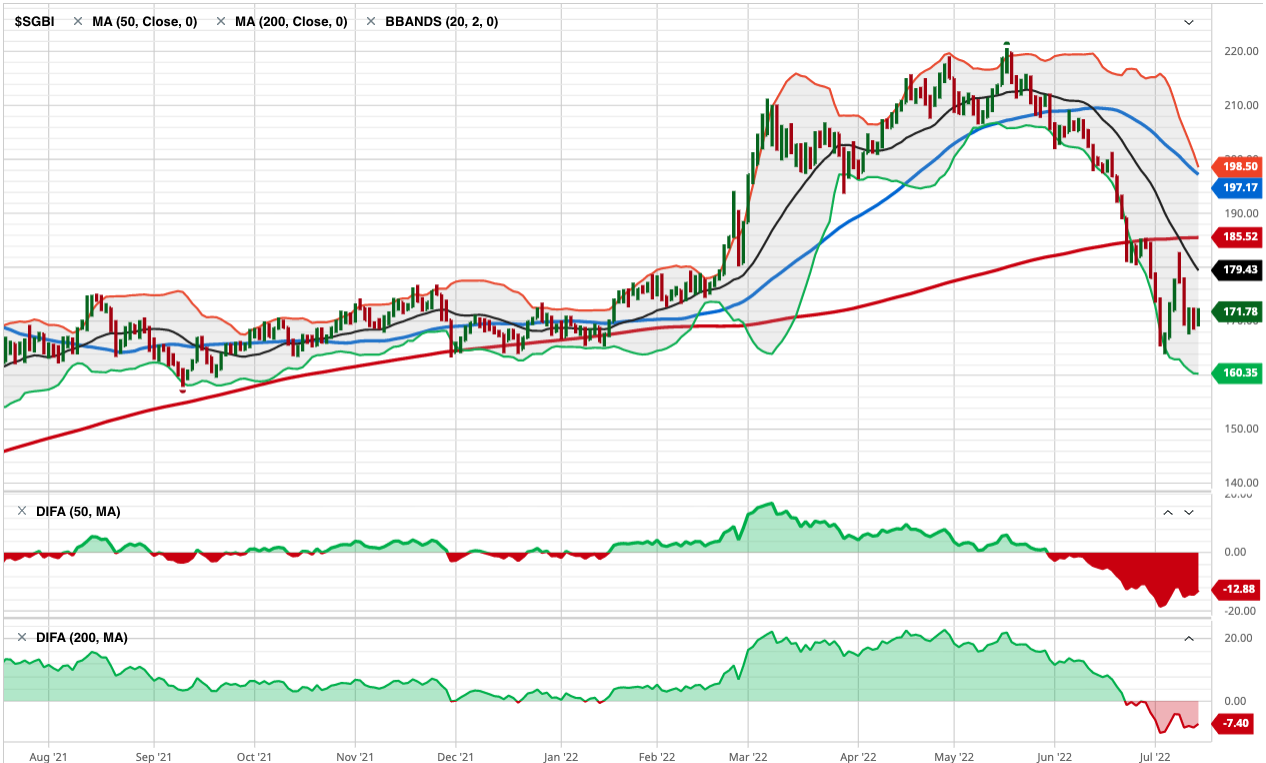
S&P GSCI All Cattle Index is a broader basket of cattle, and it too is in an uptrend after breaking out of a multi-month base.
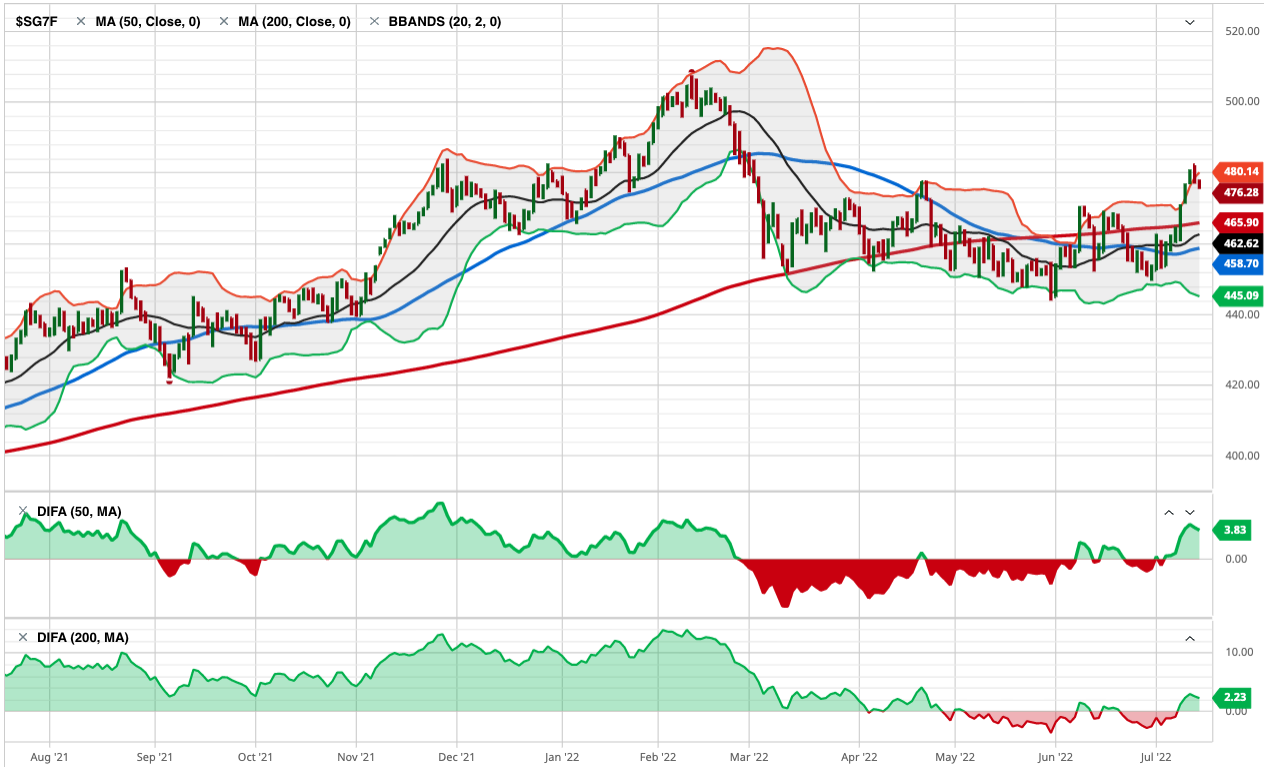
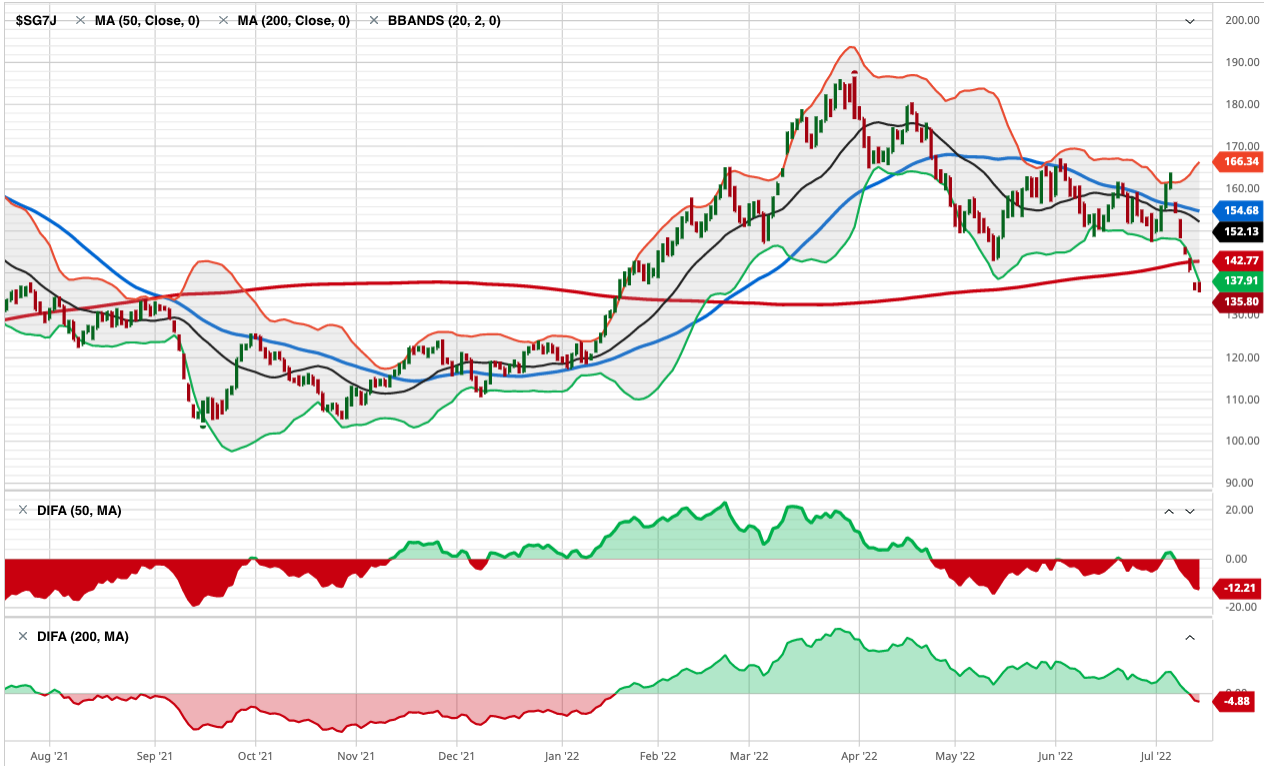
Live Cattle represented by S&P GSCI Live Cattle Index looks very similar, and is an uptrend, but not an all-time new high as it’s still below the February high.
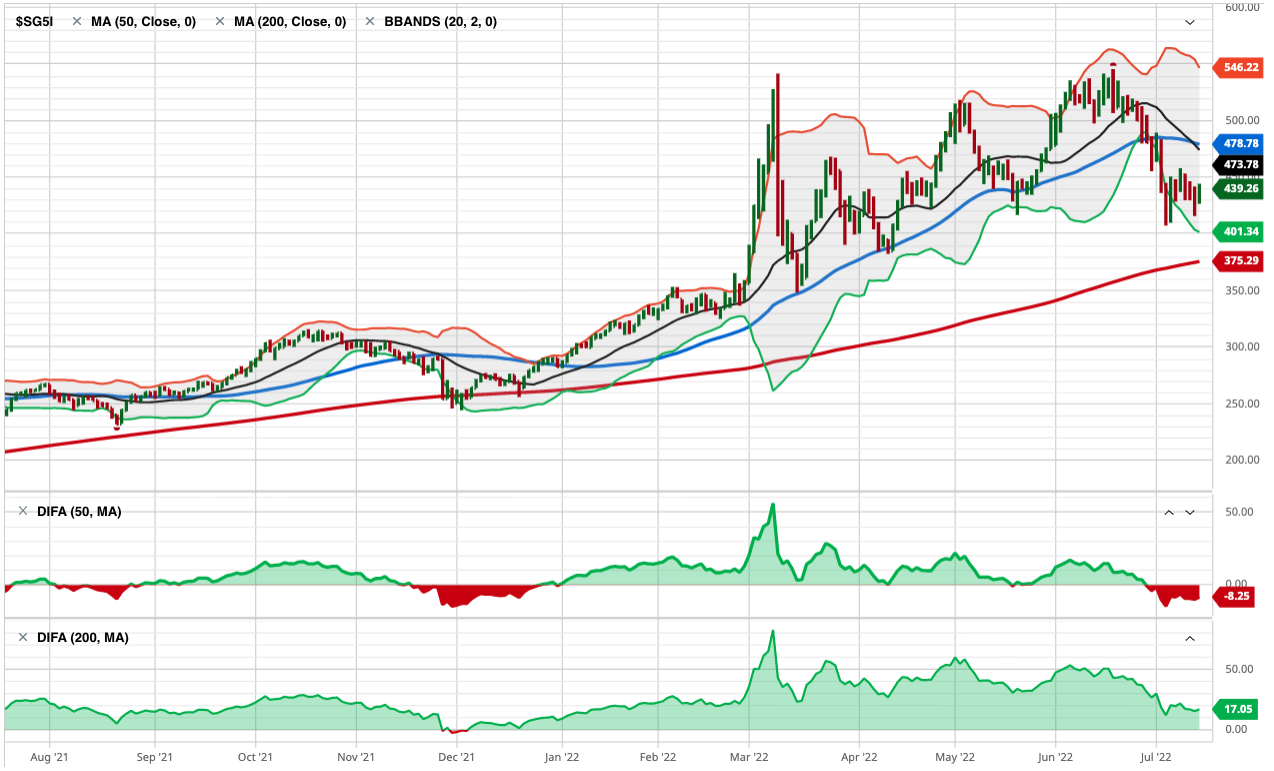
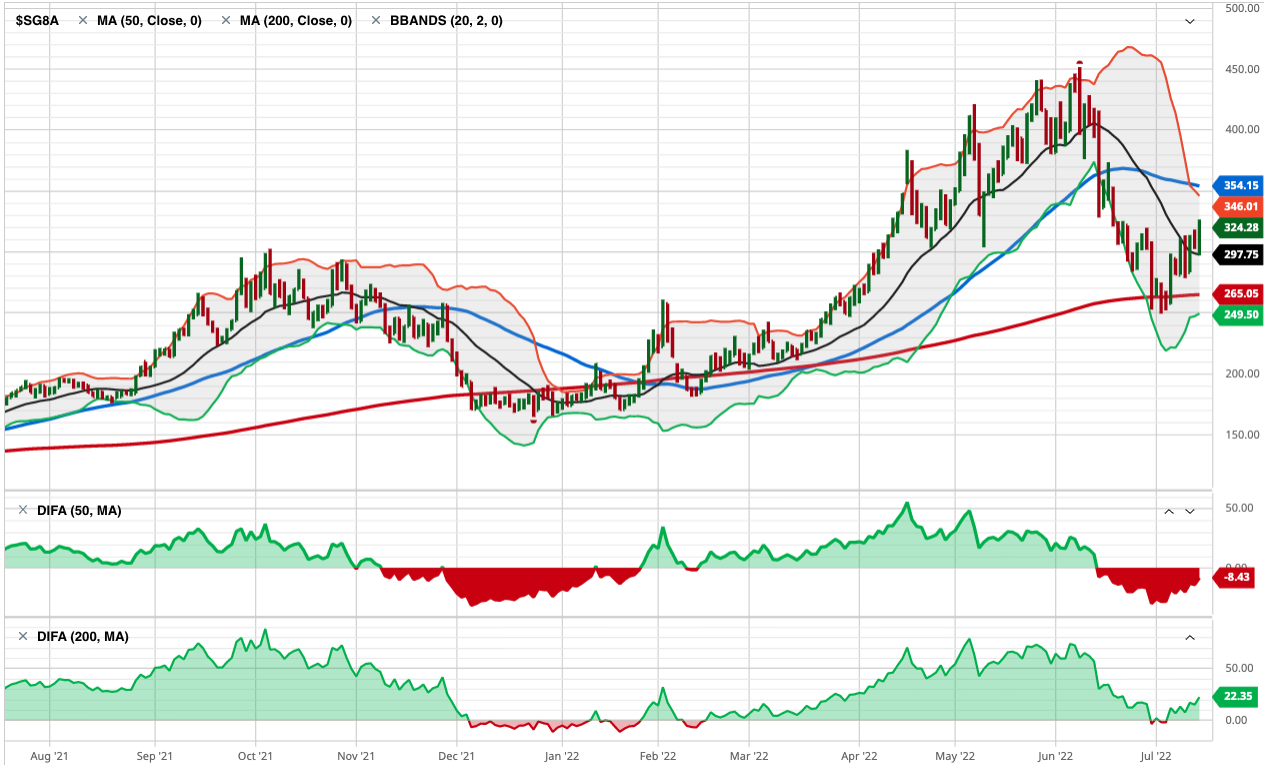
Here’s where the weakness in these commodities trends begins. The S&P GSCI Gas Oil Index is in an intermediate-term uptrend; It’s 20% above the 200-day average. But the recent decline pushed it 6% below the 50-day average. The Gas & Oil index is in a primary uptrend, but short-term pullback. Longer-term trends begin with a shorter-term trend, so we’ll see how it trends from here.
Heating oil is represented by the S&P GSCI Heating Oil Index. Like gas and oil, it’s in a primary uptrend, but a short-term downtrend.
Now we’re getting into commodities with a negative price momentum over the past 3 months.
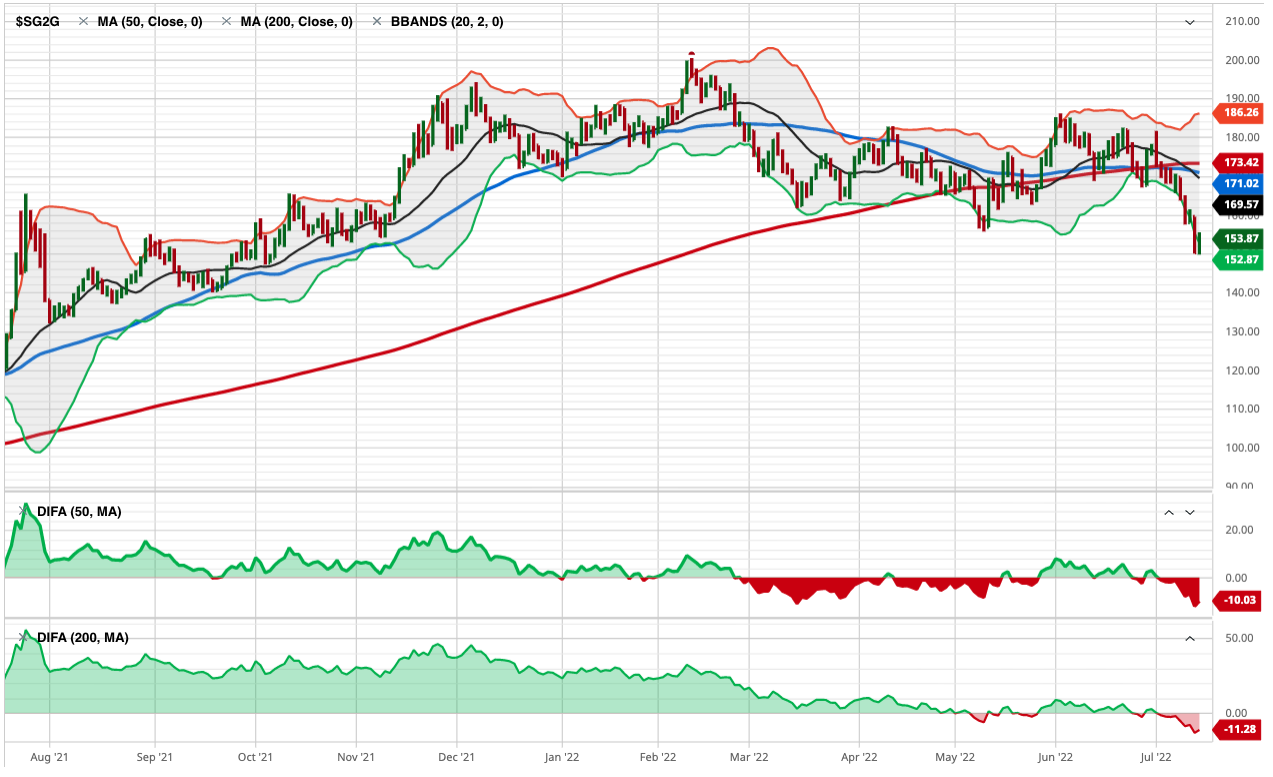
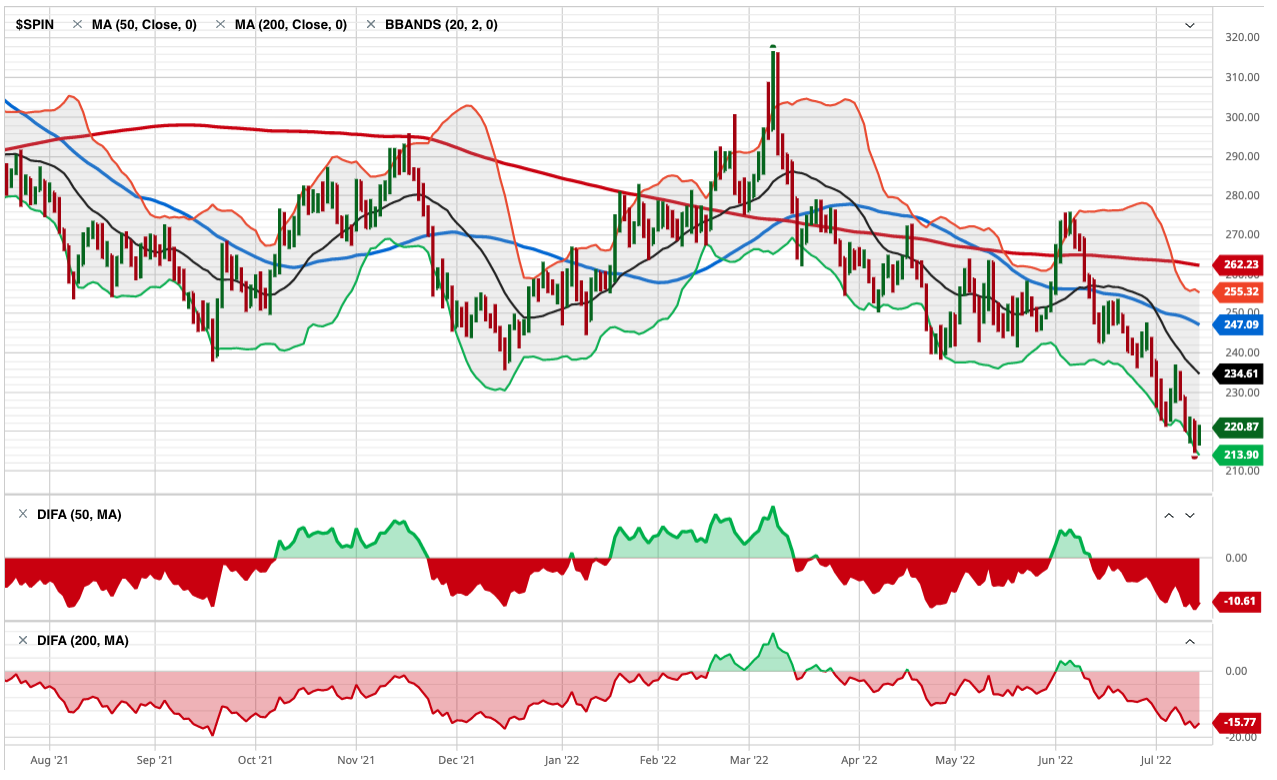
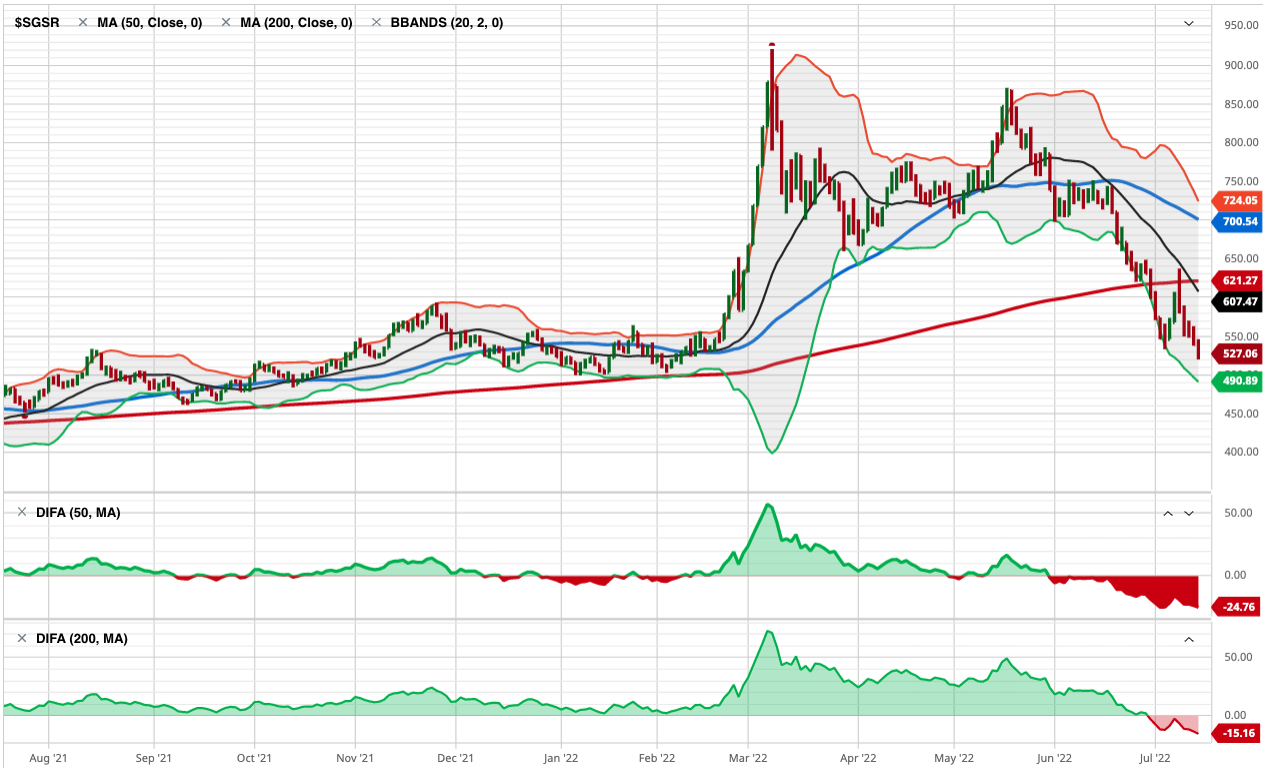
S&P GSCI Sugar Index is in a non-trending, volatile period over the past year, and it’s right at the 50 and 200-day average.
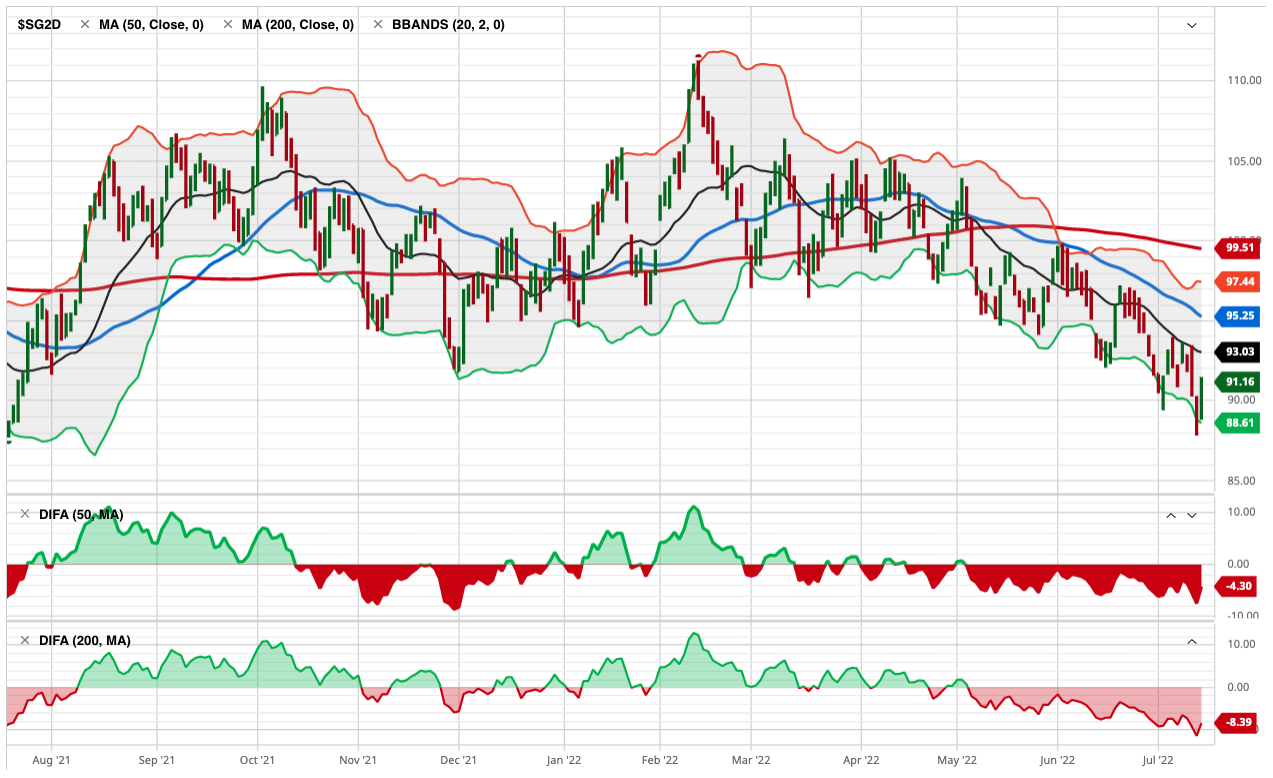
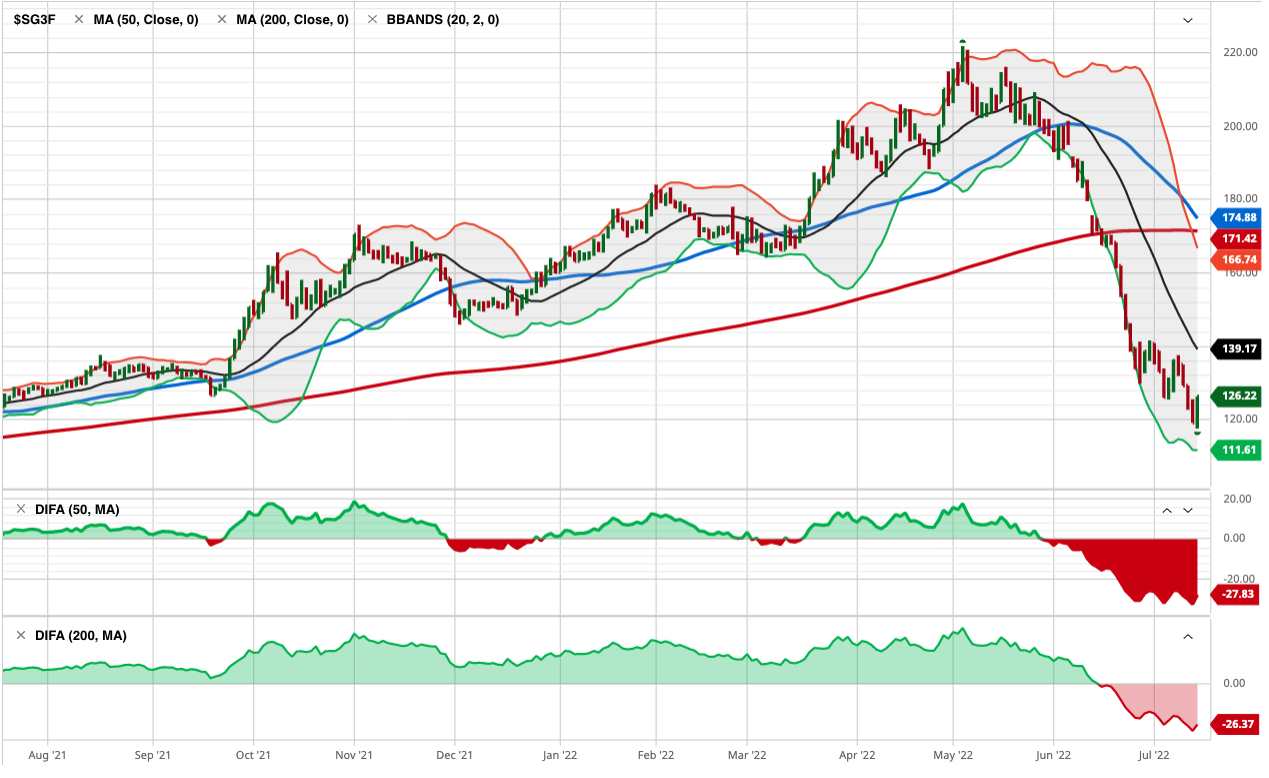
The S&P GSCI Livestock Index, a sub-index of the S&P GSCI, provides investors with a reliable and publicly available benchmark for investment performance in the livestock commodity market. Livestock is another market that’s lost its upward momentum over the past three months, and one to watch for a breakout.

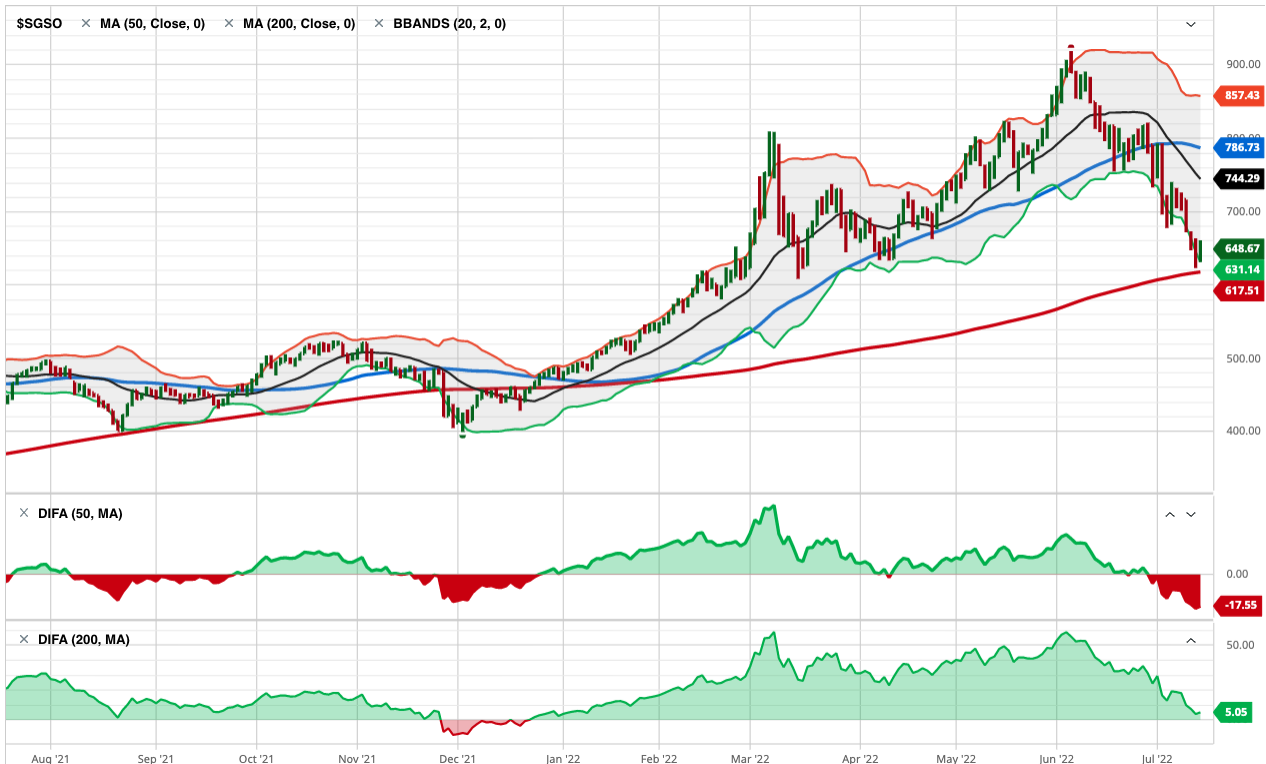
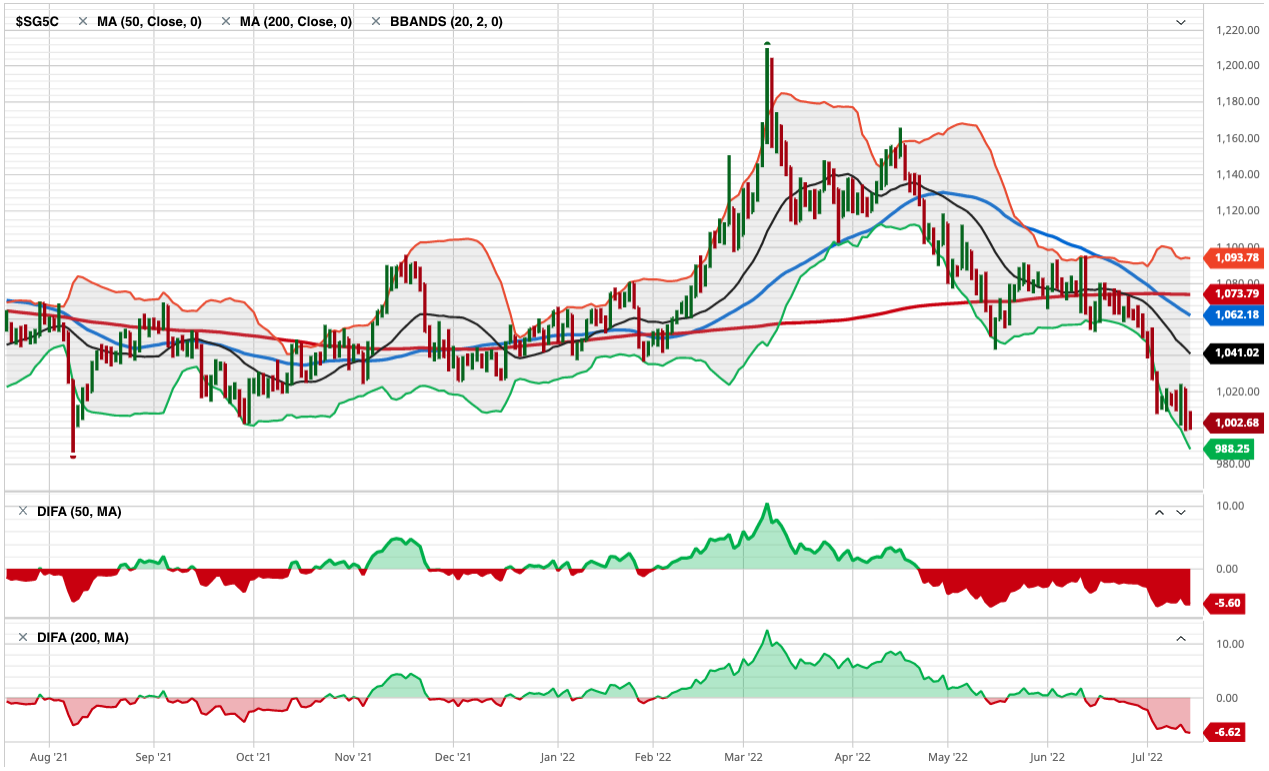
S&P GSCI Natural Gas Index is in a primary uptrend, but recent downtrend in the short term. It tapped its 200-day average and is trending back up, but nearly 7% below where it was three months ago.
I ranked these trends by three-month momentum, so all of the commodities up to this point were outperforming the broad commodity index we know as S&P GSCI Total Return Index. My three-month momentum ranking is completely arbitrary, but it signaled many of these trends had changed recently.
The S&P GSCI Total Return Index is in a primary uptrend as defined by a level above its 200-day average, but it’s in a downtrend since it peaked in June.

S&P GSCI Total Return Index is what many global macro asset managers managing global macro hedge funds use as a benchmark for commodities, so the rest of these trends are more granular looking inside this broader index made up of these other indices.
S&P GSCI Energy Index is in a primary uptrend but has declined materially over the past month.

S&P GSCI Unleaded Gasoline Index is a big one that impacts Americans and our personal economy. S&P GSCI Unleaded Gasoline Index is in a primary uptrend but has corrected a lot these past five weeks. Once again, we see a commodity trend tapping the 200-day moving average, so a breakout below it will signal a changing primary trend.
Coffee is in a downtrend. S&P GSCI Coffee Index is below the 50 and 200 average, signaling it’s in both a short-term and intermediate-term downtrend. This may help explain why Latin American countries like Brazil’s stock index is down, too. Latin America makes a lot of the world’s coffee.
Unless you’re a long/short commodity trader like a CTA trend follower who aims to capitalize on these downtrends as much as the uptrends, this is one of the rare times downtrends are something to cheer on.
S&P GSCI Crude Oil Index is in a short-term downtrend, but a primary uptrend.
Meanwhile, S&P GSCI Cocoa Index is in a downtrend across both time frames.
Hey Crude, as in Brent Crude. We have a downtrend in S&P GSCI Brent Crude Index over the short run after a volatile non-trending period.

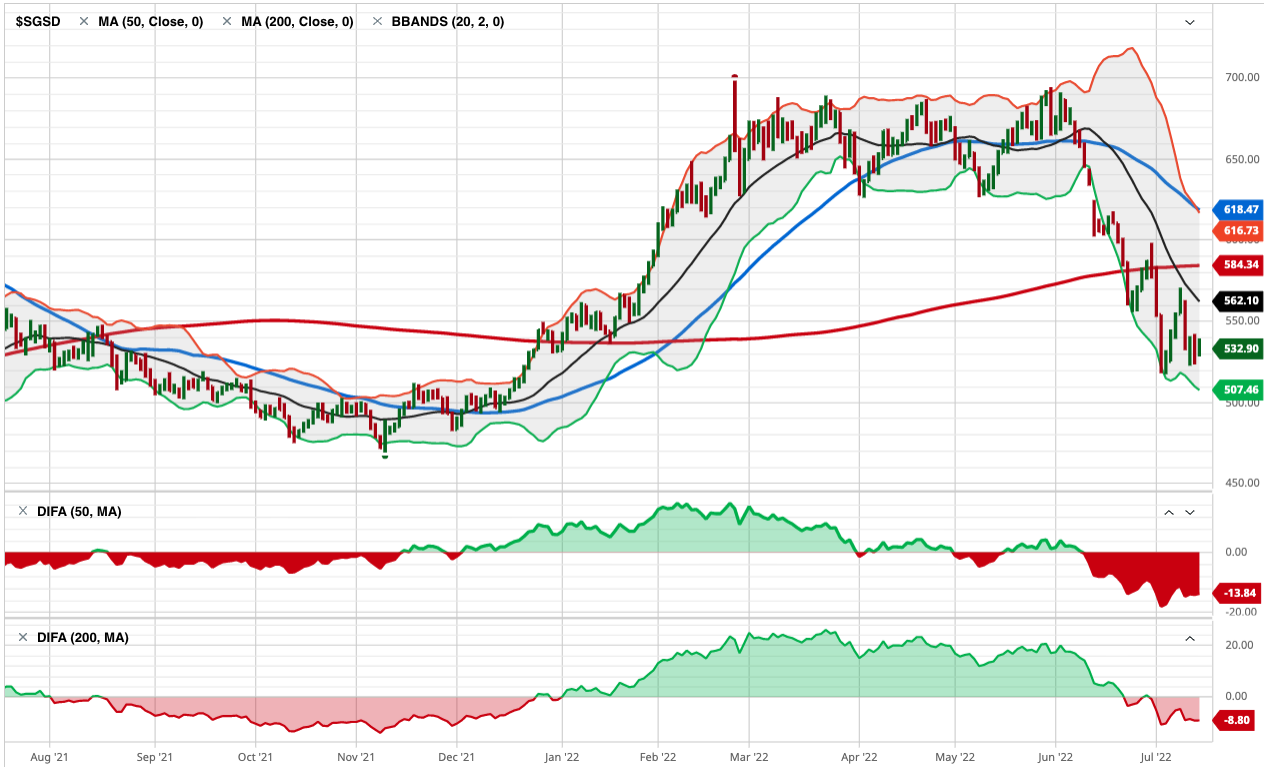
An interesting Intermarket analysis this year has been the trend in Gold. Gold is seen by many market participants as a store of value and a safe haven, but S&P GSCI Gold Index is in a downtrend after a sharp uptrend around March. You can probably see how applying multiple time frames can be useful in observing these trends.
By and large, the metals like precision metals are in downtrends.
S&P GSCI Platinum Index is in a downtrend.
Soft commodities, or softs, are commodities such as coffee, cocoa, sugar, corn, wheat, soybean, fruit and livestock. The term generally refers to commodities that are grown, rather than mined. You can see how some of the commodity markets tracked by indices are very granular focused on one single market trend, and others are a basket of commodities within a sector.
S&P GSCI Softs Index has shifted from a quiet uptrend to a volatile downtrend.
A biofuel is any fuel that is derived from biomass, that is, plant or algae material or animal waste.
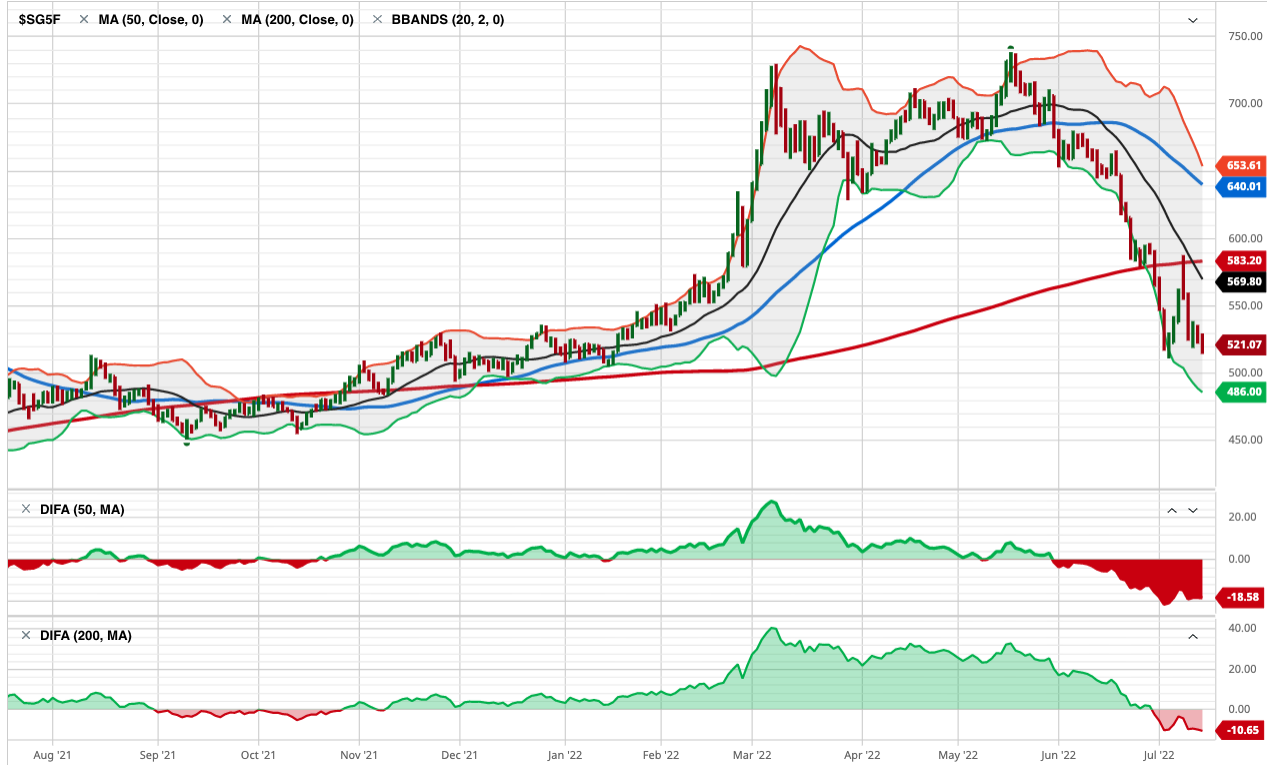
After an uptrend breakout around March, S&P GSCI Biofuel Index has trended back to the same level it started.
Some of the most common products produced with soybeans are tofu, soy milk, soy sauce, and soy flour. Approximately 85% of soybeans grown around the world are used to make vegetable oils that are either sold to consumers or used commercially according to The Spruce Eats. The USDA says “Just over 70 percent of the soybeans grown in the United States are used for animal feed, with poultry being the number one livestock sector consuming soybeans, followed by hogs, dairy, beef and aquaculture.”
You can probably see how interconnected all this stuff is.
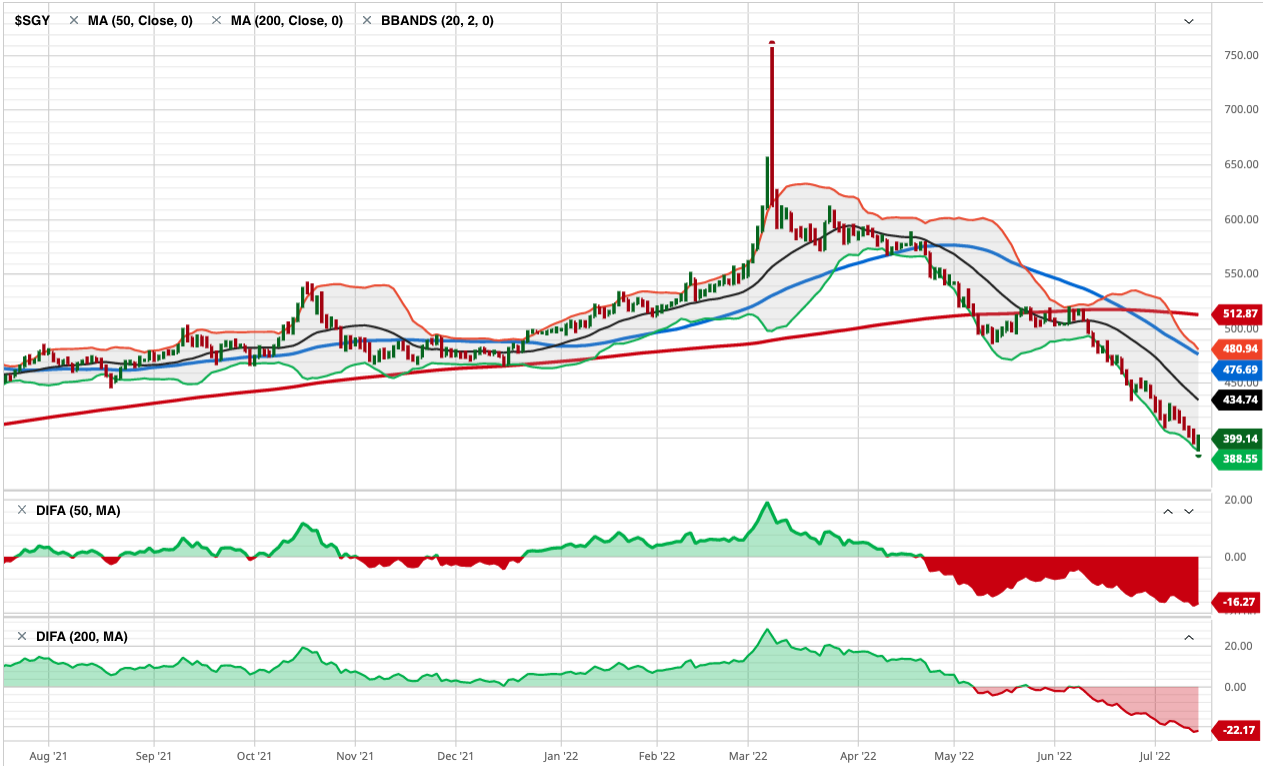
S&P GSCI Soybeans Index is in a downtrend after an uptrend started at the beginning of this year. Hopefully, this lower animal feed cost will help lower the prices of the livestock that are in uptrends.
Lead is still widely used for car batteries, pigments, ammunition, cable sheathing, weights for lifting, weight belts for diving, lead crystal glass, radiation protection and in some solders, according to RSC.org.
S&P GSCI Lead Index is in a downtrend, so I guess we’ll eventually see the price of ammo and car batteries decline, too. Overall, lead has been a non-trending volatile market the past year, but it’s now more decisively in a dowtrend.

Lean Hog is a type of hog (pork) futures contract that can be used to hedge and to speculate on pork prices.
S&P GSCI Lean Hogs Index has trended into a downtrend, so your bacon price may improve.
Palladium is one of a number of metals starting to be used in the fuel cells to power things like cars and buses as well as in jewelry and in dental fillings and crowns.
S&P GSCI Palladium Index is in a downtrend.

Grains are used around the world and are also called cereals, and are the most important staple food. According to NatGeo, humans get an average of 48 percent of their calories, or food energy, from grains. Grains are also used to feed livestock and to manufacture some cooking oils, fuels, cosmetics, and alcohols.
S&P GSCI Grains Index is in a downtrend after it broke up with momentum going into this year. If you like to eat and drink alcohol, this is great news as it seems the prices should drift back to where they were.
Wheat is used for white bread, pastries, pasta, and pizza, so this downtrend in S&P GSCI Wheat Index is a welcome change.
Dr. Copper is market lingo for the base metal that is reputed to have a “Ph. D. in economics” because of its ability to predict turning points in the global economy.
S&P GSCI Copper Index is in a strong downtrend, so if its reputation holds true, the Ph. D. in economics suggests a global economic slowdown is ahead.

The Royal Society of Chemistry says aluminum is used in a huge variety of products including cans, foils, kitchen utensils, window frames, beer kegs and airplane parts.
If the trend in S&P GSCI Aluminum Index is a guide, the price of your next beer keg or airplane should drift lower. Aluminum is in a downtrend.

Industrial Metal alloys are known for their strength, durability, and corrosion resistance, so engineers, architects, and others in the industrial field use these alloys to construct buildings, wires, pipes, bridges, machines, and much more according to Wieland.
S&P GSCI Industrial Metals Index shows industrial metals are in a downtrend with great momentum.
Industrial metals are down so much I’ll show a two-year chart to see the price is back to 2020 levels.
Last but not least is cotton. I think we all know what cotton is used for. The price of clothes should see some decline with S&P GSCI Cotton Index in such a downtrend.
What we’ve observed is many commodity markets were in uptrends, but have more recently trended down. Not all of these necessarily impact the Consumer Price Index, but we certainly use most if not all of them one way or another.
Commodities are real “stuff”, and the prices of much of this stuff are no longer as elevated as it was. If this flows into lowering prices of the stuff we buy, then we’ll see inflation fall from here.
If inflation trends down from here, it’ll be positive for stocks and bonds and may result in the Federal Reserve pausing its aggressive interest rate hikes.
Now you know why we aren’t long commodities at this point.
Investor sentiment (about stocks) is so negative right now, that any slight improvement in inflation may spark an uptrend, then the extremely bearish positioning may drive short covering to keep the trend going a while.
Let’s see how it all unfolds.
Mike Shell is the Founder and Chief Investment Officer of Shell Capital Management, LLC, and the portfolio manager of ASYMMETRY® Managed Portfolios. Mike Shell and Shell Capital Management, LLC is a registered investment advisor focused on asymmetric risk-reward and absolute return strategies and provides investment advice and portfolio management only to clients with a signed and executed investment management agreement. The observations shared on this website are for general information only and should not be construed as investment advice to buy or sell any security. This information does not suggest in any way that any graph, chart, or formula offered can solely guide an investor as to which securities to buy or sell, or when to buy or sell them. Securities reflected are not intended to represent any client holdings or recommendations made by the firm. In the event any past specific recommendations are referred to inadvertently, a list of all recommendations made by the company within at least the prior one-year period may be furnished upon request. It should not be assumed that recommendations made in the future will be profitable or will equal the performance of the securities on the list. Any opinions expressed may change as subsequent conditions change. Please do not make any investment decisions based on such information, as it is not advice and is subject to change without notice. Investing involves risk, including the potential loss of principal an investor must be willing to bear. Past performance is no guarantee of future results. All information and data are deemed reliable but are not guaranteed and should be independently verified. The presence of this website on the Internet shall in no direct or indirect way raise an implication that Shell Capital Management, LLC is offering to sell or soliciting to sell advisory services to residents of any state in which the firm is not registered as an investment advisor. The views and opinions expressed in ASYMMETRY® Observations are those of the authors and do not necessarily reflect the position of Shell Capital Management, LLC. The use of this website is subject to its terms and conditions.

You must be logged in to post a comment.