
Commodities are trending with better momentum than stocks over the past year.
A commodity is a raw material or primary agricultural product that can be bought and sold, such as copper or coffee. A commodity is a basic good used in commerce that are usually used as inputs in the production of other goods or services.
Soft commodities are goods that are grown, such as wheat, or rice.
Hard commodities are mined. Examples include gold, helium, and oil.
Energy commodities include electricity, gas, coal, and oil. Electricity has the particular characteristic that it is usually uneconomical to store, and must, therefore, be consumed as soon as it is processed.
The Commodity Trend
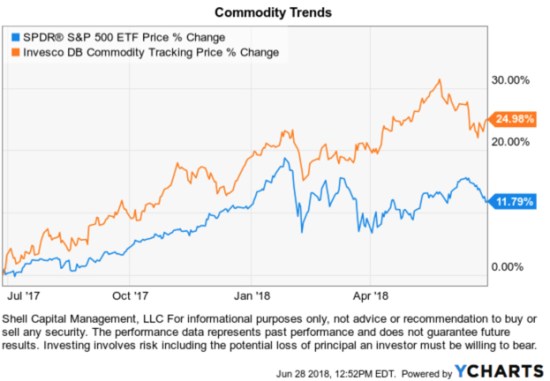
At first glance, we see in the chart commodities ETF Invesco DB Commodity Index Tracking ETF has trended meaningfully above the popular S&P 500 index of U. S. stocks. The relative outperformance is clear over this one-year time frame. Commodities, as measured by this ETF, are in an absolute positive trend and registering relative momentum.
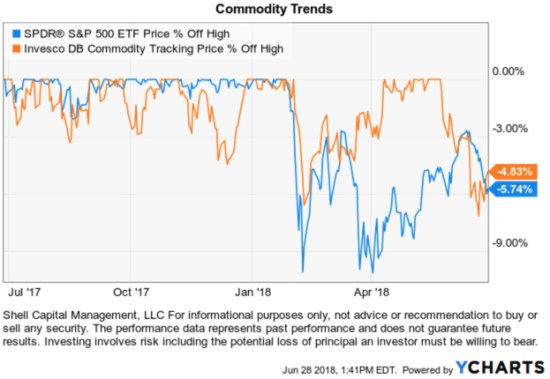
Examining a price trend is incomplete without also considering its downside. On the downside, I look at the % off high drawdowns over the period. We see that commodities were more volatile than stocks before 2018 with four dips around -4%. Since the stock market -10% decline that started in February, commodities declined, too, but not as much as U. S. stocks.
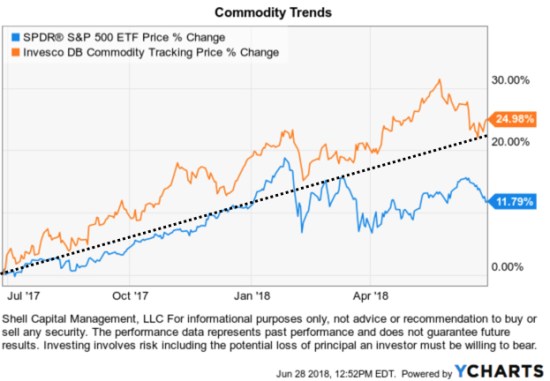
Looking back at the trend chart, I added a simple trend line to show that communities are trending directionally better than the popular U. S. stock index. So, my quantitative Global Tactical Rotation® system that ranks an unconstrained global universe of markets including bonds, stocks, commodities, currencies, and other alternatives like real estate signaled this trend has been generating asymmetric risk/return.
What is the that Invesco DB Commodity Index Tracking ETF? (the bold emphasis is mine)
The Invesco DB Commodity Index Tracking Fund seeks to track changes, whether positive or negative, in the level of the DBIQ Optimum Yield Diversified Commodity Index Excess Return™ (DBIQ Opt Yield Diversified Comm Index ER) plus the interest income from the Fund’s holdings of primarily US Treasury securities and money market income less the Fund’s expenses. The Fund is designed for investors who want a cost-effective and convenient way to invest in commodity futures. The Index is a rules-based index composed of futures contracts on 14 of the most heavily traded and important physical commodities in the world. The Fund and the Index are rebalanced and reconstituted annually in November.
This Fund is not suitable for all investors due to the speculative nature of an investment based upon the Fund’s trading which takes place in very volatile markets. Because an investment in futures contracts is volatile, such frequency in the movement in market prices of the underlying futures contracts could cause large losses. Please see “Risk and Other Information” and the Prospectus for additional risk disclosures. Source: Invesco
The challenge for some investors, however, is that Invesco DB Commodity Index Tracking ETF generates a K-1 tax form for tax reporting. That isn’t a terrible issue, but it means instead of receiving the typical 1099 investors receive a K-1. Some investors aren’t familiar with a K-1, and they can obtain them later than a 1099.
Then, there may be other investors who simply prefer not to own futures for the reason in the second paragraph of the above discription: “Because an investment in futures contracts is volatile, such frequency in the movement in market prices of the underlying futures contracts could cause large losses.” In reality, all investments have risk and stocks can have just as much risk of “large losses” as commodity futures, but it’s a matter of investor preference and perception.
Since we have a wide range of investor types who invest in my ASYMMETRY® Investment Program I could gain my exposure to commodities in other ways. For example, the SPDR® S&P® Global Natural Resources ETF often has a similar return stream as ETFs like DBC that track a commodity futures index, except is actually invests in individual stocks instead.
Key features of the SPDR® S&P® Global Natural Resources ETF
-
The SPDR® S&P® Global Natural Resources ETF seeks to provide investment results that, before fees and expenses, correspond generally to the total return performance of the S&P® Global Natural Resources Index (the “Index”)
-
Seeks to provide exposure to a number of the largest market cap securities in three natural resources sectors – agriculture, energy, and metals and mining
-
Maximum weight of each sub-index is capped at one-third of the total weight of the Index
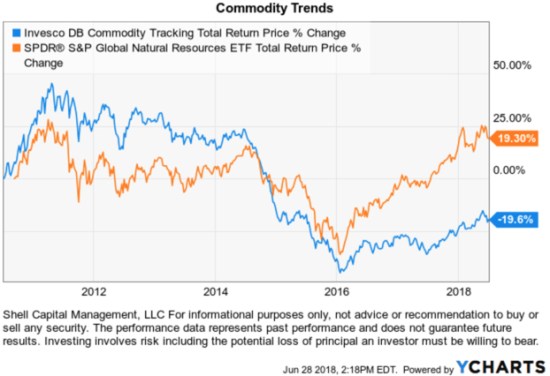
Below we see the price trend of this ETF of global natural resources stocks has been highly correlated to an ETF of commodities futures.
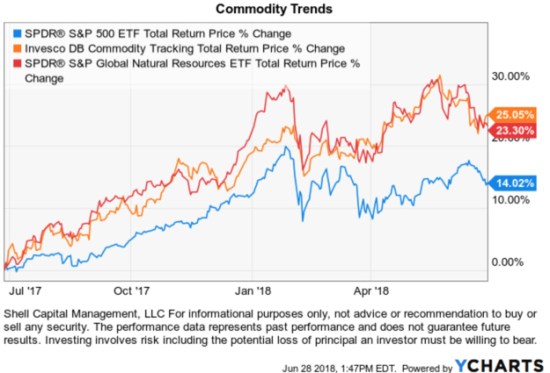
In fact, as we step the time frame out to the common inspection date of each ETF in 2011, the SPDR® S&P® Global Natural Resources ETF has actually outperformed Invesco DB Commodity Index Tracking ETF overall in terms of relative momentum.
ETFs are subject to risk similar to those of stocks including those regarding short-selling and margin account maintenance. Ordinary brokerage commissions apply. In general, ETFs can be expected to move up or down in value with the value of the applicable index. Although ETF shares may be bought and sold on the exchange through any brokerage account, ETF shares are not individually redeemable from the Fund. Investors may acquire ETFs and tender them for redemption through the Fund in Creation Unit Aggregations only. Please see the prospectus for more details. After-tax returns are calculated based on NAV using the historical highest individual federal marginal income tax rates and do not reflect the impact of state and local taxes. Actual after-tax returns depend on the investor’s tax situation and may differ from those shown. The after-tax returns shown are not relevant to investors who hold their fund shares through tax-deferred arrangements such as 401(k) plans or individual retirement accounts. Performance of an index is not illustrative of any particular investment. It is not possible to invest directly in an index. As with all stocks, you may be required to deposit more money or securities into your margin account if the equity, including the amount attributable to your ETF shares, declines. Unless otherwise noted all information contained herein is that of the SPDR S&P Global Natural Resources ETF. S&P – In net total return indices, the dividends are reinvested after the deduction of withholding tax. Tax rates are applied at the country level or at the index level.

Pingback: The week in review « ASYMMETRY® Observations