Every new price trend begins with a countertrend, and that’s true for uptrends that roll over into downtrends and downtrends that reverse into uptrends, so trend following starts with a countertrend.
Technology-weighted Nasdaq 100 changed the short-term trend, breaking out above its 50-day average, now in a short-term uptrend.
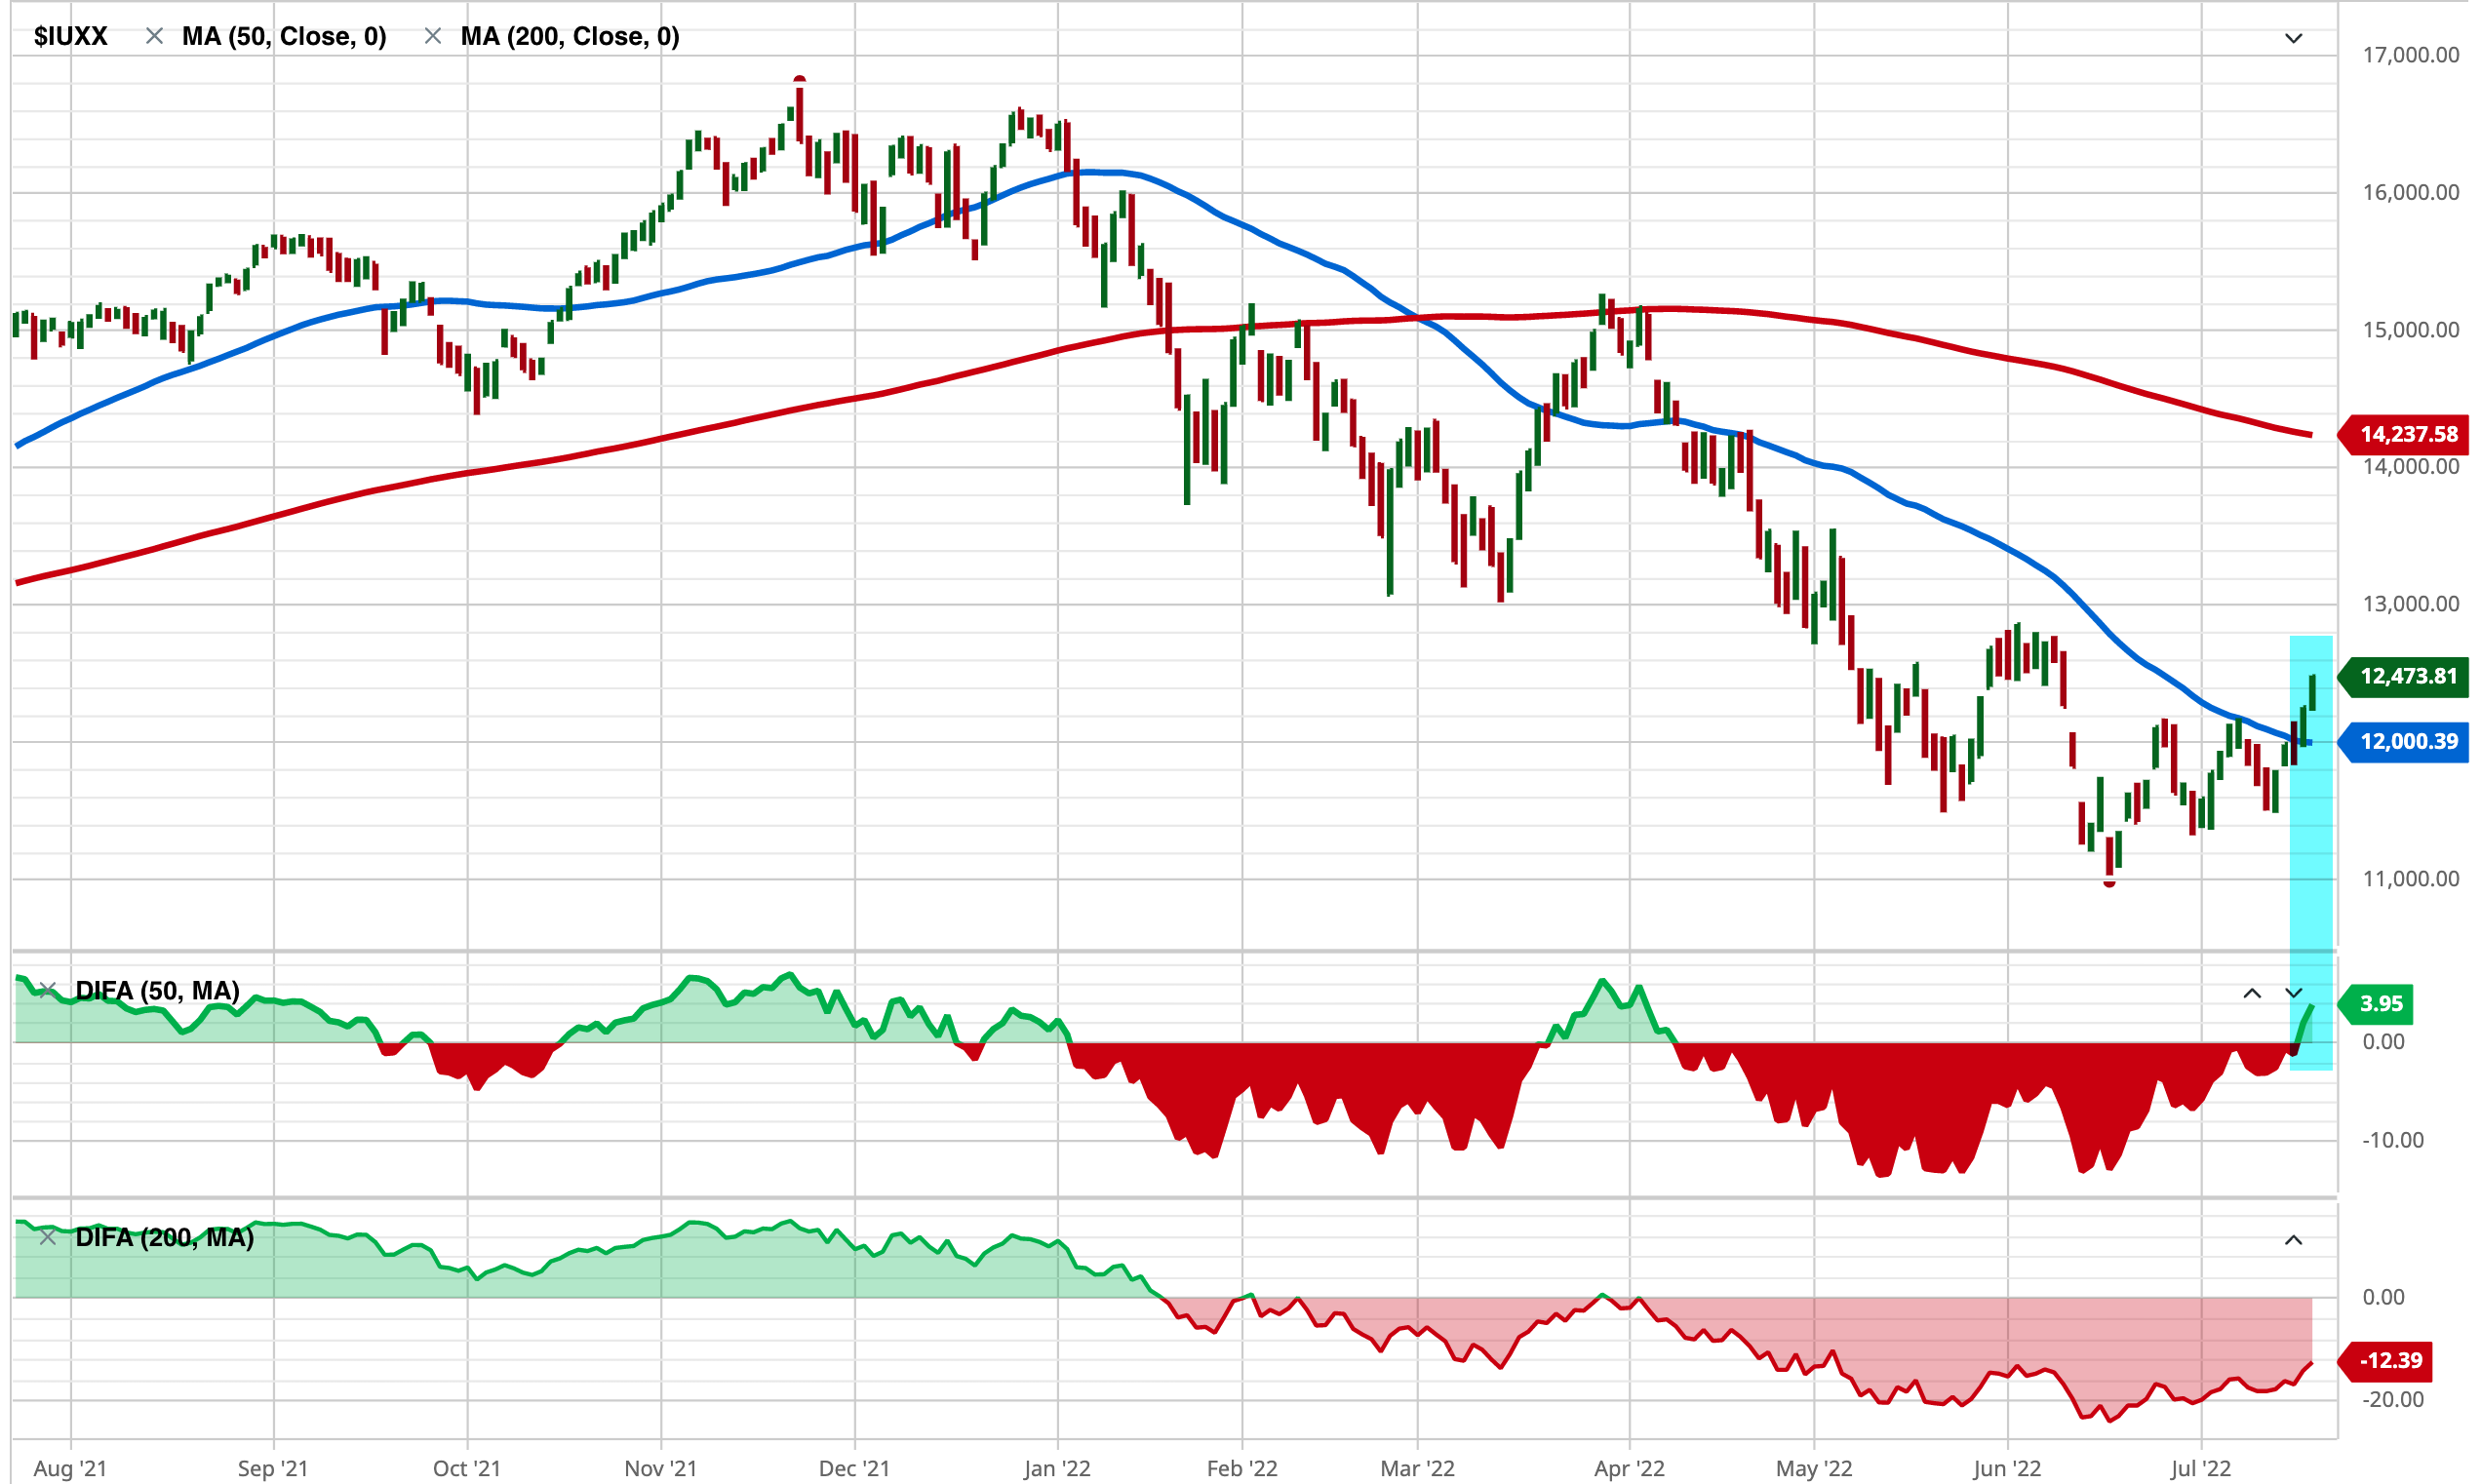
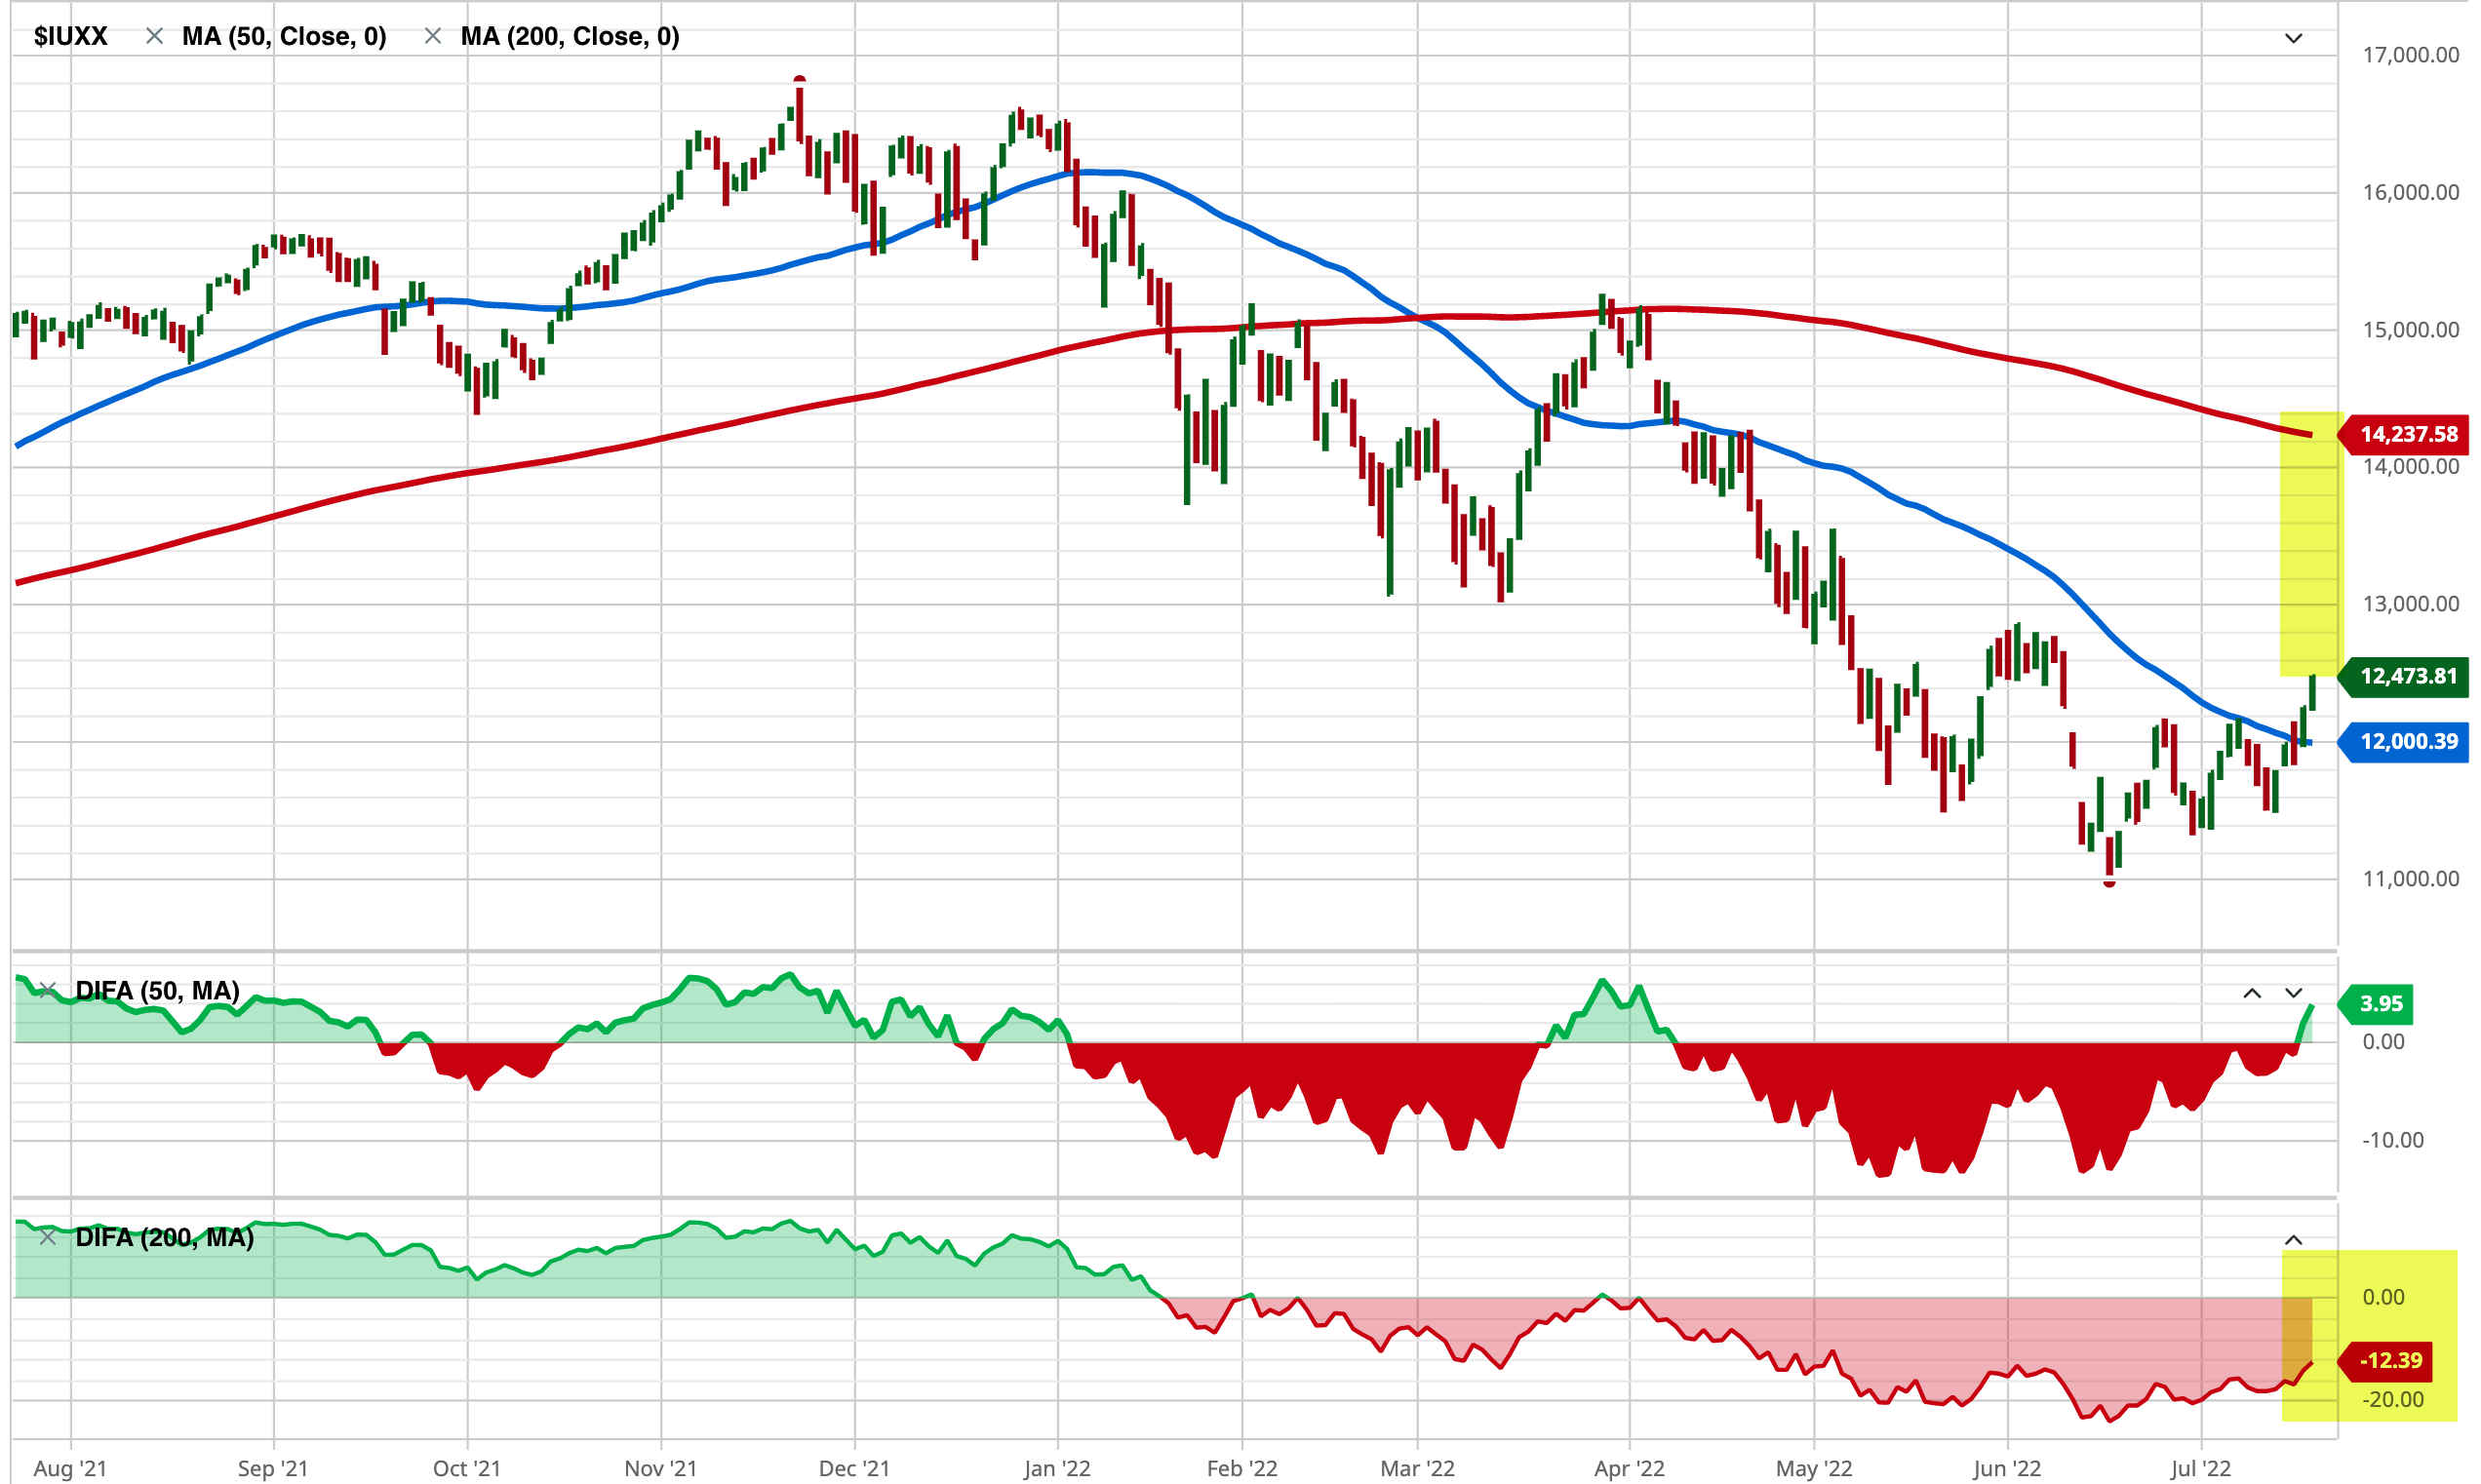
Past performance is never a guarantee of future performance, but if the Nasdaq uptrend follows through, it’ll need to trend up more than 12% to trade above the longer-term 200-day average.
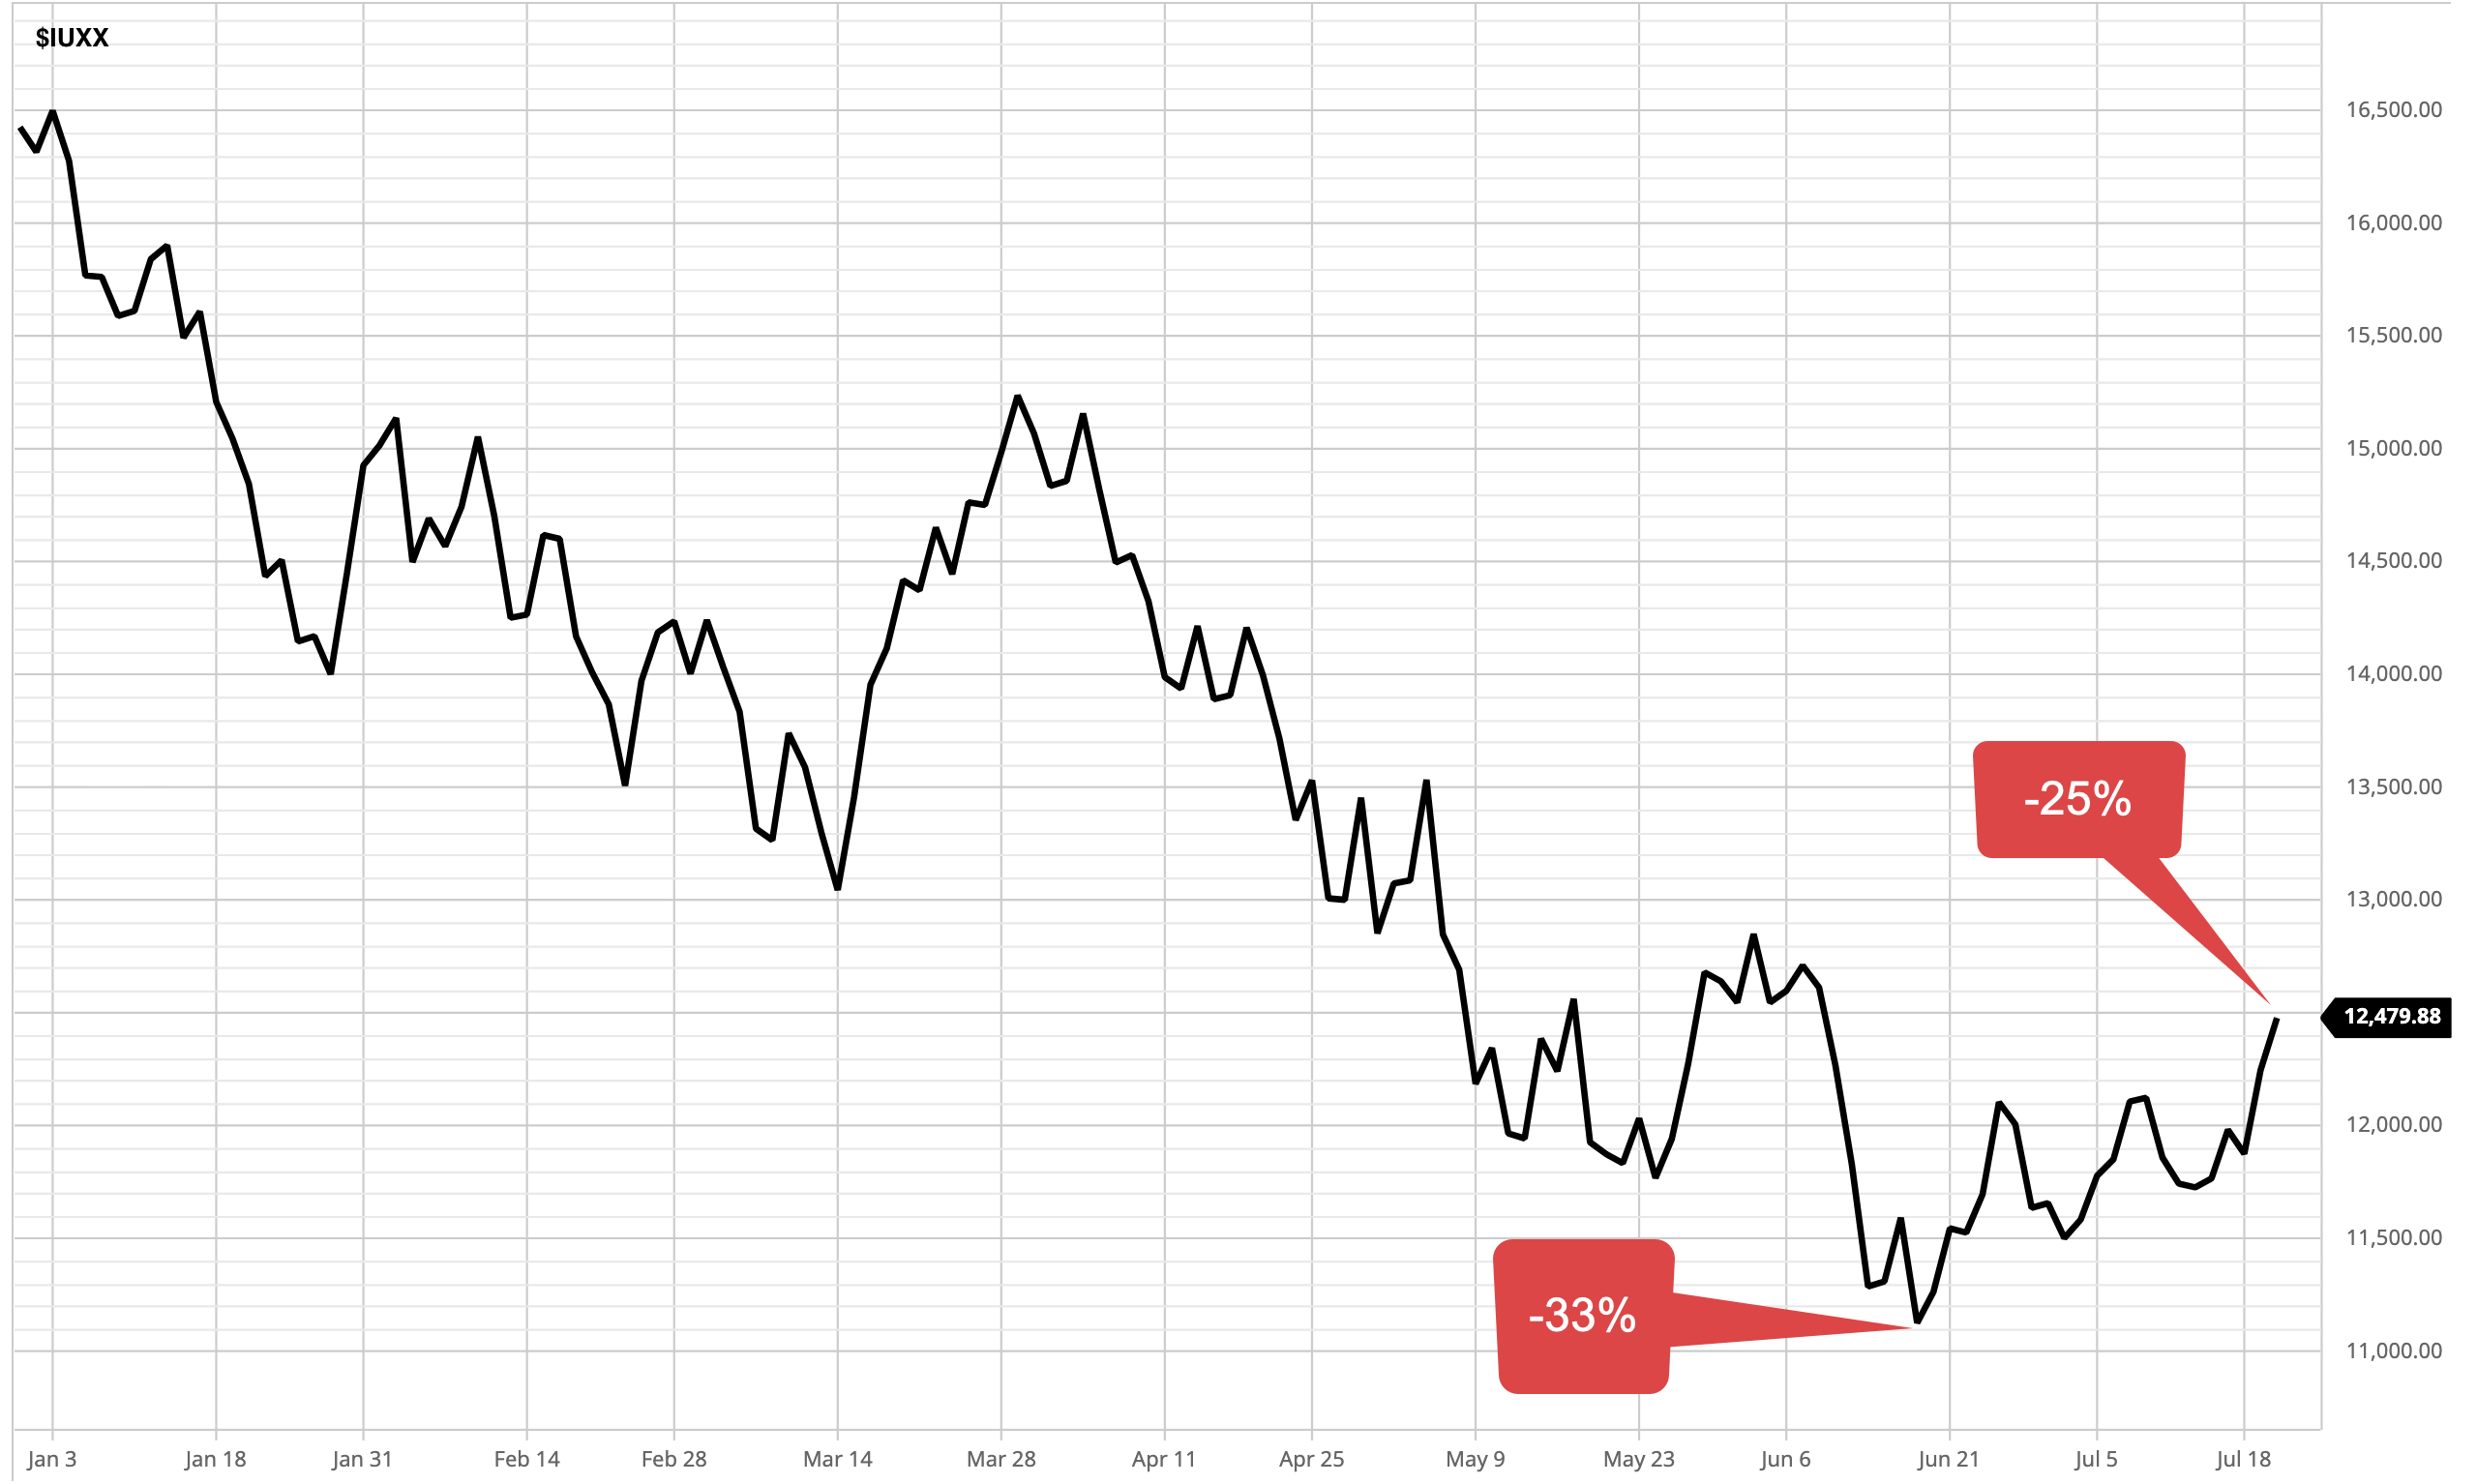
Nasdaq meets first overhead supply as potential resistant around 13,000.

All the areas above current prices are the hurdle of a trend trying to recover from losses.
Why?
Because many investors and traders may be trapped in losses around those prior lows and highs, the price levels attracted much historical trading.
Many tactical traders mistakenly claim resistance “is” at these levels, but we don’t know if there is resistance to further prices trending up until the price range is reached.
If a price trend reaches a level and reverses back, then we know there was “resistance” to that price level, which means there was selling pressure once the price got to that higher level.
Only time will tell if that is the case here, but we’ll be watching to see if new uptrends are met with selling prior price levels of interest, then we’ll know how much trouble these trends will have trending up into areas investors may have wished they had sold before taking on heavy losses.
To see what I mean, the Nasdaq 100 index was down -33% year to date a few weeks ago, and after a series of higher lows and higher highs (an uptrend) it’s still down -25%.
If you were invested in the Nasdaq type investment this year, or a portfolio of similar stocks, you’ve been in a loss trap.
As prices trend back up, trapped holders may start to tap out, although others may hold on until they get back to breakeven.
This is the kind of price action we’ll observe unfold from here to see which market dynamics are more dominant.
Overhead supply of shares wanting to be sold becoming at least some pressure as resistance is why price trends look so rough and volatile after a downtrend.
At every level the trend reaches, other investors and traders are deciding to buy, hold, or sell.
It’s what makes a market.
For now, we have an uptrend in enough of the high-growth stocks as measured by the Nasdaq 100 index to clear the 50-day average, so no resistance there.
Every new price trends begin with a countertrend and a follow-through.
Let’s see how it goes from here.
Giddy up!
Mike Shell is the Founder and Chief Investment Officer of Shell Capital Management, LLC, and the portfolio manager of ASYMMETRY® Managed Portfolios. Mike Shell and Shell Capital Management, LLC is a registered investment advisor focused on asymmetric risk-reward and absolute return strategies and provides investment advice and portfolio management only to clients with a signed and executed investment management agreement. The observations shared on this website are for general information only and should not be construed as investment advice to buy or sell any security. This information does not suggest in any way that any graph, chart, or formula offered can solely guide an investor as to which securities to buy or sell, or when to buy or sell them. Securities reflected are not intended to represent any client holdings or recommendations made by the firm. In the event any past specific recommendations are referred to inadvertently, a list of all recommendations made by the company within at least the prior one-year period may be furnished upon request. It should not be assumed that recommendations made in the future will be profitable or will equal the performance of the securities on the list. Any opinions expressed may change as subsequent conditions change. Please do not make any investment decisions based on such information, as it is not advice and is subject to change without notice. Investing involves risk, including the potential loss of principal an investor must be willing to bear. Past performance is no guarantee of future results. All information and data are deemed reliable but are not guaranteed and should be independently verified. The presence of this website on the Internet shall in no direct or indirect way raise an implication that Shell Capital Management, LLC is offering to sell or soliciting to sell advisory services to residents of any state in which the firm is not registered as an investment advisor. The views and opinions expressed in ASYMMETRY® Observations are those of the authors and do not necessarily reflect the position of Shell Capital Management, LLC. The use of this website is subject to its terms and conditions.

You must be logged in to post a comment.