With the stock market swinging up and down with the volatility expansion we’ve seen since February many investors are probably wondering which way stocks are going to trend.
Individual investors should be aware of the big picture.
The primary trend has been up since March 2009 with several declines interrupting it along the way. In fact, there have been eight declines more than -10% and three of them were between -15% and -20%. But, none have been over -20%, which is the level most define as a “bear market”. So, this is the longest bull market in U.S. stocks in history.
Many investors may realize that trends cycle up and down and when a trend moves longer or farther than normal, they may be expected to swing the other way longer and farther. For this reason, the intelligent investor is probably on alert for signs of the beginning of a change in the primary trend from a bull market to a bear market.
Market cycles aren’t just the longer primary trends, they are made up of many smaller trends that may be tradeable swings up and down. Avoiding a large bear market isn’t as simple as predicting it and then exiting the stock market until it’s over. We never know for sure in advance when a primary trend shifts from positive to negative and back to positive. In the real world, we focus on shorter time frames and have to deal with the short-term price swings that happen as a trend unfolds.
Despite the recent volatility and the down days, at this point, the U.S. stock market primary trend remains up. We say that because this two-year chart shows higher highs and higher lows. For that to change, we would need to see the stock index decline and stay below the prior lows. Of course, that is a possibility, but those who are following the trends respond to the actual change of trend.

One positive confirming indicator is improving breadth during the recent swing up from the October low.
The Advance-Decline Line is a breadth indicator that indicates the level participation of the stocks in an index like the S&P 500. For example, a broad advance shows the internal strength that is lifting most boats, which is bullish. A narrow advance would show a mixed market that is selective instead of broad participation. So far, we’ve seen the S&P 500 Advance-Decline Line make a higher high in the upswing, even though the S&P 500 index itself has declined the past few days.
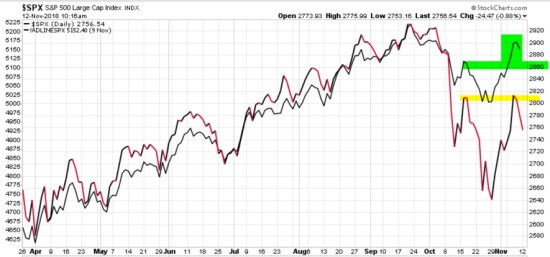
One of the characteristics of the Advance-Decline Line is that it treats all 500 stocks the same, giving them equal weight. The standard S&P 500 stock index that investors track is a capitalization-weighted index that weights the largest stocks in the index much more heavily. Since the Advance-Decline Line gives each of the 500 stocks equal power, it emphasizes small and mid-cap stocks more. To get a more accurate view of the Advance-Decline Line relative to the stock index, we can use the S&P 500 Equal Weighted Index. I included it below. As we see, the equal-weighted stock index has trended up more similar to the Advance-Decline Line – and both of them made a higher high.

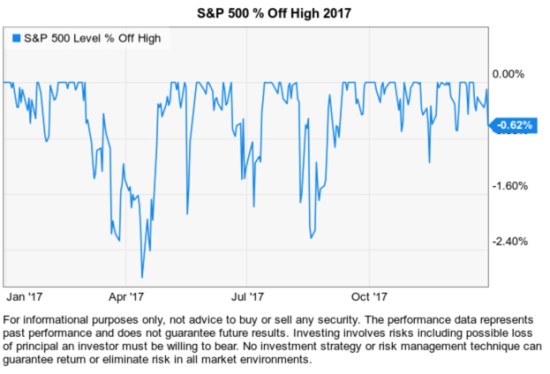
We continue to observe a much more volatile market condition than we saw in 2017. That should be no surprise since the CBOE Volatility Index indicates implied volatility has been elevated as we’ve seen this volatility expansion. However, it’s at 20 today, which is its long-term average.

Looking back over two years, the next chart shows how much more elevated implied volatility was over last year.

Volatility is mean reverting, which means volatility tends to swing from higher states to lower states. Although the VIX long-term average is 20, it rarely stays at that level. Instead, it swings up and down.
2018 has been a volatile year for stocks by any measure, but it may seem even more volatile since 2017 was so quiet.
So far in 2018, the S&P 500 stock index has been down -1% or more on 21 days.
In 2017, stocks only had a -1% or more down day 4 days the whole year.
By that measure, does it make 2018 a volatile year? Or 2017 a calm year?
2016 had 22 days the S&P 500 stock index was down over -1%
2015 had 32 days the S&P 500 stock index was down over -1%
By this measure, 2017 was an unusually calm year for U.S. stocks. 2018 isn’t a lot different than 2015 and 2016.
Individual down days don’t make a trend unless you are a day trader, which we are not. We measure market risk by actual drawdown. Below is a chart of the drawdowns for the stock index year to date. The S&P 500 has declined -10% twice. A -10% within a year is normal, along with a couple of -5% drops. But, two -10% declines in a 12 month period isn’t all that abnormal, either.

One thing that may make the price trend swings and volatility seem unusual this year was the lack of it last year. Below is last year, when we didn’t see any drops more than -4%.
On January 24, 2018, I said:
I tell ya what… we haven’t seen a drawdown in the popular stock indexes in nearly a year and a half. We would normally see three or four. Those who don’t think that is important will probably be the investors who are dazed when we do see one.
#KnowYourRisk
Markets cycle and swing up and down over time, and so does volatility. At this point, we are observing an overall primary uptrend in U.S. stocks but the shorter-trend trend this year has shown us broader swings of +/- 10% or so as volatility has expanded and price swings have spread out.
Despite the down days Friday and today, the short term trend is relatively positive with positive participation as measured by the Advance-Decline Line. Only time will tell how it all plays out from here.
Mike Shell is the Founder and Chief Investment Officer of Shell Capital Management, LLC, and the portfolio manager of ASYMMETRY® Global Tactical.
The observations shared on this website are for general information only and are not specific advice, research, or buy or sell recommendations for any individual. Investing involves risk including the potential loss of principal an investor must be willing to bear. Past performance is no guarantee of future results. The presence of this website on the Internet shall in no direct or indirect way raise an implication that Shell Capital Management, LLC is offering to sell or soliciting to sell advisory services to residents of any state in which the firm is not registered as an investment advisor. Use of this website is subject to its terms and conditions.

Pingback: To Know Where You’re Going, Look at Where You’ve Been: The 2018 Year in Review « ASYMMETRY® Observations