Implied volatility is indicating another possible volatility expansion.
The VIX index is a calculation designed to produce a measure of a constant 30-day expected volatility of the U.S. stock market, derived from real-time, mid-quote prices of S&P 500® Index (SPX) call and put options.
The VIX had drifted below its long-term average of around 20, but as you can see in the chart, it’s printed a lower high.
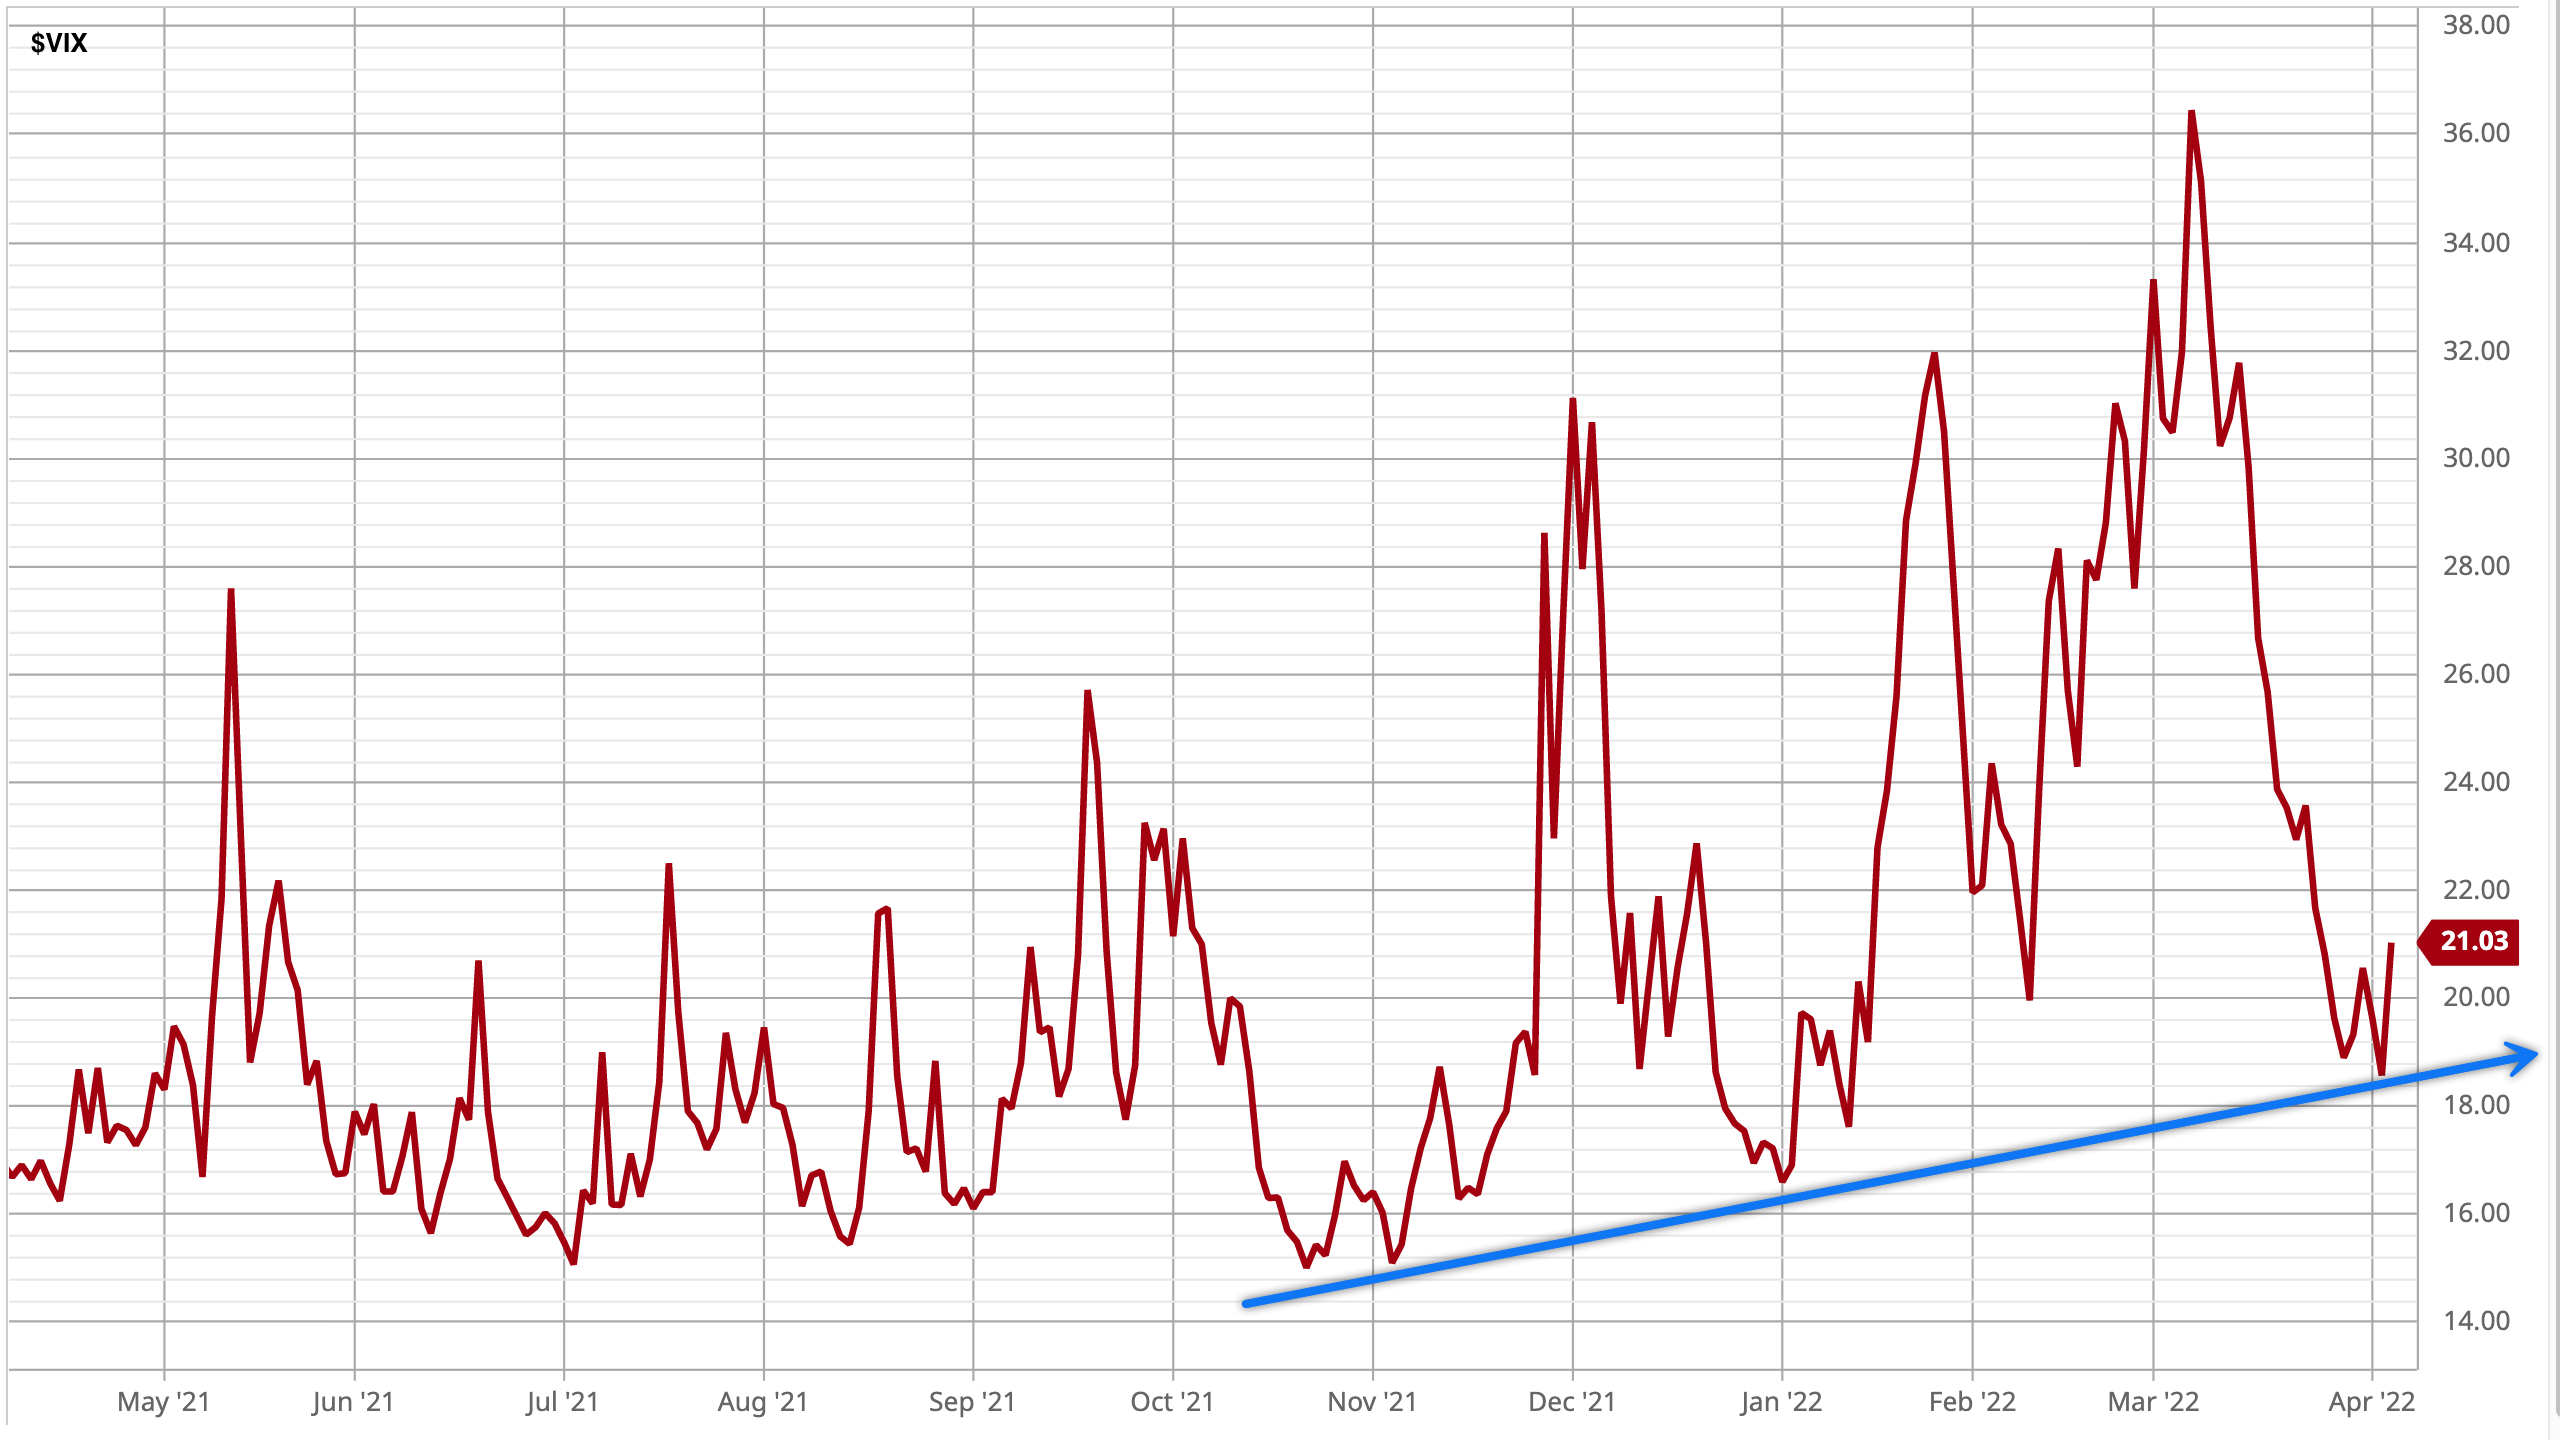
As the VIX remains elevated and in an uptrend as defined as higher lows and higher highs, it suggests the market expects stock prices to be more volatile.

You must be logged in to post a comment.