A lot of talk about the NASDAQ being 21% above its 200 day moving average

There’s a lot of talk about the NASDAQ being 21% above its 200 day moving average, so… here’s my 2 cents on the matter.

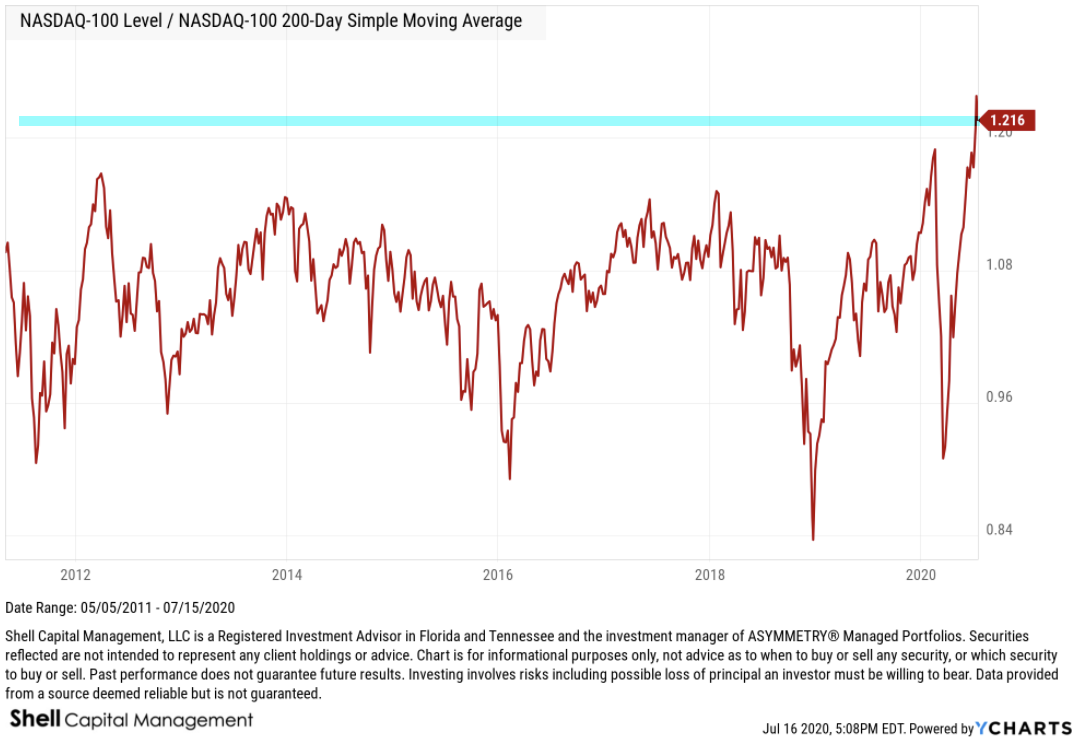
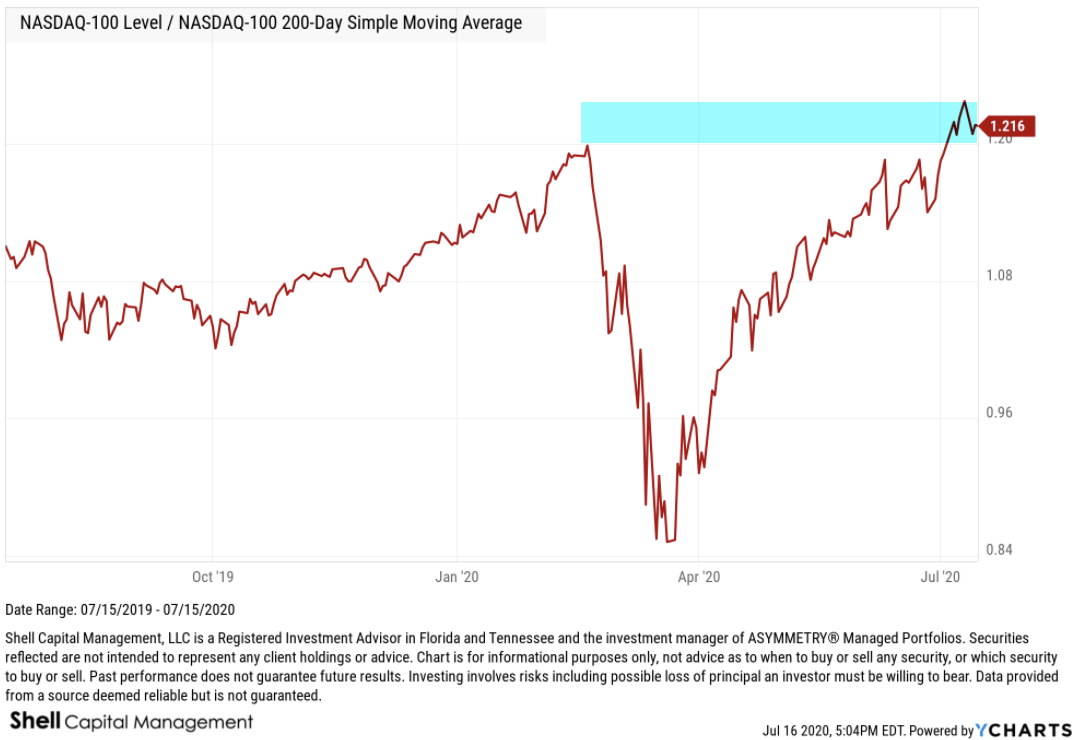
Yes indeed, the NASDAQ is over 21% above its 200 day moving average. So, if the 200 SMA is your exit, you’d endure a 21% drawdown waiting to sell. I’ve got a ratio chart for it, too. The 1.216 = 21.6% variation. Also note, it’s higher than it was in February.

Image

At a ratio of 1.20 it was high in February, since 1.20 = the level of the NASDAQ was 20% higher than its own 200 day SMA. How high is that?

It’s a decade high!

Image

So, yeah, the NASDAQ seems stretched…

Like the CBOE Put/Call Ratio I shared in Here’s what the equity options put call ratio is telling us, and what it isn’t, the % above a moving average is another indication of sentiment.

When it’s as high as it is now, the market very enthusiastic.

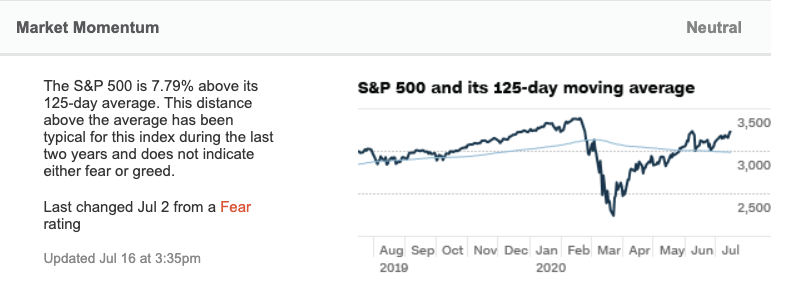
For example, the Fear & Greed Index calls it market momentum and uses the 125 on the S&P 500 as a measure of investor sentiment.

Image

Chatting with some friends on Twitter, someone asked about the relative comparison to the 2000 stock market bubble.

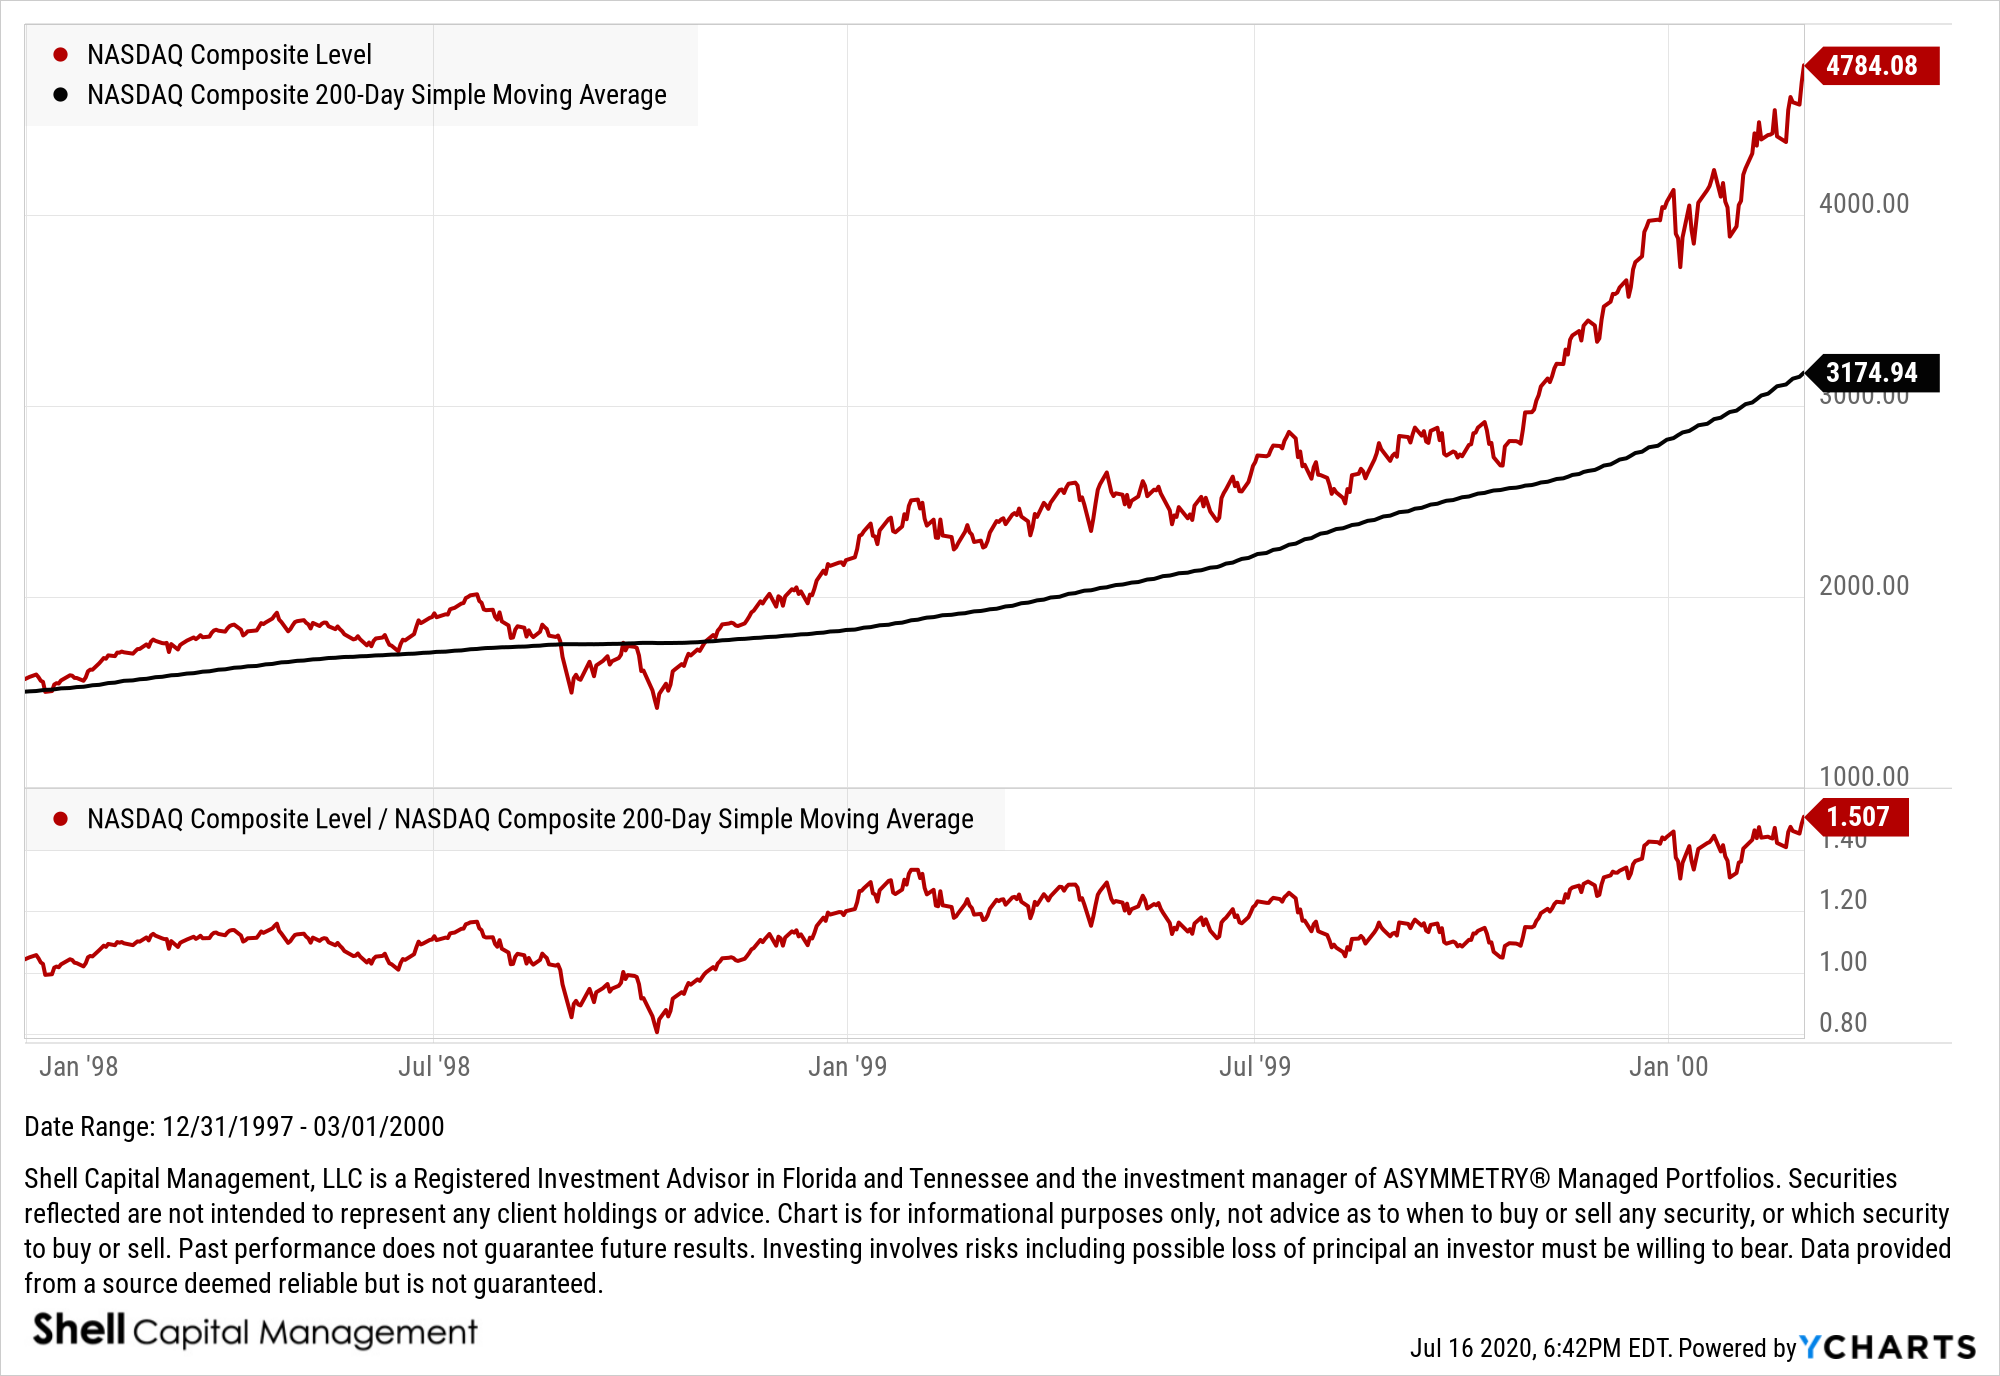
The current period is no comparison to 1999-2000 when the NASDAQ was 50% above its 200 day SMA.

Image

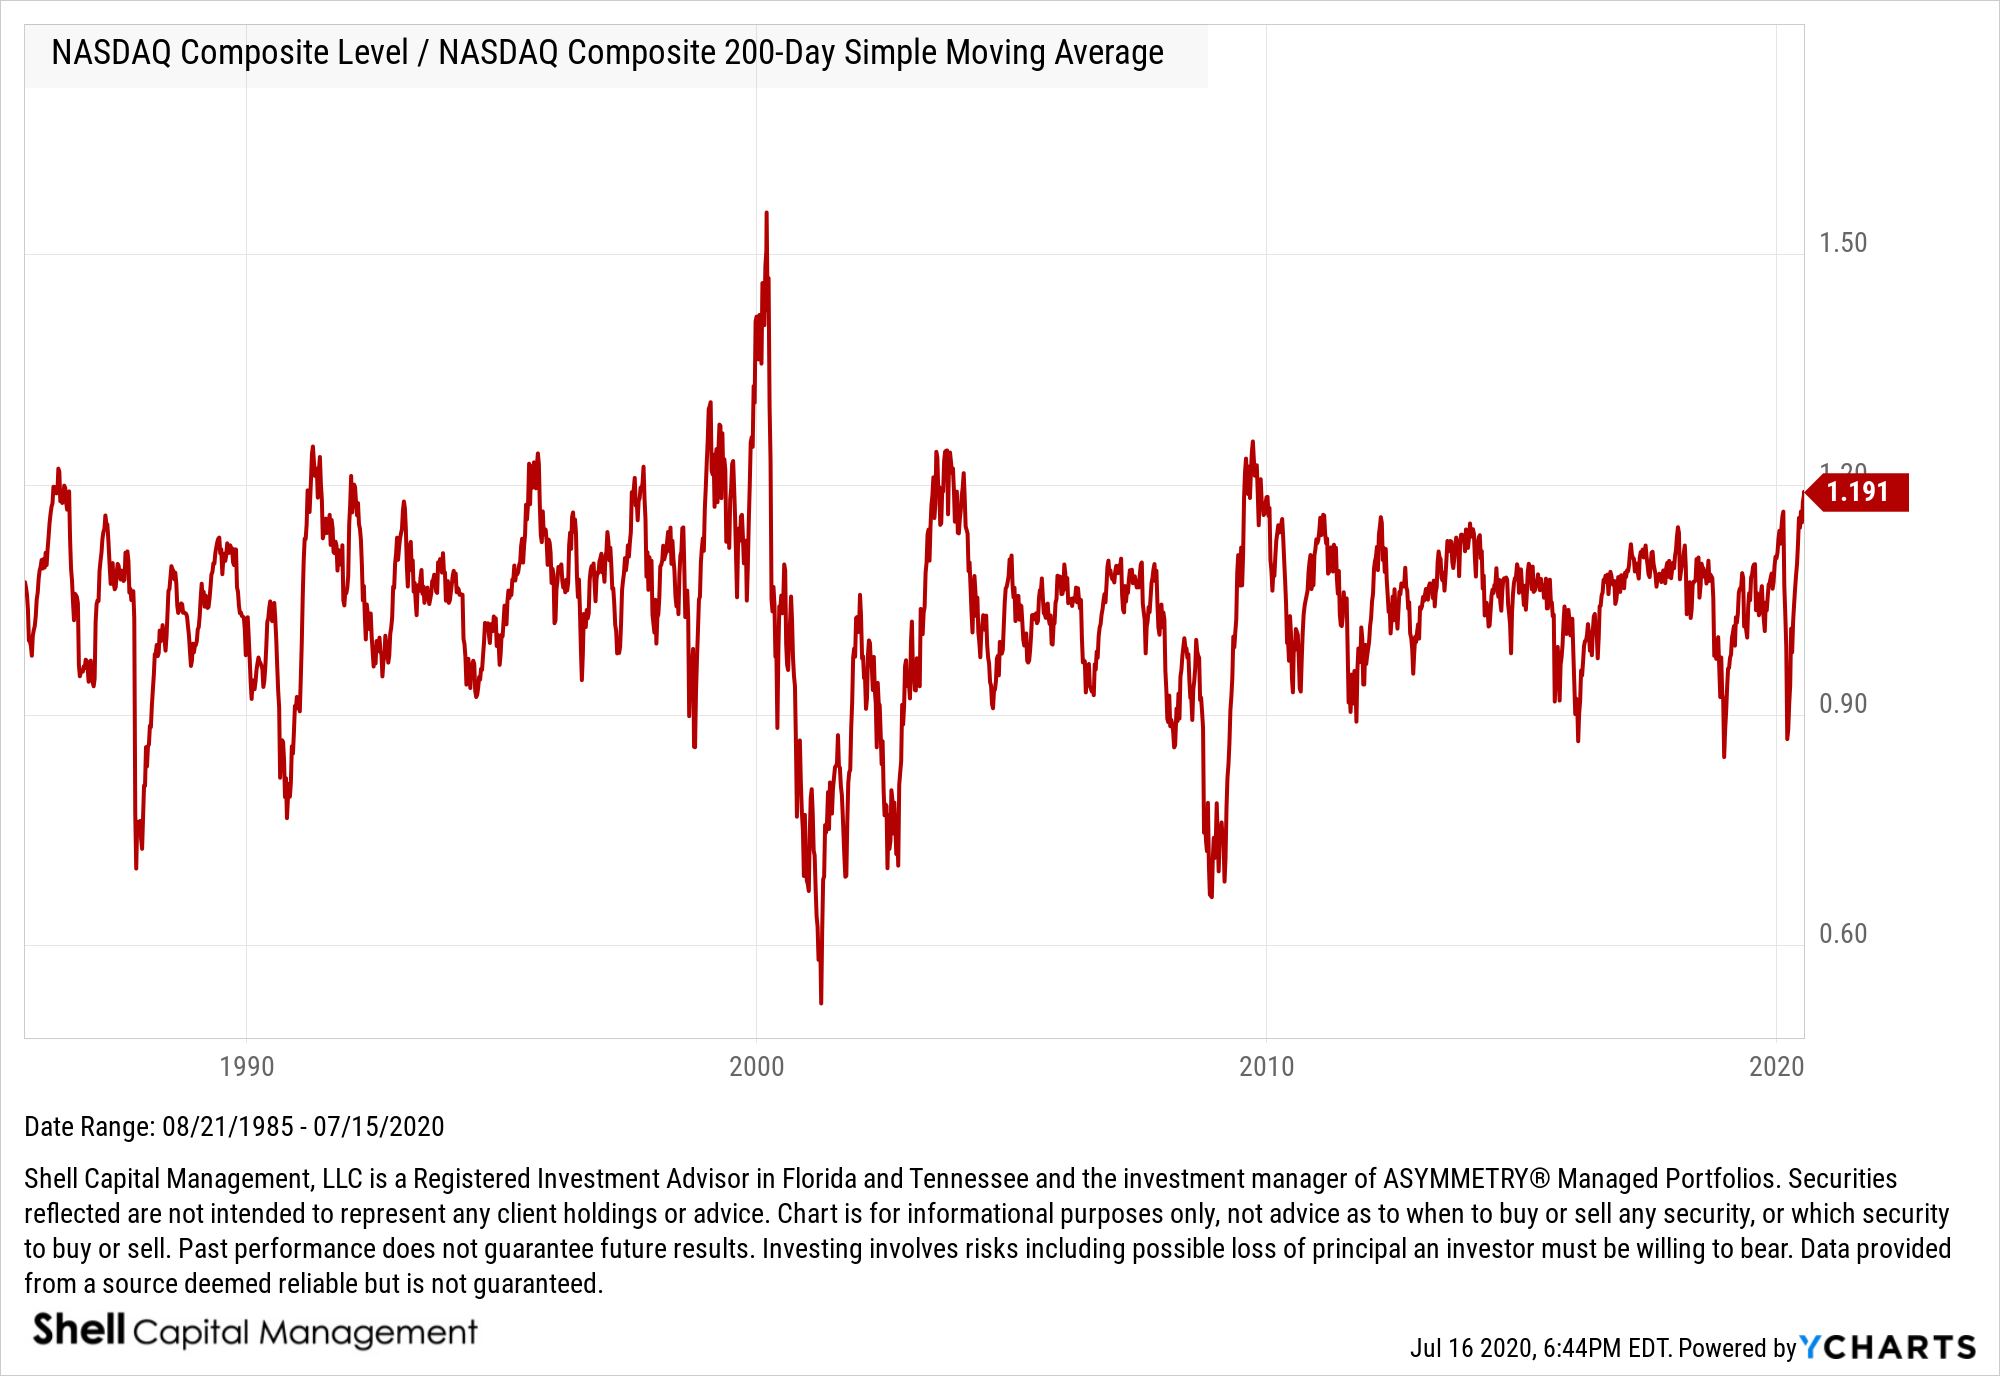
Here is the ratio between the NASDAQ and its own 200-day moving average back to 1985. The relative ratio level the NASDAQ got in 1999 was the highest ever seen.

Image

Interestingly, I first started observing to get trading signals from relative strength ratio charts in the late 90s, and by the time 1999-2000 rolled around, I was comparing not only stocks to other stocks and their sector index, but also a cross section of global markets. For example, stocks vs. bonds, etc.

The NASDAQ was all the craze around 1999, and I had a t-shirt that said “NASDAQ; the world puts its stock in us.”

With technology leading with momentum, the tech heavy nas is seeing some popularity again.

Don’t miss out, get the email:

Join 39.5K other subscribers

Mike Shell is the Founder and Chief Investment Officer of Shell Capital Management, LLC, and the portfolio manager of ASYMMETRY® Global TacticalMike Shell and Shell Capital Management, LLC is a registered investment advisor focused on asymmetric risk-reward and absolute return strategies and provides investment advice and portfolio management only to clients with a signed and executed investment management agreement. The observations shared on this website are for general information only and should not be construed as advice to buy or sell any security. Securities reflected are not intended to represent any client holdings or any recommendations made by the firm. Any opinions expressed may change as subsequent conditions change.  Do not make any investment decisions based on such information as it is subject to change. Investing involves risk, including the potential loss of principal an investor must be willing to bear. Past performance is no guarantee of future results. All information and data are deemed reliable but is not guaranteed and should be independently verified. The presence of this website on the Internet shall in no direct or indirect way raise an implication that Shell Capital Management, LLC is offering to sell or soliciting to sell advisory services to residents of any state in which the firm is not registered as an investment advisor. The views and opinions expressed in ASYMMETRY® Observations are those of the authors and do not necessarily reflect a position of  Shell Capital Management, LLC. The use of this website is subject to its terms and conditions.

A few observations on Global Macro and Trend Following

A few observations on #GlobalMacro and #TrendFollowing

As I see it, trend following can be global macro and global macro can be trend following. I call my primary strategy “global tactical,” which is an unconstrained, go-anywhere combination of them both and multiple strategies.

There is no way to predict the future direction of the stock market with macroeconomics. There are far too many variables and the variability of those variables change and evolve. The way to deal with it is to simply evolve with the changing trends and direct and control risk.

For me, it’s about Man + Machine. I apply my proprietary tactical trading systems and methods to a global opportunity set of markets to find potentially profitable price trends. Though my computerized trading systems are systematic, I use their signals at my discretion.

I believe my edge in developing my systems and methods began by first developing skill at charting price trends and trading them successfully. If I had started out just testing systems, I’d only have data mined without the understanding I have of trends and how markets interact.

Without the experience of charting market trends starting in the 90’s I probably would have overfitted backtested systems as it seems others have. A healthy dose of charting skill and experience helped me to avoid systems that relied on trends that seemed unlikely to repeat.

For example, if one had developed a backtested system in 2000 without experience charting those prior trends in real-time, they’d have focused on NASDAQ stocks like Technology. The walk forward would have been a disaster. We can say the same for those who backtested post-2008.

All portfolio management investment decision-making is very challenging as we never know for sure what’s going to happen next. The best we can do is apply robust systems and methods based on a positive mathematical expectation and a dose of skilled intuition that comes with experience.

As such, ALL systems and methods are going to have conditions that are hostile to the strategy and periods you aren’t thrilled with the outcome. For me, self-discipline comes with knowledge, skill, and experience. I am fully committed, steadfast, and persistent in what I do.

Mike Shell is the Founder and Chief Investment Officer of Shell Capital Management, LLC, and the portfolio manager of ASYMMETRY® Global Tactical.

Mike Shell and Shell Capital Management, LLC is a registered investment advisor and provides investment advice and portfolio management exclusively to clients with a signed and executed investment management agreement. The observations shared on this website are for general information only and are not specific advice, research, or buy or sell recommendations for any individual. Investing involves risk including the potential loss of principal an investor must be willing to bear. Past performance is no guarantee of future results. All information provided is deemed reliable, but is not guaranteed and should be independently verified. The presence of this website on the Internet shall in no direct or indirect way raise an implication that Shell Capital Management, LLC is offering to sell or soliciting to sell advisory services to residents of any state in which the firm is not registered as an investment advisor. Use of this website is subject to its terms and conditions.

Welcome to March! A review of global asset allocation and global markets

In the first two months of 2019 global asset allocation has gained 4% to 8.6%. I use the iShares Core Global Allocation ETFs as a proxy instead of indexes since the ETFs are real world performance including costs. The four different allocations below represent different exposure to global stocks vs. bonds.

global asset allocation ETF ETFs asymmetric risk reward .jpg

I’m not advising anyone to buy or sell these ETFs, but instead using them as an example for what a broadly diversified global asset allocation portfolio looks like. Most financial advisors build some type of global asset allocation for their clients and try to match it with their risk tolerance. The more aggressive clients get more stocks and the most conservative clients get more bonds. Of course, this is just asset allocation, so the allocations are mostly fixed and do not change based on market risk/reward. This is very different than what I do, which is focus on asymmetric risk/reward by increasing and decreasing exposure to risk/reward based on my calculations of risk levels and the potential for reward. So, my system is global, but it’s tactical rotation rather than fixed allocation.

The iShares Core Allocation Funds track the S&P Target Risk Indexes. So, BlackRock is the portfolio manager managing the ETF and they are tracking S&P Target Risk Indexes. Here is their description:

S&P Dow Jones Indices’ Target Risk series comprises multi-asset class indices that correspond to a particular risk level. Each index is fully investable, with varying levels of exposure to equities and fixed income and are intended to represent stock and bond allocations across a risk spectrum from conservative to aggressive.

In other words, they each provide varying allocations to bonds and stocks. The Conservative model is more bonds, the Aggressive model is more stocks.

S&P Target Risk Conservative Index. The index seeks to emphasize exposure to fixed income, in order to produce a current income stream and avoid excessive volatility of returns. Equities are included to protect long-term purchasing power.

S&P Target Risk Moderate Index. The index seeks to provide significant exposure to fixed income, while also providing increased opportunity for capital growth through equities.

S&P Target Risk Growth Index. The index seeks to provide increased exposure to equities, while also using some fixed income exposure to dampen risk.

S&P Target Risk Aggressive Index. The index seeks to emphasize exposure to equities, maximizing opportunities for long-term capital accumulation. It may include small allocations in fixed income to enhance portfolio efficiency.

Below is an example of the S&P Target Risk Index allocations and the underlying ETFs they invest in. Notice their differences is 10% to 20% allocation between stocks and bonds.

Global Allocation Index Construction

These ETFs offer low-cost exposure to global asset allocation with varying levels of “risk,” which really means varying levels of allocations to bonds. I say they are “low-cost” because these ETFs only charge 0.25% including the ETFs they are invested in. Most financial advisors probably charge 1% for similar global asset allocation, not including trade commissions and the ETF or fund fees they invest in. Even the lowest fee advisors charge at least 0.25% plus the trade commissions and the fund fees they invest in. With these ETFs, investors who want long-only exposure all the time to global stock and bond market risk/return, they can get it in one low-cost ETF. However, they do come with the risks of being fully invested, all the time. These ETFs do not provide any absolute risk management.

As an unconstrained, go-anywhere, absolute return manager who does apply active risk management, I’m unconstrained from a fixed benchmark, so I don’t intend to track or “beat” a benchmark. I operate with the limitations of a fixed benchmark. My objective is to create as much total return I can within a given amount of downside risk so investors don’t tap out trying to achieve it. It doesn’t matter how much the return is if inveestors tap out during drawdowns before it’s achieved. However, I consider global asset allocation that “base rate.” If I didn’t think I could create better asymmetric risk/reward than these ETFs I wouldn’t bother doing what I do. I would just be passive and take the beatings in bear markets. If we can’t tolerate the beatings, we would invest in the more conservative ETF. I intend to create ASYMMETRY® and win by not losing, and that necessarily requires robust risk management systems and tactics.

Now that we know what they are, below are their total returns including dividends looking back over time. (To see the full history in the prospectus click: iShares)

In the chart below, we see the global asset allocation ETFs are attempting to get back to their September 2018 high. While the S&P 500 stock index is still down about -4% from its September 2018 high, the bonds in these ETFs helped reduce their drawdowns, so they have also recovered their losses better.

global tactical asset allocation asymmetric risk reward

To be sure, below are the drawdowns. The iShares Core Conservative ETF is only 30% stocks and 70% bonds, so it had a smaller drawdown and has recovered from it already. I added the S&P 500 in this chart with is 100% stocks to show how during this correction, the exposure to bonds helped offset losses in stocks. Diversification does not guarantee a profit or protect against a loss in a declining market. Sometimes diversification and even the broadest global asset allocation fails like it did in 2008.

GLOBAL TACTICAL ASSET ALLOCATION ASYMMETRIC RISK REWARD DRAWDOWN

We can look inside the ETF to see their exposures. Below we see the iShares Core Moderate ETF which is 60% stocks and 40% bonds largest holding is the iShares Core Total USD Bond Market ETF (IUSB) at 50% of the fund.

iShares Core Moderate Allocation ETF

Below is the 1-year total return chart including dividends for its largest holding. It has gained a total return of 2.9% the past year. All of the gains were this year.

iShares Core Total USD Bond Market ETF (IUSB)

Next, I added the other two largest holdings iShares Core S&P 500 ETF (IVV) and iShares Core MSCI International Developed Markets ETF (IDEV). The weakness was worse in international stocks. 

GLOBAL ASSEST ALLOCATION ADVISORS TACTICAL

No total return chart is complete without also looking at its drawdowns. The combination of the total return chart and the drawdown is what I call the ASYMMETRY® Ratio. The ASYMMETRY® Ratio is the total return divided by the risk it took to achieve it. I prefer more total return, less downside drawdown.

global tactical asset allocation drawdown risk management

The point is, global stocks and bonds have recovered much of the losses. As we would expect so has global asset allocation. The only issue now is the short term risk has become elevated by my measures, so we’ll see how the next few weeks unfold.

Mike Shell is the Founder and Chief Investment Officer of Shell Capital Management, LLC, and the portfolio manager of ASYMMETRY® Global Tactical.

Mike Shell and Shell Capital Management, LLC is a registered investment advisor and provides investment advice and portfolio management exclusively to clients with a signed and executed investment management agreement. The observations shared on this website are for general information only and are not specific advice, research, or buy or sell recommendations for any individual. Investing involves risk including the potential loss of principal an investor must be willing to bear. Past performance is no guarantee of future results. All information provided is deemed reliable, but is not guaranteed and should be independently verified. The presence of this website on the Internet shall in no direct or indirect way raise an implication that Shell Capital Management, LLC is offering to sell or soliciting to sell advisory services to residents of any state in which the firm is not registered as an investment advisor. Use of this website is subject to its terms and conditions.
FAANG Stocks and Momentum Trends

Markets trend in cycles and trends come and go like seasons from spring to summer to fall to winter. I like to observe a range of price trends and behavioral trends from short term to very long term secular trends.

In the 1960s and 1970s, it was the Nifty 50. The Nifty 50 were 50 stocks institutional investors admired.

The Nifty 50 stocks got their reputation during the bull market of the 1960s and early 1970s. They were considered “one-decision” stocks because investors were told they could buy and hold the shares forever. Nifty 50 stocks included IBM, General Electric (GE), and Coca-Cola (KO). Some of the Nifty 50 have had problems the past decade, like Xerox and Polaroid. More recently, we can add General Electric to not so nifty list.

The secular bear market of the 1970s started with the 1973–74 stock market crash and lasted until 1982.  Valuations of the Nifty 50 fell to low levels along with the rest of the stock market. Most of the Nifty 50 lagged the stock market indexes and then they weren’t so popular afterward. Trends can be fads and come and go, but the one thing we see driving fads in the stock market is their actual price trend. Stocks are loved at all-time highs, not so much after they decline.

Below are three of the better Nifty Fifty stocks. Buying and holding the stocks would require tremendous patience and acceptance of volatility and large drawdowns.  Coca-Cola had the best momentum overall. But, who could have held through the drawdown from the late 1990s that lasted a decade? How about Xerox?

nifty 50 ko ibm ge

Below are the % off high drawedowns of these “Blue Chips.” A -50% more decline that lasts for years is something an investor would have to tolerate more than once to own the stocks long term. This is why buy and hold investing doesn’t work for most investors. 

fifty 50 stock asymmetry ratio

Then in the 1990s, it was the tech stocks especially those involved in the Internet. More specifically, the “.com” stocks was a whole new level of popularity and euphoria. The overall stock market reached its highest valuation levels, ever. Most of the .com stocks no longer exist. Some of the technology stocks involved in building the infrastructure still do, like Cisco (CSCO), Microsoft (MSFT), Oracle (ORCL), and Qualcomm (QCOM). But, many of the momentum stocks of the 1990s aren’t around to see their charts.

tech stocks

If investors only focused on is the right side of the chart, those several thousand percent gains look exciting. But, in the real world, even a -20% decline in the stock indexes as we saw in 2018 causes investor fear and panic selling. The investors holding the above stocks would probably need to be asleep at the wheel to have held them long term.

Looking at the total return alone isn’t sufficient, so I like to observe what I call the ASYMMETRY® Ratio, which is the total return chart above along with the drawdown. The ASYMMETRY® Ratio gives us a full picture of the asymmetric risk-reward if there is one. Clearly, the downside drawdowns were brutal by any measure. Maybe even more brutal than the Nifty 50.

1990s momentum tech stocks

Those are the momentum trends of the past.

Today we have the FAANG stocks. It stated as FANG and has since extended to FAANG. The FAANG stocks are Facebook (FB), Apple (AAPL), Amazon (AMZN), Netflix (NFLX), and Google (GOOG). They have been some of the most popular momentum stocks and for good reason. These are some of todays greatest companies. Who can imagine Netflix going away today? Who could have imaged online Netflix taking out Blockbuster? Who can imagine Amazon eventually taking out Netflix? What if Walmart (WMT) or Target (TGT) figure out a way to compete with both? The reality is, there is probably some small company out there we don’t know about that will be the next big winner. We don’t have to attempt to find the needle in the haystack, we can just focus on the price trends and they’ll show up eventually.

I shared my observations in FANG Stocks were the Leaders but now the Laggards so I won’t rehash it. My mission here is a short term update.

So far in 2019, all of the FAANG stocks are trending up except for Apple (AAPL). Only one of the FAANG stocks have had stronger momentum than the First Trust Dow Jones Internet ETF (FDN) which is a more diversified version of FAANG type internet industry stocks. The clear leader has been Netflix (NFLX).  Here is a chart over the past month:

faang stocks fb aapl amzn nflx goog momentum asymmetric risk reward

The ASYMMETRY® Ratio looking at the total return vs. % off high drawdown gives us a better picture of asymmetric risk-reward. Below is their total returns over the past year.

fang faang stock momentum fb aapl amzn nflx goog

The FAANG stocks clearly have their downside risks and all of them are in drawdowns as we see below. However, they are recovering and the diversification of the ETF helped reduce its drawdown relative to the individual stocks.


faang stock asymetric risk reward momentum drawdown

We’ll see if the FAANG stocks resume their prior momentum we’ve seen over the past several years.

Mike Shell is the Founder and Chief Investment Officer of Shell Capital Management, LLC, and the portfolio manager of ASYMMETRY® Global Tactical.

The observations shared on this website are for general information only and are not specific advice, research, or buy or sell recommendations for any individual. Investing involves risk including the potential loss of principal an investor must be willing to bear. Past performance is no guarantee of future results. The presence of this website on the Internet shall in no direct or indirect way raise an implication that Shell Capital Management, LLC is offering to sell or soliciting to sell advisory services to residents of any state in which the firm is not registered as an investment advisor. Use of this website is subject to its terms and conditions.