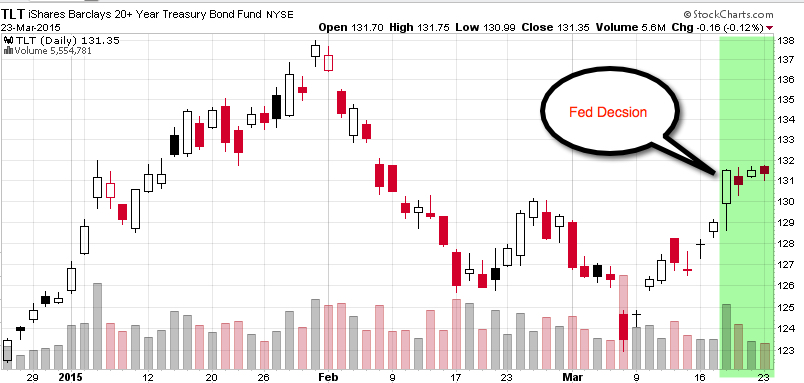
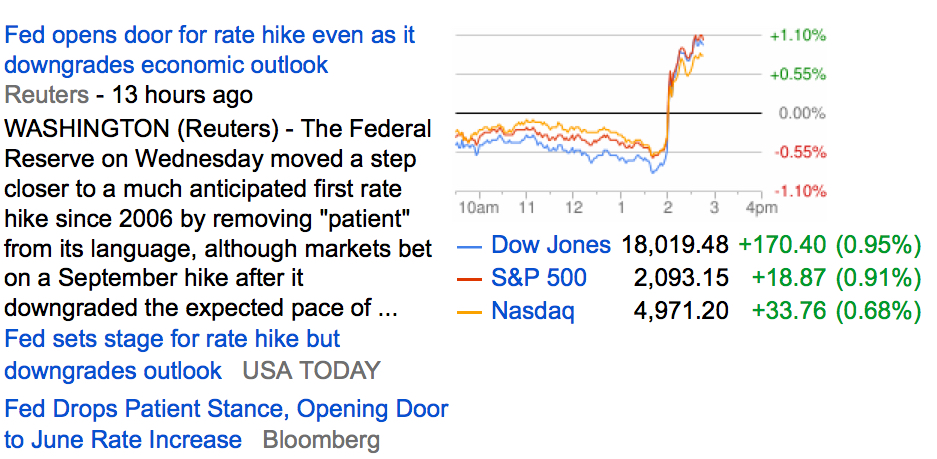
The Federal Reserve raised interest rates and raised expectations for a fourth rate hike in December. The Fed unanimously agreed to raise the federal funds rate a quarter percentage point, to a range of 2% to 2.25%.
But, what does that mean?
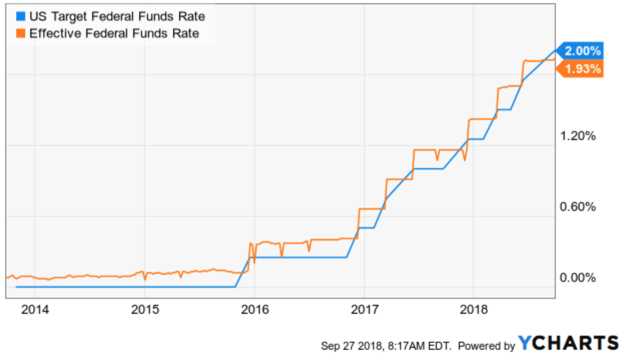
The Federal Funds Rate is the interest rate at which depository institutions like banks and credit unions lend their reserve balances to other banks and credit unions overnight, on an uncollateralized basis. The U.S. Target Federal Funds Rate is at 2.00%, compared to the previous market day and 1.00% last year. This is lower than the long-term average of 2.61%.
The interest rate the borrowing bank pays to the lending bank to borrow the funds is negotiated between the two banks. The weighted average of this rate across all such transactions is the Effective Federal Funds Rate. The Effective Federal Funds Rate is at 1.91%, compared to 1.91% last month and 1.16% last year. This is lower than the long-term average of 4.83%.
Below we chart the trend of the Federal Funds Rate and the Effective Federal Funds Rate over the past 5 years. The trend in interest rates is clear.
Why do we care about rising interest rates?
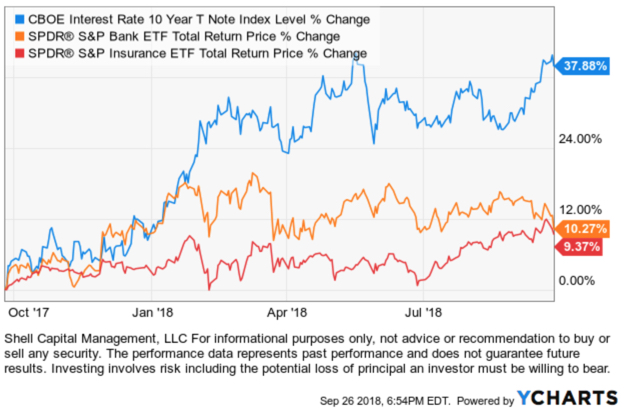
The Federal Funds Rate drives interest rates for mortgages, consumer loans, and credit cards. For example, loans based on the prime rate will be adjusted to reflect the trend in the Federal Funds Rate.
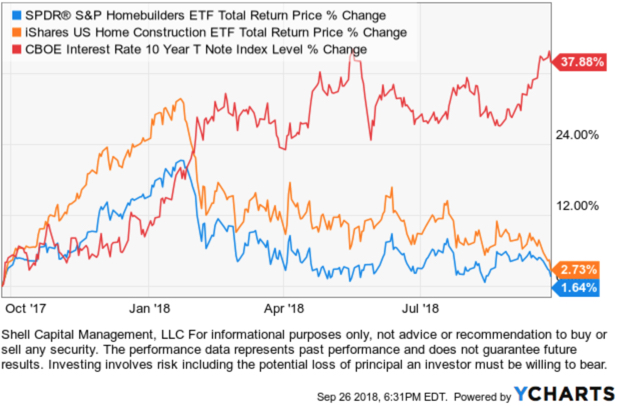
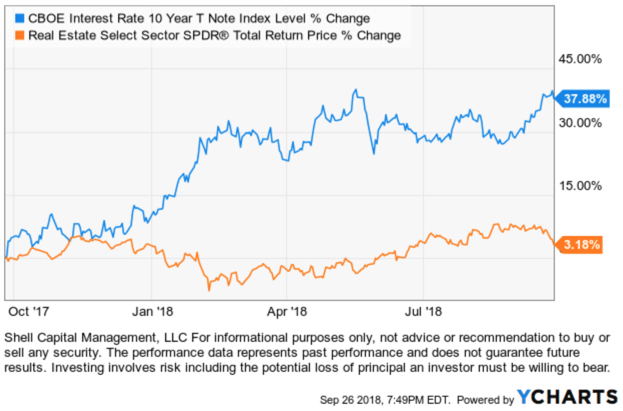
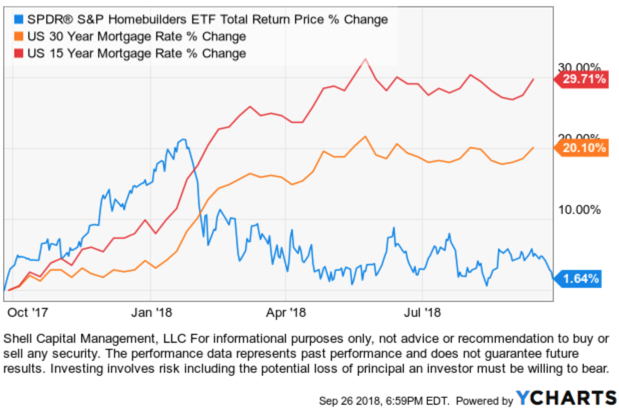
The rising trend in interest rates impacts many things beyond consumer credit cards. Ultimately, when the cost of borrowing increases it can impact real estate, homebuilders, and home construction as I pointed out in Rising Interest Rate Impact on Real Estate and Home Construction.
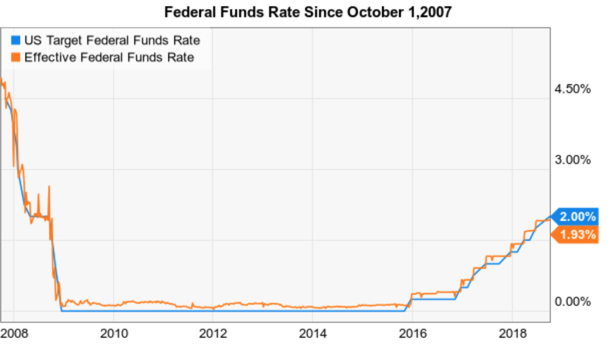
We haven’t seen the Federal Funds Rate this high in over 10 years.
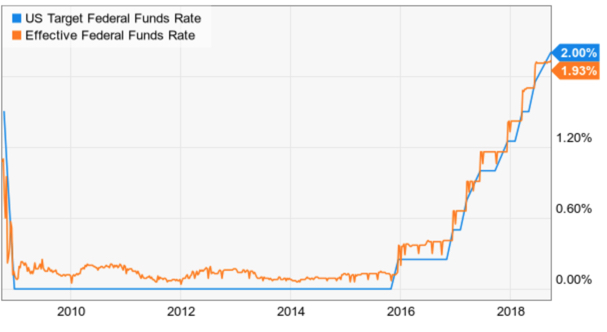
The Federal Funds Rate was much higher at around 4.5% at the peak of the stock market in October 2007. The Fed quickly and sharply lowered interest rates in response to the economic recession in 2008. The U.S. Fed kept a zero interest rate policy like Japan from December 2008 through December 2015.
Many investors wonder how the change in the directional trend of interest rates impacts the stock market. It is no surprise that mutual fund companies who want investors to keep their money invested in their funds that stay fully invested all the time will present data showing rising interest rates don’t impact stocks.
The Fed has been steadily raising rates to keep the U.S. from growing so fast that inflation gets out of hand. Increasing the cost of borrowing will likely slow down spending at some point for both consumers and capital spending of businesses.
The Federal Funds Rate seems to trend follow the stock market. Looking at a chart from the stock market peak in January 2000, we see the Fed Funds Rate was 6%. The Fed lowered the rate to around 2% during the -50% stock market decline and economic recession. I marked the recession in gray.
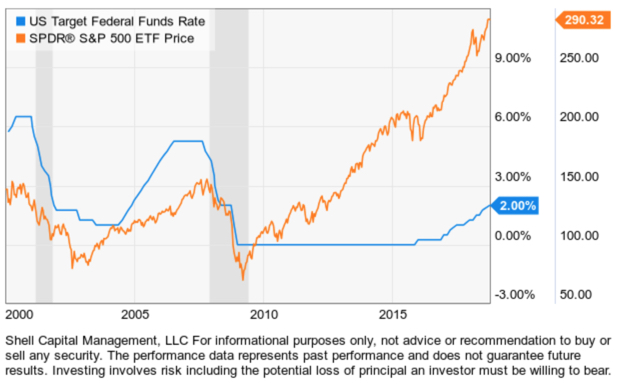
The Fed naturally increases and decreases the Fed Funds Rate in response to changing conditions.
After an economic expansion and the stock market appears highly valued, the Fed begins to raise interest rates to prevent inflation.
After the stock market declines and an economic recession, the Fed begins to lower interest rates to help stimulate recovery. In the chart above, we can see the zero interest rate policy after the crash of 2008 -2009 is abnormal.
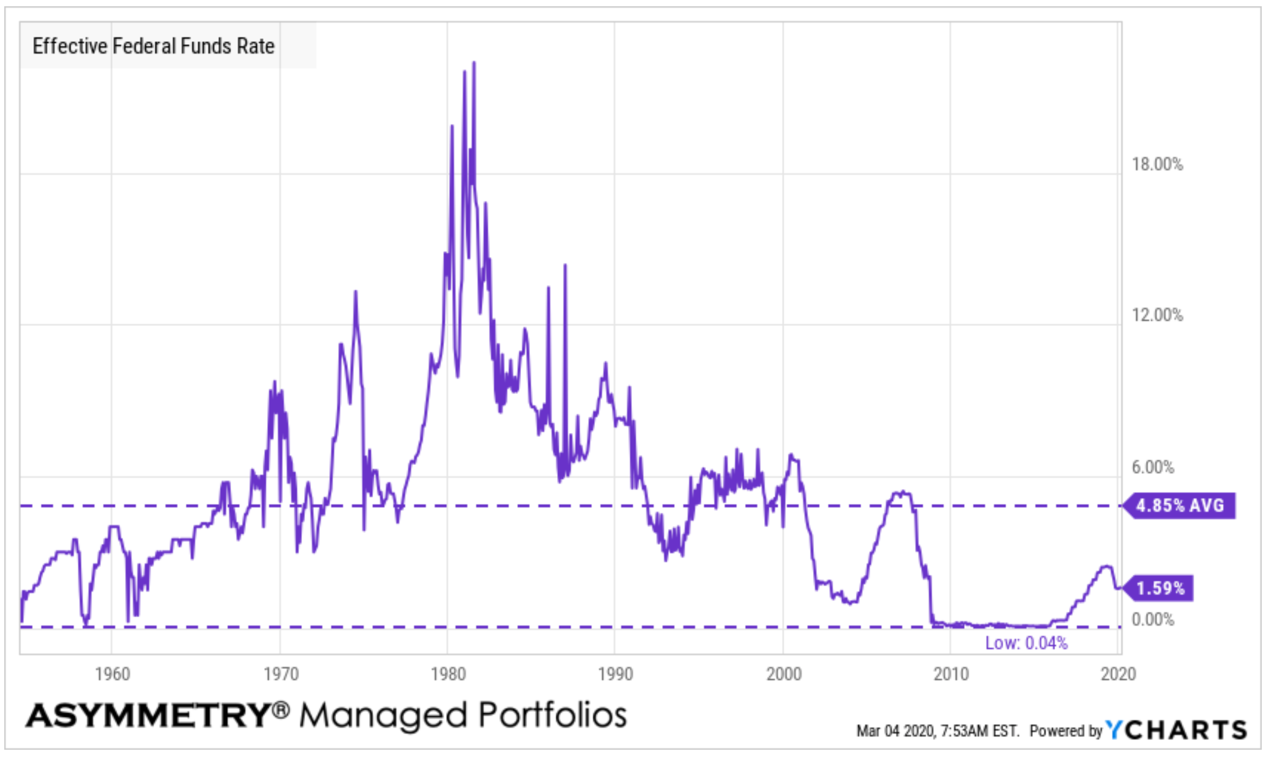
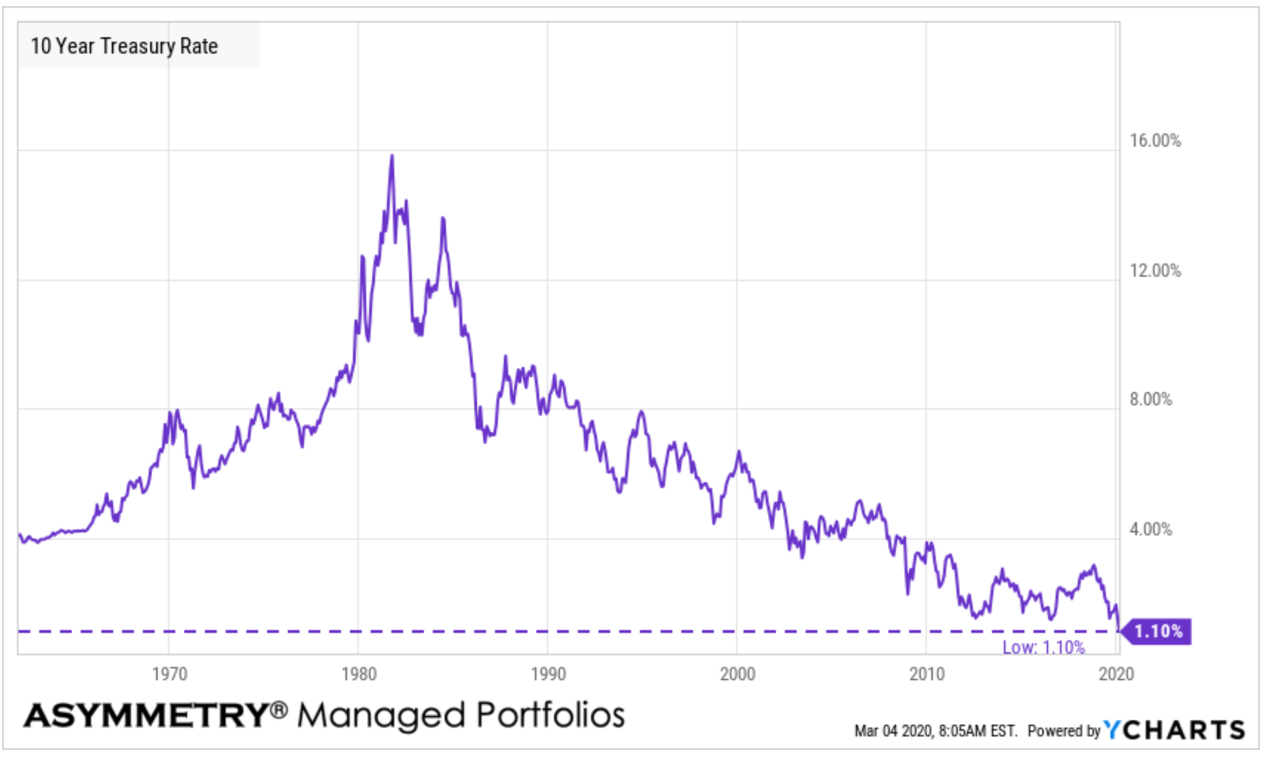
Below is the trend Federal Funds Rate going back to the 1950’s. The interest rate has been much higher in the past, but not kept so low.

Now that interest rates are trending up again it’s going to be interesting to observe how it impacts the economy and the stock market.
Many investment advisors and fund companies will probably try to use the data to show a silver lining. If your money is invested buy and hold into funds that are fully exposed to market risks all the time, those funds incentive is to keep you invested in them regardless of the level of risk.
I don’t believe market returns give us what we want over a full market cycle. After the stock indexes have gained for 10 years without a -20% or more bear market, many investors have probably become complacent with their exposures to market risks. That is especially true with one the longest bull market in history and the second highest valuation.
Along with long uptrends, we can experience devastating downtrends that result in large losses. That’s what we’ve experienced the past 25 years. The giant uptrend 1995 – 1999 was reversed from 2000 -2003. The uptrend 2003 to 2007 was reversed 2008 – 2009 and didn’t recover its 2007 high until 2013.
Rather than full exposure to market risk and reward all the time, I believe we must manage risk to increase and decrease exposure to the possibility of gain and loss.
It doesn’t matter how much the return is if the downside risk is so high you tap out before it’s achieved.
Mike Shell is the Founder and Chief Investment Officer of Shell Capital Management, LLC, and the portfolio manager of ASYMMETRY® Global Tactical.
You can follow ASYMMETRY® Observations by click on on “Get Updates by Email” on the top right or follow us on Twitter.
The observations shared in this material are for general information only and are not intended to provide specific advice or recommendations for any individual. Investing involves risk including the potential loss of principal an investor must be willing to bear. Past performance is no guarantee of future results.


You must be logged in to post a comment.