ASYMMETRY® Observations are Mike Shell’s observations of investor behavior causing directional price trends, global macro, tactical ETF trading, momentum stock trading, hedging, volatility trading, and risk management that creates asymmetric investment returns. An asymmetric return profile is a risk/reward profile with a positive asymmetry between profit and loss. Mike Shell is the founder of Shell Capital Management, LLC and the portfolio manager of ASYMMETRY® Global Tactical
During the waterfall decline in March 2020, the Cboe S&P 500 5% Put Protection IndexSM (PPUT) successfully hedged off stock market beta, but it hasn’t done the same in 2022.
The green highlight shows the Cboe S&P 500 5% Put Protection IndexSM in black and S&P 500 stock index in red. Clearly, the systematic put protection index helped to hedge off downside risk in the SPX during the waterfall decline of March 2020, but that same hedge hasn’t protected long beta portfolios in 2022.
Cboe S&P 500 5% Put Protection IndexSM (PPUT) tracks the value of a hypothetical portfolio of securities (PPUT portfolio) designed to protect an investor from negative S&P 500 returns. The PPUT portfolio is composed of S&P 500® stocks and of a long position in a one-month 5% out-of-the-money put option on the S&P 500 (SPX put).
Let’s see what happened over these two very different outcomes, and I’ll share my observations of what changed that impacted the outcomes.
Using data from YCharts, we see the full year 2020 in the chart comparing the S&P 500 Total Return Index (SPX) to the Cboe S&P 500 5% Put Protection IndexSM (PPUT) which is long the SPX, but adds one-month 5% out-of-the-money put option on the S&P 500 (SPX puts) options to hedge.
For the systematic put hedge strategy, 2020 was a fine example of risk management resulting in not only drawdown control, but also how avoiding large losses can increase the portfolio return in some conditions.
The S&P 500 declined over -30% around March 2020 as COVID spread, but the 5% SPX put lowered the drawdown to -16.52%.
That’s asymmetry and a key part of creating asymmetric investment returns.
The 5% put hedging strategy limited the downside by 50%, then went on to allow the long-only exposure to the S&P 500 to nearly double the stock index.
Naturally, the incredible performance of this very simple systematic hedging strategy tracked by PPUT got some attention after it performed so well. But, no method is perfect, and all strategies are fallible.
Fast forward to 2022, and the outcome has been completely different. Investors and traders who relied on a 5% monthly put option have fully participated in the downside of the SPX this year.
This phenomenon has driven many to ask, why such a radically different outcome?
I’ll attempt to explain my observations as succinctly as possible because understanding derivatives like options is the most complex task in the capital markets for most people.
For more than two decades, I’ve focused on alternative trading strategies in pursuit of asymmetric payoffs that lead to asymmetric investment returns.
Asymmetry isn’t just about finding low-risk positions that offer a higher expected payoff, like a 2-to-1 reward to risk.
Instead, asymmetry is even more focused on limiting the downside in hopes to avoid the negative asymmetry of loss.
Losses compound against us exponentially the deeper we allow losses to get.
So, my focus has been actively trading momentum growth stocks, tactically trading more systematically a global universe of ETFs, and volatility trading/hedging, all of which are unconstrained in my primary portfolio.
So, I have a unique perspective on this topic.
The short and sweet answer to why this time was so different than 2020 is a function of these issues.
During the waterfall decline of March 2020, prices spread out (to the downside) very quickly. It was one of the sharpest waterfalls in history. When prices spread out, I call it a volatility expansion, and rising vol increases the premium for options. For the same reason, the VIX spiked to > 80 in March 2020, but it’s been constrained under 40 so far in 2022.
This year, the stock indices have declined over -20%, but it’s been a much slower grind down. SPX is down about -20% over six months instead of down over -30% in three weeks. The speed of prices spreading out is volatility, and volatility is a significant driver of option premiums. Think of it this way: home insurance in Florida is expected to be cheaper before a catastrophic hurricane when people are complacent than after the hurricane does its damage. The good news is, that options pricing allows for better timing of relative value if you have a system for it.
Another difference is the luck of roll and expiration dates for this systematic strategy that executes about every 30 days. My friend Russell Rhoads, who is one of the most well-known VIX experts, pointed out to me that the ability to use a series that expires on days that don’t contribute to the VIX calculation would have been helpful this year. That is, the systematic strategy of buying 30-day SPX put options has the potential to fall on days that aren’t efficient. The roll is a risk.
Finally, we believe most institutional money managers were already hedged. This has been a long drawn-out decline, a lower vol downtrend, so it’s given time for money managers to add protection, so demand for puts hasn’t been a spike, but instead more methodical.
The bottom line is the asymmetric volatility phenomenon has impacted the put option hedging strategy.
The asymmetric volatility phenomenon suggests that prices trend down faster and sharper than they trend up, which can be an advantage of put option hedging, or a disadvantage when it’s calmer like this year.
All of the above has also kept the VIX below 40 this year.
Mike Shell is the Founder and Chief Investment Officer of Shell Capital Management, LLC, and the portfolio manager of ASYMMETRY® Managed Portfolios. Mike Shell and Shell Capital Management, LLC is a registered investment advisor focused on asymmetric risk-reward and absolute return strategies and provides investment advice and portfolio management only to clients with a signed and executed investment management agreement. The observations shared on this website are for general information only and should not be construed as investment advice to buy or sell any security. This information does not suggest in any way that any graph, chart, or formula offered can solely guide an investor as to which securities to buy or sell, or when to buy or sell them. Securities reflected are not intended to represent any client holdings or recommendations made by the firm. In the event any past specific recommendations are referred to inadvertently, a list of all recommendations made by the company within at least the prior one-year period may be furnished upon request. It should not be assumed that recommendations made in the future will be profitable or will equal the performance of the securities on the list. Any opinions expressed may change as subsequent conditions change. Please do not make any investment decisions based on such information, as it is not advice and is subject to change without notice. Investing involves risk, including the potential loss of principal an investor must be willing to bear. Past performance is no guarantee of future results. All information and data are deemed reliable but are not guaranteed and should be independently verified. The presence of this website on the Internet shall in no direct or indirect way raise an implication that Shell Capital Management, LLC is offering to sell or soliciting to sell advisory services to residents of any state in which the firm is not registered as an investment advisor. The views and opinions expressed in ASYMMETRY® Observations are those of the authors and do not necessarily reflect the position of Shell Capital Management, LLC. The use of this website is subject to its terms and conditions.
What you see in the chart is The S&P 500 stock index, which is an unmanaged index of 500 or so stocks, weighted by their capitalization (size of company) and it’s long-only, fully invested, and therefore fully exposed to the risk/reward of the stocks. The S&P 500 is often considered a proxy for “the stock market”, like the Dow Jones. The risk of the S&P 500 is unlimited, although all 500 stocks would have to fall to zero to lose all your money. It hasn’t done that before, but it has declined -56% just a decade ago. See the red arrow.
Before that period 2008-09, the S&P 500 declined -50% from 2000 to 2003. If something has declined this much before, it should be assumed it can and will again.
So, it’s risky.
And that’s the true risk. The worst historical drawdown is the real measure of risk. If some advisor is telling you risk is two or three standard deviations, run, don’t walk, out that door.
Since being fully invested in the stock market all the time is so risky, real investors with real money tend to want real risk management.
That is, not just “diversification”, which is often touted as “risk management.” Buying 500 stocks isn’t true diversification. Niether is buying 1,000 or 3,000 stocks.
To be sure, the Vanguard Total Stock Market ETF holds 3,542 stocks. The next chart is the Vanguard Total Stock Market fund vs. the S&P 500 ETF. We don’t own either of them, so this doesn’t represent anything we’re doing at my investment company. It’s just an example, that yeah, the stock market is risky, not matter who you are, or how many you hold. Even with over 3,000 more stocks than the S&P 500, it falls the same.
But, to their credit, Vanguard does a good job saying their funds are risky. When I visited their website to see the number of holdings, it says:
Plain talk about risk
An investment in the fund could lose money over short or even long periods. You should expect the fund’s share price and total return to fluctuate within a wide range, like the fluctuations of the overall stock market. The fund’s performance could be hurt by:
Stock market risk: The chance that stock prices overall will decline. Stock markets tend to move in cycles, with periods of rising stock prices and periods of falling stock prices. The fund’s target index may, at times, become focused in stocks of a particular sector, category, or group of companies.
Index sampling risk: The chance that the securities selected for the fund, in the aggregate, will not provide investment performance matching that of the index. Index sampling risk for the fund should be low.
Risks associated with moderate to aggressive funds
Vanguard funds classified as moderate to aggressive are broadly diversified but are subject to wide fluctuations in share price because they hold virtually all of their assets in common stocks. In general, such funds are appropriate for investors who have a long-term investment horizon (ten years or longer), who are seeking growth in capital as a primary objective, and who are prepared to endure the sharp and sometimes prolonged declines in share prices that occur from time to time in the stock market. This price volatility is the trade-off for the potentially high returns that common stocks can provide. The level of current income produced by funds in this category ranges from moderate to very low.
Ok, so we’ve established that the stock market is risky and even a fund invested in thousands of stocks can decline over -50% and take years to recover.
So, we just answered: Why risk management?
It doesn’t matter how much the return is if downside drawdowns are so high you tap out before the gains are acheived.
It also doesn’t’ matter how big the gains are if you give it all up before selling and realizing a profit.
I digress.
I specialize in active dynamic management strategies. I’ve been developing and operating investment risk management systems for the past two decades. Since my focus is on managing the downside, within our risk tolerance, I’m left to let the horses run. If we can direct and control our drawdowns, within reason, it’s never a sure thing, then we are left to focus on the upside of profits.
To illustrate two different methods of risk management, I’m going to use the most simple examples possible. I’m also going to use indexes managed by others, instead of my own. It’s all about keeping it simple to make a point.
So, here we go. I explained the orange line is the S&P 500, fully invested in stocks, all the time, no risk management beyond the diversification of investing in 500 stocks across 10 sectors like financial, healthcare, and tech.
The blue line in the chart is the S&P Trend Allocator Index. The S&P 500® Trend Allocator index is designed to track the performance of a systematic trend-following strategyallocating between the S&P 500 and cash, based on price trends. If the S&P 500 is observed to be in a positive trend, then the index is allocated to the S&P 500, otherwise, it is allocated to cash. It’s a very simple form of trend following applied to stocks. When the S&P 500 is above its 200 day simple moving average, it invests in stocks. When it trends below the 200 day for more than 5 days, it shifts to cash.
The purple trend line, which has achieved the highest return, is the CBOE S&P 500 5% Put Protection Index. The CBOE S&P 500 5% Put Protection Index is designed to track the performance of a hypothetical strategy that holds a long position indexed to the S&P 500® Indexandbuys a monthly 5% out-of-the-money S&P 500 Index (SPX) put option as a hedge. It’s a defined risk strategy, using put options for dynamic hedging.
Trend Following vs. Hedging with Options
Which worked better?
For a closer look, here is the year to date return streams.
Clearly, hedging with 5% out of the money put options has achieved the better asymmetric risk/reward this time. Applying the simple trend following strategy of selling after the stock index declines below its 200 day moving average exited before the low of the S&P 500, but it remains uninvested, missing out on the upside. The trend following streastgy is down -23% year to date, which is worse than the S&P 500. The hedged index is actually positive for 2020. The hedge paid off, according to this index.
Let’s take a closer look at the downside via a drawdown chart, the % off highs. As expected, the S&P 500 stock index had the worst drawdown, so far. It declined -34%.
The strategy of buying 5% out of the money put options had a drawdown of -20%, which is about half of the S&P 500. The systematic trend following strategy was able to cut the drawdown a little short at -27%. The trend following strategy is currently still in its drawdown.
It’s out of the stock market, so it has also missed out on the recent uptrend. Although, it the stock market enters another waterfall decline, that may turn out better. But, to catch up with the fully invested stock index, that’s what would have to occur. The stock market would have to fall a lot, then the strategy reenter at a better point. However, trend following never enters the lows, and never sells the highs, either. Instead, it enters and exits on a lag and the 200 day moving average is a significant lag. For example, I new this trend following strategy would have at least a -11% drawdown, because when the stock market was at its high in February, the 200 day moving average sell signal was -11% lower.
However, this simple system also requires the index to remain below the 200 day average for 5 days, which is intended to reduce whipsaws. That’s why it didn’t initially sell on the first leg down. Instead, it sold after the second leg down. Since the S&P 500 is still below its 200 day moving average, this trend following system hasn’t invested in the stock market yet. In fact, it would have to stay above the 200 day for 5 days. It’s a symmetric trading system. It applies the same signal for the entry and the exit. I know that price trends drift up and crash down, so my version of this is an asymmetric trading system. I apply a different exit than the entry to account for the unique behavior of price trends since they drift up, but crash down.
How has systematic trend following worked on stocks over a longer period?
It’s had some challenges. Volatile periods, when a market swings up and down over shorter time frames, are hostile conditions for trend following methods. This index has only gained 7% the past 5 years after this recent drawdown. While it does cut the losses short, which is what trend following is known for, it has struggled due to market conditions.
I marked up the next chart, where I include its trend relative to the S&P 500 index. I labeled when it sold, which was three times. The first two times, selling with the trend following sell signal of a 200 day SMA avoided a little of the downside. This time it hasn’t helped so much. Overall, the trend following applied to stocks had lower relative strength than the fully invested stock index with no risk management. But, it avoided some downside. Over this short time frame, the downside loss mitigation probably isn’t deemed enough to account for the difference in the outcomes.
With risk management systems, we never expect them to achieve the same or better return than a fully invested stock index that is always exposed to the risk/reward of stocks. The stock index also doesn’t include expenses and it may not be invested in directly. Investors demand risk management because they don’t want the -50% declines they would endure being invested in the stock market with no exit and no hedge.
Speaking of hedge.
Neither of these risk management indexes I’m using for this example have been around long. The CBOE CBOE S&P 500 5% Put Protection Index started in 2015.
The CBOE S&P 500 5% Put Protection Index is designed to track the performance of a hypothetical risk-management strategy that consists of a long position indexed to the S&P 500 Index (SPX Index) and a rolling long position in monthly 5% Out-of-the-Money (OTM) SPX Put options. This is a relatively simple example, though executing it well isn’t so simple. The protective put strategy has achieved better asymmetry, this time. I say this time, because it doesn’t always work as well as it did this time. But, here it is.
As you can see, it lagged the stock index in the uptrend, until now. Lagging in the uptrend is expected. Buying a put option gives us the right to sell our stock below a certain price. It’s similar to buying home or car insurance. When we buy a protective put option, we literally pay a “premium” for a time period to expiration, like insurance. Some call it portfolio insurance. If we pay an insurance premium for years, it reduces our personal profit and loss statement. The protection is an expense. We’re willing to pay it to avoid large drawdowns. A skilled options trader can potentially execute it better, if an edge can be gained with timing the relative value of the options.
Asymmetric hedging beat the simple following strategy this time. I call it asymmetric hedging, because when we buy a put option, we have limited downside risk (the premium paid) but we have a maximum gain of the Strike price – premium paid. To learn more about a Long Put option, here is a video from the OIC.
The protective put strategy has achieved better risk/reward. I say this time, because it doesn’t always work as well as it did this time. Also, I said the Long Put protection strategy is an “asymmetric hedge” because it has a larger potential profit than the cost for the exposure. There are much better examples of what I call an asymmetric hedge, for example, going long volatility can have a substantial asymmetric payoff. Just look at the VIX. It spiked up more than ever in history, so even a small option position to be long volatility would have a tremendous payoff. Imagine if we spent just 1% of a portfolio but the payoff was 10% at the portfolio level. Yeah, that’s asymmetry.
Back to the comparison of trend following to hedging with options, here is the return streams over the past five years. I consider both of these risk management methods to be basic asymmetric risk/reward payoffs. The trend following system didn’t do so well this time, at least so far, but it still has limited downside risk and unlimited upside gain potential. If the stock market keeps going up and never trends down below its 200 day average, it would keep gaining.
But, if we believed that was what it will do, we wouldn’t care about risk management. Some people actually do put their money in stocks and stock funds and don’t consider limiting their downside. To each their own. Before this bear market is over, they may be crying about their large losses, as they did last time. But I’m guessing this time, if they do it again, they may learn the lesson. The stock market is risky, all investing involves risks as do all strategies. No strategy is perfect. We have to be willing to accept the imperfections and settle with a C sometimes, if we want to A over the long run. This isn’t college. Money compounds.
This leads me to one more thought to share. I was watching this video from Ray Dalio, the founder of the largest hedge fund in the world. Dalio was speaking of this chart in his presentation. He calls it “The Holy Grail.”
In an ideal world, we could invest in 15-20 different assets that are uncorrelated and because one trends up with others are trending down, similar to the hedging strategy, we would achieve an edge from pure diversification. He says The Holy Grail is combining these unique returns streams, which has gains and losses at different times, but overall, the portfolio trends up to the upper right corner.
That’s in an idealized world.
You may know better. Shit happens in the real world. A joke going around is:
Started the year off January 1st: THIS IS MY YEAR!
By April, wiping my …. with coffee filters.
Now that’s funny right there! I don’t care who you are!
Yeah, I said it. It’s a sign of the times. We need to lighten up and laugh as much as we can, especially about the simple things in life, like running out of tp.
In bear markets, correlations go to one. That is, most everything falls. Why? Even if you have gains in some uncorrelated markets, if you have big losses in others, as a fund manger, you take the profits to help deal with the losses. It eventually pushes down the leaders, too. That’s just one of many examples. Here’s an old chart I’ve used for years to illustrate how diversification along can fail.
There is no free lunch, but Dalio is right, if we could combined 15 or so unique return streams, it could be an edge. The trouble is, what markets can you simply invest in that are truly disconnected from the others?
No many. Maybe long term US Treasuries along with stocks, but going forward, it’s not going to look like the past. US Treasuries will be tradable, but with the interest rate down to 1%, the upside in price is very limited, so is the interest income.
Uncorrelated Return Streams
I did both of this type of strategy, and more, in Asymmetry Global Tactical Fund, LP which was a private managed by another company I founded in 2012, Asymmetry Fund Management, LLC. What I believe is more of “The Holy Grail” isn’t making simple investment allocations into different funds or markets hoping for diversification from non-correlation, but instead, combining asymmetric trading systems that have unique return drivers and asymmetric risk/reward profiles. My different trading systems have different return drivers. Instead of market factors and conditions driving the return stream, the buy, sell, and risk management system extracts from the market a unique return stream. It’s a return stream we can’t get from just investing in some funds with different managers. They are mostly correlated, multiple asymmetric trading systems may be very uncorrelated from each other. For example, one system may trend follow longer term trends. Another may trend follow short term trends. Then, they are applied to difference markets, say stocks, bonds, currency, and commodities. Another complete different system may be volatility trading, aiming to gain from a volatility expansion. Add in some countertrend systems, that buys short term oversold and sell short term overbought, and it’s going to produce a unique return stream from everything else. What if the countertrend system is applied to different markets, then, each extracting a unique return stream.
That’s real diversification.
It can’t be achieved by just investing in different markets, or investing in a bunch of funds. But, someone like Dalio, or me, who has multiple trading systems and strategies, we may benefit from the edge of combining them, o even shifting between them.
But I have an edge, and a very big one, over Dalio. He’s got to move around billions. He can’t trade nimble as I can. My flexibility and nimbleness is an edge. I’m not ever going to manage 50 billion or 100 billion and would never want to. I already have what I want. I have enough. It allows me to focus, and be dynamic. I’m happier with little to no distraction.
Now, this is an overly simplified idealized example I’ve used here with the trend following and put buying hedging strategy, but just thing about how this would look if we combine them along with 15-20 others. The larger the money we manage, the more we need to just allocate capital into something rather than trading.
You can probably how these three trends are correlated in uptrends, then disconnect in downtrends. Some combination of them can smooth the ride. In this overly simple example, it would mean some exposer to long-only fully invested in stocks, all the time, no matter how far they fall. Another is always hedged, so it will lag on the upside, but limit the risk on the downside. Then, the trend following system absolutely exits in downtrends and waits for an uptrend. When the market is crashing, nothing looks better in our account that FDIC insured cash deposits.
But, I rotate, instead of allocate.
I would rather shift between markets to be exposed when I believe the risk/reward is asymmetric and avoid it when it isn’t.
Then, imagine if each of these have its own risk management to predefine risk in advance and a portfolio level drawdown control to limit overall drawdowns to less than the -30% of more than is common with the stock market.
So, there you go, a trend following system relative to a options hedging system, and a hint at how we see it. I’m an unconstrained tactical money manager. I don’t constrain myself to a box. I never liked being put in a box and I don’t fit well in any box. I’ll go were the money is treated best. Flexible, adaptable, nimble, unconstrained, and unbiased.
That’s just how I roll.
Join 522 other subscribers
Mike Shell is the Founder and Chief Investment Officer of Shell Capital Management, LLC, and the portfolio manager of ASYMMETRY® Global Tactical. Mike Shell and Shell Capital Management, LLC is a registered investment advisor focused on asymmetric risk-reward and absolute return strategies and provides investment advice and portfolio management only to clients with a signed and executed investment management agreement. The observations shared on this website are for general information only and should not be construed as advice to buy or sell any security. Securities reflected are not intended to represent any client holdings or any recommendations made by the firm. Any opinions expressed may change as subsequent conditions change. Do not make any investment decisions based on such information as it is subject to change. Investing involves risk, including the potential loss of principal an investor must be willing to bear. Past performance is no guarantee of future results. All information and data are deemed reliable but is not guaranteed and should be independently verified. The presence of this website on the Internet shall in no direct or indirect way raise an implication that Shell Capital Management, LLC is offering to sell or soliciting to sell advisory services to residents of any state in which the firm is not registered as an investment advisor. The views and opinions expressed in ASYMMETRY® Observations are those of the authors and do not necessarily reflect a position of Shell Capital Management, LLC. The use of this website is subject to its terms and conditions.
I’ve shared some observations about investor sentiment this past week as sentient indicators and surveys have reached an extreme level of optimism.
When sentiment reaches an extreme, we should prepare for it to swing the other way, at least temporarily.
Why?
Because that’s what it does. Most financial and economic data cycles up and down, swinging like a pendulum as investors oscillate between fear and greed. Or, as I like to put it: oscillating between the fear of missing out and the fear of losing money.
What about consumer sentiment?
The US Index of Consumer Sentiment is another sentiment survey, but it measures consumers instead of specifically investor sentiment about the stock market trend. The US Index of Consumer Sentiment (ICS), as provided by University of Michigan, tracks consumer sentiment in the US, based on surveys on random samples of US households. The index aids in measuring consumer sentiments in personal finances, business conditions, among other topics. Historically, the index displays pessimism in consumers’ confidence during recessionary periods, and increased consumer confidence in expansionary periods.
US Index of Consumer Sentiment is at a current level of 95.70, an increase of 0.20 or 0.21% from last month. This is a decrease of 1.80 or 1.85% from last year and is higher than the long term average of 86.64.
US consumer sentiment is near the top of its historical range going back decades. There are only two times since its inception the level was high than it is now, such as the euphoric bubble of the late 1990s.
Consumer sentiment has been trending up the past decade until 2015 and has been drifting sideways at the historical peak range the past four years.
The art of contrary thinking suggests when everyone thinks alike, everyone is likely to be wrong. However, in recent years the crowd has been right. For example, US GDP (Gross Domestic Product) is the total value of goods produced and services provided in the US. It is an indicator to analyze the health of the US economy. GDP is calculated as the sum of Private Consumption, Gross Investment, Government Spending, and Net Exports. Two-quarters of consecutive negative real GDP growth is considered a recession. GDP is also used by the Fed (FOMC) as a gauge to make their interest rate decisions. In the post World War II boom years, US GDP grew as high as 26.80% in a year, but by the late 20th century 2-7% nominal growth was more the norm.
US GDP is at a current level of 21.53 trillion as of September, up from 21.34 trillion in the last quarter. This represents a quarterly annualized growth rate of 3.48%, compared to a long term average annualized growth rate of 6.26%. Although it shows the US economy has grown less than the long term average, the United States is now a developed country and long past the emerging country stage pre-WWII boom years. So, in the chart below we observe a correlation between consumer sentiment and GDP. Up until recently, they are trending in the same direction, but keep in mind GDP doesn’t necessarily have an upside limitation, while the consumer sentiment is a survey that can be more range-bound. Sentiment surveys tend to oscillate up and down in response to changing economic conditions.
Another note about GDP before I get a thousand emails from my economics friends and other global macro funds managers, US Real GDP Growth is measured as the year over year change in the Gross Domestic Product in the US adjusted for inflation. To make my point and keep it simple, I used the base GDP.
So, how does overall consumer sentiment correlate with the stock market trend and how do they interact with each other?
Below we chart the US Index of Consumer Sentiment overlayed with the S&P 500 price trend for general visual observation. By looking at the lines, we can observe they are correlated. Up to 2000, the stock market and consumer sentiment trended up. The stock market and consumer sentiment trended down from 2000 to 2003 or so.
But, from around 2003 to 2008 it would appear consumer sentiment was non-trending as it drifted sideways as the stock market trended up, however, the sentiment was just staying at its peak level. When I highlight the peak range below, it’s more obvious that sentiment remains at a high level for years and occasionally swings down. Americans are mostly optimistic about America! and we should be.
Continuing to review the trends, the period from 2007 on is correlated again to the downside as stocks and consumer sentiment dropped sharply. Recall this stock index declined -56% from October 2007 to March 2009 and then took four years to reach its 2007 high again in 2013. We can see the bottom chart above is the correlation coefficient of these two data. Although the correlation oscillates up and down, it has remained in the upper range signaling it is more correlated that not.
The larger declines in consumer sentiment are related to recessions. We’ve only had two recessions since 1991. The 1990s was the longest period of economic growth in American history. The collapse of the speculative dot-com bubble, a fall in business outlays and investments, and the September 11th attacks, brought the decade of growth to an end. Notwithstanding these major shocks, the recession was relatively brief and shallow compared to the one we would see seven years later. I marked the recessions in gray to show how they fit into the big picture.
“As a general rule, it is foolish to do just what other people are doing, because there are almost sure to be too many people doing the same thing.”
—William Stanley Jevons (1 September 1835 – 13 August 1882) was an English economist and logician. Irving Fisher described Jevons’s book A General Mathematical Theory of Political Economy (1862) as the start of the mathematical method in economics.
This is really about human behavior. Emotions and sentiment rise and fall with events.
To be a successful investor over the long term, we must necessarily believe, feel, and do differently than the masses at the extremes. So, I monitor the extremes to see when they change. At the extremes, I hope to be doing the opposite of what our investment management clients and everyone else believe I should be doing.
Mike Shell and Shell Capital Management, LLC is a registered investment advisor focused on asymmetric risk-reward and absolute return strategies and provides investment advice and portfolio management only to clients with a signed and executed investment management agreement. The observations shared on this website are for general information only and should not be construed as advice to buy or sell any security. Securities reflected are not intended to represent any client holdings or any recommendations made by the firm. Any opinions expressed may change as subsequent conditions change. Do not make any investment decisions based on such information as it is subject to change. Investing involves risk, including the potential loss of principal an investor must be willing to bear. Past performance is no guarantee of future results. All information and data are deemed reliable but is not guaranteed and should be independently verified. The presence of this website on the Internet shall in no direct or indirect way raise an implication that Shell Capital Management, LLC is offering to sell or soliciting to sell advisory services to residents of any state in which the firm is not registered as an investment advisor. The use of this website is subject to its terms and conditions.
Implied volatility as measured by VIX indicates wider prices in the near term. The CBOE Volatility Index VIX has increased to 20, which is it’s long term average, suggesting prices will spread out to 20%.
Along with a volatility expansion, as typical, we are seeing stock prices trend down.
My leveraged exposure to the long term U.S. Treasuries has offered an asymmetric hedge in recently. The long term U.S. Treasuries don’t always play out this way, but this time we’ve benefited from their uptrend and some negative correlation with stocks.
Gold is another alternative used as a hedge exhibiting relative strength and time-series momentum.
If this is just a short term correction, we should see some buying interest near this point or a little lower. If last month’s lows are taken out, this may be the early stage of a larger decline.
We were well-positioned in advance this time, so we’ll see how it all plays out.
Mike Shell and Shell Capital Management, LLC is a registered investment advisor focused on asymmetric risk-reward and absolute return strategies and provides investment advice and portfolio management only to clients with a signed and executed investment management agreement. The observations shared on this website are for general information only and should not be construed as advice to buy or sell any security. Securities reflected are not intended to represent any client holdings or any recommendations made by the firm. Any opinions expressed may change as subsequent conditions change. Do not make any investment decisions based on such information as it is subject to change. Investing involves risk, including the potential loss of principal an investor must be willing to bear. Past performance is no guarantee of future results. All information and data is deemed reliable, but is not guaranteed and should be independently verified. The presence of this website on the Internet shall in no direct or indirect way raise an implication that Shell Capital Management, LLC is offering to sell or soliciting to sell advisory services to residents of any state in which the firm is not registered as an investment advisor. Use of this website is subject to its terms and conditions.
As Fed officials begin their discussions on Tuesday they will have some more data with which to assess the economy. Personal income, pending home sales and consumer confidence statistics are all due that morning. Then on Thursday, the ISM manufacturing report is expected to show industry is stabilizing and continuing to expand. Friday’s trade data will be pored over for evidence that the skirmish with China is having an effect. Also next week, the Treasury will say on Wednesday how much money it needs to borrow amid rising budget deficits.
For me, the driver of a volatility expansion $VIX will just seem like a normal countertrend from a historically very low point. As vol has contracted into the 12’s it is at the low level of its cyclical range. This is when I start looking for a reversal.
VIX futures are at a 9.86% contango, so the roll yield is a little steep. That is, the September VIX future is about 10% higher in price than the August VIX price. The difference in the price creates a roll yield those traders who are short VIX options or futures hope to earn.
Those of us more focused on the directional trend, especially countertrends, will be more alert to see volatility expand from here. The trouble is, the contango creates a headwind for the ETFs and ETNs we may want to enter long at some point. That’s because they may invest in both the front month and second month, so as they roll forward through time they are selling the lower-priced august to buy more of the higher-priced September. This negative roll yield is why the VIX based ETFs trend down over the long term. To trade them successfully, timing is important, but it’s also not so simple.
The next chart is the S&P 500 stock index with Bollinger Bands around the price trend set at two standard deviations from its 20 day moving average. While the VIX is an implied volatility index based on how the options market has priced options of the S&P 500 index stocks, these bands are measures of realized volatility. Actual volatility has also contracted recently.
Periods of low and contracting volatility are often followed by periods of higher and expanding volatility.
Mike Shell and Shell Capital Management, LLC is a registered investment advisor and provides investment advice and portfolio management exclusively to clients with a signed and executed investment management agreement. The observations shared on this website are for general information only and should not be construed as advice to buy or sell any security. Securities reflected are not intended to represent any client holdings or any recommendations made by the firm. Investing involves risk including the potential loss of principal an investor must be willing to bear. Past performance is no guarantee of future results. All information and data is deemed reliable, but is not guaranteed and should be independently verified. The presence of this website on the Internet shall in no direct or indirect way raise an implication that Shell Capital Management, LLC is offering to sell or soliciting to sell advisory services to residents of any state in which the firm is not registered as an investment advisor. Use of this website is subject to its terms and conditions.
I’m dialing in to look at shorter-term technical analysis as my risk management systems are suggesting a risk of a stock market decline is becoming elevated.
Zooming in to shorter time frames, the U.S. stock market advance appears to be becoming exhausted.
The chart below is the SPDR® S&P® 500 ETF, yesterday on a 5-minute chart. Now that’s zooming in! I’m not a day trader, but I’m monitoring the trend for signs of buying exhaustion and/or selling pressure to potentially take over. Yesterday this index ETF was up nearly .75% in the morning, then you can see it drifted down to close well below its VWAP for the day.
The next chart shows the SPY trend going back for about six months. The recent stock advance has been impressive and I’m sure glad we participated in it, but I’m now applying some situational awareness. The strong momentum since the late December 2018 low could be becoming exhausted and may find some resistance for higher prices, at least temporarily.
As a tactician, since we had heavy exposure to stocks, I’ve been gradually reducing exposure and today started hedged off some equity risk to offset some of my market risks. I did that as opposed to taking large profits and realizing taxable gains. Fortunately, we took advantage of last years volaltity and made the best of it by executing significant tax loss harvesting. This time I decided to hedge some of our gains rather than realize them.
I may be wrong, but my risk management systems are elevated for at least a short term exhaustion, so I expect we’ll see some selling pressure overwhelm buying at some point from here. If it doesn’t, then it’s a good sign the momentum may be here to stay a while, but I’ll probably still wait for a reversal down to add more exposure in my tactically managed portfolio. My objective is asymmetric risk/reward, and from this starting point, I see more potential for downside than upside for stocks. My systems aren’t always right, but the magnitude of the gains are larger than the losses when it’s wrong. I call it ASYMMETRY®.
Mike Shell and Shell Capital Management, LLC is a registered investment advisor and provides investment advice and portfolio management solely to clients with a signed and executed investment management agreement. The observations shared on this website are for general information only and are not specific advice, research, or buy or sell recommendations for any individual. Investing involves risk including the potential loss of principal an investor must be willing to bear. Past performance is no guarantee of future results. All information provided is deemed reliable, but is not guaranteed and should be independently verified. The presence of this website on the Internet shall in no direct or indirect way raise an implication that Shell Capital Management, LLC is offering to sell or soliciting to sell advisory services to residents of any state in which the firm is not registered as an investment advisor. Use of this website is subject to its terms and conditions.
I pointed out yesterday the Stock market internals are signaling an inflection point. On a short term basis, some internal indicators are suggesting the stock market is at a point I expect to see a more significant breakout in one direction or another. That may sound like a symmetrical statement, but it’s the result of a symmetrical point that I consider midfield. From here, I look for signals of which direction the momentum shifts.
The asymmetry in the CBOE Index Put/Call Ratio suggests an increase in hedging yesterday. In the chart below, we see the Put/Call Ratio on Index options is at the high end of its range. I believe index options are used more for hedging by large institutions like hedge funds and pensions than for speculation by smaller individuals. I must not be the only one who recently hedged market risk.
Looking back over the full history, we see the current asymmetry of 1.55 puts to calls is a level that shows the asymmetry is on the upper range. When it gets too extreme, it can signal an overly pessimistic position.
The CBOE Equity Put/Call Ratio which I believe is more of a measure of individual investor speculation remains at a normal level at this point. That is, we normally see the Equity Put/Call Ratio below 1 as it indicators more (speculative) call volume than put volume.
However, when the Equity Put/Call Ratio spiked up to an extreme in late December I thought it was a good indicator of panic. That turned out to be the case as it marked the low so far.
From here, I’m looking for signs of which direction the momentum is shifting. The CBOE Index Put/Call Ratio seems to suggest professional investors like me are more concerned about hedging against downside loss. They may be like me, setting on capital gains I prefer to hold (let the winners run!) so adding a hedge can help offset a loss of value. Yet, if we see a continuation up in the recent uptrend we simply take a smaller loss on the hedges that we can tax deduct.
The observations shared on this website are for general information only and are not specific advice, research, or buy or sell recommendations for any individual. Investing involves risk including the potential loss of principal an investor must be willing to bear. Past performance is no guarantee of future results. The presence of this website on the Internet shall in no direct or indirect way raise an implication that Shell Capital Management, LLC is offering to sell or soliciting to sell advisory services to residents of any state in which the firm is not registered as an investment advisor. Use of this website is subject to its terms and conditions.
Most financial advisors and financial planners recommend to their clients some type of global asset allocation. Their global asset allocation models usually include a range of bonds, U.S. stocks, and International stocks. Some may include what are considered alternative investments like real estate (REITs), private equity, or tactical trading, but most of them keep it plain vanilla. This asset allocation method is called “strategic asset allocation” since it usually applies some form of portfolio optimization of historical returns and volatility to determine the weight between stocks and bonds.
Who can blame them? asset allocation and diversification is easy to sell and easy to defend. If someone sells their business or retires with a large 401(k), it’s easy to sell them on diversifying their assets. If the markets go down it isn’t their fault, it’s the market that’s doing it. Is it too much drawdown or volatility? They just recommend a change to less stocks and more bonds. Of course, that only works when bonds aren’t falling too.
Since many actively managed mutual funds failed to avoid losses during the last bear market 2007 to 2009, many advisors shifted their strategic asset allocation from actively managed mutual funds to index funds. It’s easy to see why; their clients lost a lot of money, even as much as -40% for a balanced portfolio of 60% stocks and 40% bonds. If they were more invested in stocks, it was as much as -50% or more.
If a mutual fund was supposed to be “active,” I can see how such losses would be unacceptable. If an investor is paying more for portfolio management, they probably expect to have a more asymmetric risk/return profile than what long-only exposure to stock indexes all the time would provide for less cost. Index funds and ETFs are cheap because they simply provide exposure to market risks and rewards. They provide this exposure all the time, so when markets fall as they do in a bear market, they lose value and have no stop loss for risk management.
I also use index ETFs to gain exposure to markets, countries, and sectors, but I don’t just buy and hold them, I increase and decrease my exposure to actively manage my risk/reward. My objective is an asymmetric risk/reward, so I want to avoid the larger losses as I try to capture gains. For me, it starts at the individual position level and flows through to the portfolio level. I’m entering positions we expect to result in an asymmetric risk/reward payoff; positions with a higher expected gain than its potential loss. I do this over and over, and they don’t all have to result in asymmetry. We just need the average gains to exceed the average losses over time to achieve a positive asymmetric risk-return profile. It’s an absolute return objective, meaning our focus is on our own payoffs and risk-reward profile, not trying to track what a stock index is doing. My strategy is unconstrained from the limitations of a fixed benchmark. Our objective is more about making money with a predetermined amount of absolute risk, not relative returns and tracking indexes. As such, the return stream is expected to be unique.
That isn’t what active mutual fund managers do.
The typical active mutual fund has an objective of relative return vs. an index benchmark. As I’ve been an investment manager for over two decades, I’ve seen the relative return comparisons become more and more intense. Brokerage firms and investment advisors have created sophisticated performance reporting programs to compare their performance to chosen benchmarks. Active mutual funds have a mandate to “beat” and index. For example, some of them aim to beat the large growth, mid value, or small growth asset classes. Most of them attempt to beat their benchmark by filtering through the stocks in the index and picking better stocks. If a relative return is their objective, they are not focused on managing downside risk. Instead, they are focused on tracking the benchmark and getting ahead of it. Many of them probably attempt it by holding a more focused portfolio or with a portfolio of the higher momentum stocks relative to the benchmark. Since risk management isn’t their objective, they view any overweight in cash as a risk of underperformance. That’s what traditional “active managers” do. What I do is typically called “tactical management” since my objective is absolute return, not relative return, and I want to actively control my drawdowns through risk management. For example, I could be positioned in all cash in a bear market, hedged, short, or long volatility.
So, there is an important distinction between “active managers” with a relative return benchmark-beating objective and those of us with an unconstrained strategy and focus on absolute returns. Mutual funds are typically relative return managers trying to beat a benchmark, hedge funds are typically absolute return managers creating their own unique return stream. Although, typically means that isn’t always the case.
Ok, so, the headline was about the performance of Global Asset Allocation this year.
Back to global asset allocation.
Some financial advisors and media enjoy disparaging all types of active management. They talk about how relative return managers like most mutual funds don’t beat their benchmarks. They’ll point out how absolute return hedge fund type strategies may manage downside risk, but don’t earn as much return as an all-stock portfolio. Most of the time, it isn’t a reasonable comparison. For example, saying the Barclays Hedge Fund Index underperformed the S&P 500 the past decade isn’t complete without also considering the drawdowns. In the last bear market, the S&P 500 declined -56% while the Barclays Hedge Fund Index that includes a composite of thousands of hedge funds declined only -24%. I will suggest the stock index loss was so large most tapped out while the Barclays Hedge Fund Index was low enough that investors could have held on.
It doesn’t matter how much the return is if the risk is so high you tap out before its achieved.
This year has been a challenging and hostile year for all investment strategies. While those who adhere to a long-only fully invested asset allocation all the time will talk about the performance of active managers, theirs isn’t much to speak of, either. I know a lot of advisors, and we work with some who invest in my portfolio. Most of their global asset allocations are very simple, and now many of them use index funds and charge an advisory fee for the asset allocation and rebalancing.
There are some mutual funds that offer a varying method of asset allocation. I am not recommending any of these funds, this is for educational and informational purposes only. Some popular ones that come to mind are BlackRock Global Allocation (MDLOX), Arrow DWA Balanced. PIMCO All Asset All Authority (PAUAX), DFA Global Allocation 60/40 (DGSIX). BlackRock Global Allocation, Arrow DWA Balanced, and PIMCO All Asset All Authority are active allocation funds while DFA Global Allocation is a passive allocation fund managed by Dimensional Fund Advisors. Below are their year-to-date total returns, including dividends. (To see their full history click on the links in their names above.)
I know financial advisors who are big advocates of large asset managers like Dimensional Fund Advisors (DFA), PIMCO, and BlackRock. Advisors often tout how large they are and how many academics or how many analysts and portfolios managers they have on staff. I included the Arrow DWA Balanced fund because it’s managed by Dorsey Wright, which isn’t as large, but I know advisors use it. Most advisors who offer asset allocation models are doing their own asset allocations for their clients. The above returns are the result of each of these asset managers doing the allocation and investment selection. So, I would expect when it comes to global asset allocation, those funds should be as good as it gets. How is a financial planner who isn’t a portfolio manager going to do better?
Some may say “What about Vanguard? They are some of the cheapest funds you can buy?”. I don’t know of a Vanguard global asset allocation fund like the DFA fund, but they do have a balanced 60/40 fund that doesn’t include exposure to international. Below is their balanced allocation fund along with their International stock fund. Though their fund isn’t down -7% like the global allocation funds, if you added 20% of their International to make it “global,” we can see it would be similar.
Since indexing and ETFs have become more popular than mutual funds, today we have some interesting ETFs that track global asset allocation indexes so we can better understand the return streams of global asset allocation.
iShares is a BlackRock company, the world’s largest asset manager with $6.29 trillion in assets under management. If an investor thinks a large size with many professionals is the key to investment success, they would probably BlackRock is the best. Of course, I don’t agree, since the most skilled portfolio managers I know are small, focused, specialized firms with all their skin in the game. BlackRock’s iShares offers the iShares Core Allocation Funds, which are ETF allocations of ETFs. Each iShares Core Allocation Fund offers exposure to U.S. stocks, international stocks, and bonds at fixed weights and holds an underlying portfolio of iShares Core Funds. Investors can choose the portfolio that aligns with their specific risk considerations like investment time horizon and risk tolerance; for example, those with longer investment time horizons and higher risk tolerance may consider the iShares Core Aggressive Allocation ETF.
More specifically, the iShares Core Allocation Funds track the S&P Target Risk Indexes. So, not only do you have BlackRock’s portfolio management managing the fund, but they are tracking S&P Target Risk Indexes. Here is their description:
S&P Dow Jones Indices’ Target Risk series comprises multi-asset class indices that correspond to a particular risk level. Each index is fully investable, with varying levels of exposure to equities and fixed income and are intended to represent stock and bond allocations across a risk spectrum from conservative to aggressive.
In other words, they each provide varying allocations to bonds and stocks. The Conservative model is more bonds, the Aggressive model is more stocks.
S&P Target Risk Conservative Index. The index seeks to emphasize exposure to fixed income, in order to produce a current income stream and avoid excessive volatility of returns. Equities are included to protect long-term purchasing power.
S&P Target Risk Moderate Index. The index seeks to provide significant exposure to fixed income, while also providing increased opportunity for capital growth through equities.
S&P Target Risk Growth Index. The index seeks to provide increased exposure to equities, while also using some fixed income exposure to dampen risk.
S&P Target Risk Aggressive Index. The index seeks to emphasize exposure to equities, maximizing opportunities for long-term capital accumulation. It may include small allocations in fixed income to enhance portfolio efficiency.
Below is an example of the S&P Target Risk Index allocations and the underlying ETFs they invest in. Notice their differences is the 10% to 20% allocation between stocks and bonds.
These ETFs offer low-cost exposure to global asset allocation with varying levels of “risk,” which really means varying levels of allocations to bonds. I say they are “low-cost” because these ETFs only charge 0.25% including the ETFs they are invested in. Most financial advisors probably charge 1% for global asset allocation, not including trade commissions and the fund fees they invest in. Even the lowest fee advisors charge at least 0.25% plus the trade commissions and the fund fees they invest in. With these funds, investors who want long-only exposure all the time to global stock and bond market risks and returns, they can get it cheap in one fund.
Now that we know what they are, below are their total returns including dividends year to date in 2018. (To see the full history click: iShares)
The % off high chart shows their drawdowns from their price high.
Global asset allocation is having a challenging year in 2018 because U.S. stocks, International stocks, and bonds are all down this year.
Of course, a calendar year doesn’t mean a lot. What we do over 15 or 20 years or more is what matters. But, as low-cost index asset allocation advisors talk about the performance of active managers and hedge fund type managers, 2018 has included conditions that have been hostile for all kinds of strategies.
As I said yesterday if this market volatility and correction develops into a full bear market, the asset allocations that are fully exposed to downside risk will test investors’ tolerance for drawdowns.
How deep can drawdowns be for such a globally diversified portfolio? Looking at the historical % off high of DFA Global Allocation and Vanguard Balanced gives a historical example. Even two of the efficient allocation funds available had drawdowns of around -35% to -40% in the last bear market. If it’s done it before, it can certainly happen again.
Those of us applying active risk management and hedging strategies aim to limit the drawdowns within a tolerable amount rather than allowing them to become too large. For me, more than -20% becomes exponentially more difficult to tolerate and recover from. We have to deal with the -10% or so drawdowns sometimes since we can’t avoid them all. We necessarily have to take some risk to gain exposure to the possibility of gains.
Ok, so my headline was a little exaggerated. Drawdowns of -5% to -12% isn’t exactly a “beating”, but that’s the kind of headline we often see about active management and hedge funds.
You can probably see why I believe it’s essential to actively manage risk and position capital in the direction of price trends.
The observations shared on this website are for general information only and are not specific advice, research, or buy or sell recommendations for any individual. Investing involves risk including the potential loss of principal an investor must be willing to bear. Past performance is no guarantee of future results. The presence of this website on the Internet shall in no direct or indirect way raise an implication that Shell Capital Management, LLC is offering to sell or soliciting to sell advisory services to residents of any state in which the firm is not registered as an investment advisor. Use of this website is subject to its terms and conditions.
It takes at minimum a full market cycle including both bull/bear markets to declare an edge in an investment management track record.
But we also have different regimes. For example, each bull market can be different as they are driven by unique return drivers. Some are more inflationary from real economic expansion driving up prices. Others are driven by external manipulation, like the Fed intervention.
I’ve been managing ASYMMETRY® Global Tactical for fourteen years. It’s an unconstrained, flexible, adaptable, go-anywhere global tactical program without the limitations of a fixed benchmark. I pursue absolute returns applying dynamic risk management and unconstrained tactical trading decisions across a broad universe of global currency, bonds, stocks, and commodities.
So, I can tell you the bull market 2003-07 was a regime of rising commodities, foreign currency, and international producers of commodities. In this bull market, U.S. equities have dominated. We can see that in the chart below. If your exposure up until 2008 was only U.S. stocks, you would be disappointed as Emerging Markets countries like China and Brazil were much stronger as was commodities. We can also see how those markets have lagged since the low in 2009.
Everything is impermanent, nothing lasts forever, so this too shall change eventually. Those who believe the next decade will be like the past do not understand the starting point matters, the return drivers, and how markets interact with each other. Past performance is never a guarantee of future results.
About a week after a hedge fund manager who is popular with the media but has a poor track record of managing risk said “please stop talking about the low VIX”, it gains 44.4% in a single day – its 9th biggest 1-day move. He was suggesting the low VIX wasn’t an indication of high risk. If you have followed my observations, you know that I disagree. I’m one who has been talking about the low VIX and suggesting it is one of many indications of complacency among investors. That is, investors hear “all time new highs” and get overly optimistic instead of reducing their risk or being prepared to manage downside loss.
I point out the hedge fund manager’s comment because I believe a low VIX is an indication of complacency because it measures expected implied volatility for options on the S&P 500 stocks. When implied volatility gets to historical low points, it means options traders aren’t paying high premiums for hedging “protection”. Others can believe what they want to believe. I don’t just point out observations at extremes. I actually do something.
As I pointed out recently in “No Inflection Point Yet, But… ” the VIX was at an extreme low. About a week later this other fund manager implies it may not be meaningful. That’s exactly what we expect to hear when the expected volatility gets to such an extreme low. We expect to see it shift the other direction at some point. I like to follow trends until they reach an extreme – and reverse.
Here is what it looked like.
More importantly, here is what the stock indexes looked like on Google Finance after the close:
Another observation I shared in “No Inflection Point Yet, But…” is that leading stocks can sometimes be more volatile and yesterday was no exception. While the stock indexes were down around -1.5% some of the most popular stocks were down about twice as much:
“The essence of investment management is the management of risks, not the management of returns. Well-managed portfolios start with this precept.”
– Benjamin Graham
The problem is many portfolio managers believe they manage risk through their investment selection. That is, they believe their rotation from one seemingly risky position to another they believe is less risk is a reduction in risk. But, the risk is the exposure to the chance of a loss. The exposure is still there. Only the perception has changed: they just believe their risk is less. For example, for the last thirty years, the primary price trend for bonds has been up because interest rates have been falling. If a portfolio manager shifts from stocks to bonds when stocks are falling, bonds would often be rising. It appears that trend may be changing at some point. Portfolio managers who have relied on bonds as their safe haven may rotate out of stocks into bonds and then their bonds lose money too. That’s not risk management.
They don’t know in advance if the position they rotate to will result in a lower possibility of loss. Before 2008, American International Group (AIG) carried the highest rating for an insurance company. What if they rotated to AIG? Or to any of the other banks? Many investors believed those banks were great values as their prices were falling. They instead fell even more. It has taken them a long time to recover some of their losses. Just like tech and telecom stocks in 2000.
All risks cannot be hedged away if you pursue a profit. If you leave no chance at all for a potential profit, you earn nothing for that certainty. The risk is exposure to an unknown outcome that could result in a loss. If there is no exposure or uncertainty, there is no risk. The only way to manage risk is to increase and decrease the exposure to the possibility of loss. That means buying and selling (or hedging). When you hear someone speaking otherwise, they are not talking of active risk management. For example, asset allocation and Modern Portfolio Theory is not active risk management. The exposure to loss remains. They just shift their risk to more things. Those markets can all fall together, as they do in real bear markets.
“I like analogies. And one of the analogies in 2008 brings to me it’s like a sailor setting his course on a sea. He’s got a great sonar system, he’s got great maps and charts and he’s perhaps got a great GPS so he knows exactly where he is. He knows what’s ahead of him in the ocean but his heads down and he’s not seeing these awesomely black storm clouds building up on the horizon are about to come over top of him. Some of those managers we did not stay with. Managers who saw that, who changed course, trimmed their exposure, or sailed to safer territory. One, they survived; they truly preserved capital in difficult times and my benchmark for preserving capital is you had less than a double-digit loss in 08, you get to claim you preserved capital. I’ve heard people who’ve lost as much as 25% of investor capital argue that they preserved capital… but I don’t believe you can claim that.Understanding how a manager managed and was nimble during a period of time it gives me great comfort, a higher level of comfort, on what a manager may do in the next difficult period. So again it’s a it’s a very qualitative sort of trying to come to an understanding of what happened… and then make our best guess what we anticipate may happen next time.”
I made bold the parts I think are essential.
If you are like-minded and believe what we believe, contact us.
In the last observation I shared on the CBOE Volatlity index (the VIX) I had been pointing out last year the VIX was at a low level and then later started trending up. At that time, many volatility traders seemed to think it was going to stay low and keep going lower – I disagreed. Since then, the VIX has remained at a higher average than it had been – up until now. You can read that in VIX® gained 140%: Investors were too complacent.
Here it is again, closing at 12.45 yesterday, a relatively low level for expected volatility of the S&P 500 stocks. Investors get complacent after trends drift up, so they don’t price in so much fear in options. Below we observe a monthly view to see the bigger picture. The VIX is getting down to levels near the end of the last bull market (2007). It could go lower, but if you look closely, you’ll get my drift.
Options traders have priced in low implied volatility – they expect volatility to be low over the next month. That is happening as headlines are talking about stock indexes hitting all time highs. I think it’s a sign of complacency. That’s often when things change at some point.
It also means that options premiums are generally a good deal (though that is best determined on an individual security basis). Rather than selling premium, it may be a better time to buy it.
“In prospect theory, loss aversion refers to the tendency for people to strongly prefer avoiding losses than acquiring gains. Some studies suggest that losses are as much as twice as psychologically powerful as gains. Loss aversion was first convincingly demonstrated by Amos Tversky and Daniel Kahneman.”
For most people, losing $100 is not the same as not winning $100. From a rational point of view are the two things the same or different?
Most economists say the two are the same. They are symmetrical. But I think that ignores some key issues.
If we have only $10 to eat on today and that’s all we have, if we lose it, we’ll be in trouble: hungry.
But if we have $10 to eat on and flip a coin in a bet and double it to $20, we may just eat a little better. We’ll still eat. The base rate: survival.
They say rationally the two are the same, but that isn’t true. They aren’t the same. The loss makes us worse off than we started and it may be totally rational to feel worse when we go backward than we feel good about getting better off. I don’t like to go backward, I prefer to move forward to stay the same.
Prospect Theory, which found people experience a loss more than 2 X greater than an equal gain, discovered the experience of losses are asymmetric.
Actually, the math agrees.
You see, losing 50% requires a 100% gain to get it back. Losing it all is even worse. Losses are indeed asymmetric and exponential on the downside so it may be completely rational and logical to feel the pain of losses asymmetrically. Experience the feeling of loss aversions seems to be the reason a few of us manage investment risk and generate a smoother return stream rather than blow up.
Absolute Return in its basic definition is the return that an asset achieves over a certain period of time. This measure looks at the appreciation or depreciation (expressed as a dollar amount or a percentage). For example, a $50 stock drifts to $100 is a 100% absolute return. If that same stock drifts back from $100 to $50, its absolute return is -50%.
Absolute Return as an investment objective is one that does not try to track or beat an arbitrary benchmark or index, but instead seeks to generate real profits over a complete market cycle regardless of market conditions. That is, an absolute return objective of positive returns on investment over a market cycle of both bull and bear market periods irrespective of the direction of stock, commodity, or bond markets. Since the U.S. stock market has been generally in a uptrend for 6 years now, other than the -20% decline in the middle of 2011, we’ll now have to expand our time frame for a full market cycle to a longer period. That is, a full market cycle includes both a bull and a bear market.
The investor who has an absolute return objective is concerned about his or her own objectives for total return over a period and tolerance for loss and drawdowns. That is a very different objective than the investor who just wants whatever risk and return a benchmark, allocation, or index provides. Absolute returns require skill and active management of risk and exposure to markets.
Absolute return as a strategy: absolute return is sometimes used to define an investment strategy. An absolute return strategy is a plan, method, or series of maneuvers aiming to compound capital positively and to avoid big losses to capital in difficult market conditions. Whereas Relative Return strategies typically measure their success in terms of whether they track or outperform a market benchmark or index, absolute return investment strategies aim to achieve positive returns irrespective of whether the prices of stocks, bonds, or commodities rise or fall over the market cycle.
Absolute Return Investment Manager
Whether you think of absolute return as an objective or a strategy, it is a skill-based rather than market-based. That is, the absolute return manager creates his or her results through tactical decision-making as opposed to taking what the market is giving. One can employ a wide range of approaches toward an absolute return objective, from price-based trend following to fundamental analysis. In the ASYMMETRY® Managed Accounts, I believe price-based methods are more robust and lead to a higher probability of a positive expectation. Through my historical precedence, testing, and experience, I find that any fundamental type method that is based on something other than price has the capability to stray far enough from price to put the odds against absolute returns. That is, a manager buying what he or she believes is undervalued and selling short what he believes is overvalued can go very wrong if the position is on the wrong side of the trend. But price cannot deviate from itself. Price is the judge and the jury.
To create absolute returns, I necessarily focus on absolute price direction. Not relative strength, which is a rate of change relative to another moving trend. And, I focus on actual risk, not some average risk or an equation that oversimplifies risk like standard deviation.
Of course, absolute return and the “All Weather” type portfolio sound great and seem to be what most investors want, but it requires incredible skill to execute. Most investors and advisors seem to underestimate the required skills and experience and most absolute return strategies and funds have very limited and unproven track records. There is no guarantee that these strategies and processes will produce the intended results and no guarantee that an absolute return strategy will achieve its investment objective.
In “Absolute Return: The Basic Definition”, I explained an absolute return is the return that an asset achieves over a certain period of time. To me, absolute return is also an investment objective.
In “Absolute Return as an Investment Objective” I explained that absolute return is an investment objective is one that does not try to track or beat an arbitrary benchmark or index, but instead seeks to generate real profits over a complete market cycle regardless of market conditions. That is, it is focused on the actual total return the investor wants to achieve and how much risk the investor will willing to take, rather than a focus on what arbitrary market indexes do.
Absolute return as a strategy: absolute return is sometimes used to define an investment strategy. An absolute return strategy is a plan, method, or series of maneuvers aiming to compound capital positively and to avoid big losses to capital in difficult market conditions. Whereas Relative Return strategies typically measure their success in terms of whether they track or outperform a market benchmark or index, absolute return investment strategies aim to achieve positive returns irrespective of whether the prices of stocks, bonds, or commodities rise or fall over the market cycle.
Whether you think of absolute return as an objective or a strategy, it is a skill-based rather than market-based. That is, the absolute return manager creates his or her results through tactical decision-making as opposed to taking what the market is giving. One can employ a wide range of approaches toward an absolute return objective, from price-based trend following to fundamental analysis. In the ASYMMETRY® Managed Accounts, I believe price-based methods are more robust and lead to a higher probability of a positive expectation. Through my historical precedence, testing, and experience, I find that any fundamental type method that is based on something other than price has the capability to stray far enough from price to put the odds against absolute returns. That is, a manager buying what he or she believes is undervalued and selling short what he believes is overvalued can go very wrong if the position is on the wrong side of the trend. But price cannot deviate from itself. Price is the judge and the jury.
Of course, absolute return and the “All Weather” type portfolio sound great and seem to be what most investors want, but it requires incredible skill to execute. Most investors and advisors seem to underestimate the required skills and experience and most absolute return strategies and funds have very limited and unproven track records. There is no guarantee that these strategies and processes will produce the intended results and no guarantee that an absolute return strategy will achieve its investment objective.
In Absolute Return: The Basic Definition, I explained an absolute return is the return that an asset achieves over a certain period of time. To me, absolute return is also an investment objective.
Absolute Return as an investment objective is one that does not try to track or beat an arbitrary benchmark or index, but instead seeks to generate real profits over a complete market cycle regardless of market conditions. That is, an absolute return objective of positive returns on investment over a market cycle of both bull and bear market periods irrespective of the direction of stock, commodity, or bond markets.
Since the U.S. stock market has been generally in a uptrend for 6 years now, other than the -20% decline in the middle of 2011, we’ll now have to expand our time frame for a full market cycle to a longer period. That is, a full market cycle includes both a bull and a bear market.
The investor who has an absolute return objective is concerned about his or her own objectives for total return over a period and tolerance for loss and drawdowns. That is a very different objective than the investor who just wants whatever risk and return a benchmark, allocation, or index provides. Absolute returns require skill and active management of risk and exposure to markets.
Rather than a long article, this is going to be a series of smaller parts, building up to what absolute return really means.
I noted the below question and answer between Jack Schwager and Ray Dalio in Jack’s book “Hedge Fund Market Wizards: How Winning Traders Win” (2012). Ray Dalio is the founder of Bridgewater, the largest hedge fund in the world and one of the most successful. I saved it when I read the book as a fine example that markets don’t always react the way people expect, and that is why I focus instead on what is actually happening rather than what could or should happen – but may not. Everything is very transient, coming and going, and it’s funny how some of the same kinds of things happen over and over again. As you read comments below you’ll hear it’s always a similar story, different day. 1982 was the end of a 20 year secular bear market made up of huge swings similar to the past decade and the beginning of the largest bull market on record up to 2000.
Below is Jack Schwager asking a question to Ray Dalio:
Any other early experiences stand out where the market behaved very differently from what you expected?
In 1982, we had worse economic conditions than we do right now. The unemployment rate was over 11 percent. It also seemed clear to me that Latin America was going to default on its debt. Since I knew that the money center banks had large amounts of their capital in Latin American debt, I assumed that a default would be terrible for the stock market. Then boom—in August, Mexico defaulted. The market responded with a big rally. In fact, that was the exact bottom of the stock market and the beginning of an 18-year bull market. That is certainly not what I would have expected to happen. That rally occurred because the Fed eased massively. I learned not to fight the Fed unless I had very good reasons to believe that their moves wouldn’t work. The Fed and other central banks have tremendous power. In both the abandonment of the gold standard in 1971 and in the Mexico default in 1982, I learned that a crisis development that leads to central banks easing and coming to the rescue can swamp the impact of the crisis itself.
All of this, everything that is happening and expected to happen, will be reflected in the directional trend and volatility of price. The directional price and range of prices (volatility) will overreact at times and under-react at others, but it will reflect what is actually going on. Because the direction and volatility of price “is” what matters.
Bernie Madoff is back in the news lately as it’s now been 5 years since he was arrested for the largest Ponzi Scheme. For some reason, the name is commonly linked to “hedge funds”. Yet, the Bernie Madoff scam wasn’t a hedge fund, his company was a registered and regulated brokerage firm called Bernard L. Madoff Investment Securities. Madoff founded the Wall Street brokerage firm Bernard L. Madoff Investment Securities LLC in 1960. Some large hedge funds lost money because they had invested in Madoff’s managed account. They had Madoff managing some of their funds money. But Madoff Investment Securities LLC wasn’t a hedge fund.
If you had an account managed by Bernie Madoff at Madoff Investment Securities LLC you would have had an account owned and titled in your own name. You would have gotten trade confirmations from Madoff Investment Securities LLC when he bought or sold. You don’t get that in a fund. You don’t know when a fund buys or sells. His investment program, then, offered the appearance of transparency – you could see what he was doing at any time.
As it turned out, the appearance of transparency enabled the thief to defrauded customers of approximately $20 billion over several decades. You see, Madoff’s investment program was a fraud, and the reason he was able to do it is that:
1. He was the portfolio manager: he made the trading decisions.
2. He owned the broker that executed the trades (as it turned out, they were fake; he didn’t do trades).
3. He owned the custodian: the custodian and broker was the same company.
Since Madoff Investment Securities LLC was the portfolio manager, broker, and the custodian, that allowed him to pretend to do trades and print trade confirmations and statements with fake information on them. Madoff Investment Securities LLC was regulated and registered as a brokerage firm, just like Wells Fargo Advisors, Edward Jones, Schwab, Morgan Stanley, and other brokers. You can probably see how the real issue was that his program was a fraud and he was able to do it because he controlled the trading decisions, trade confirms, account statements, and custody, because his company did it all. What if he had been required to custody an another company independent of his? he would have had to convince the other company to participate in his scheme which would likely have gotten him busted sooner. Most investment companies aren’t a fraud, so they would likely report him. Madoff was large and respected – but don’t think that made it any safer.
Whether you invest in a separately managed account or a private investment partnership, require that they use multiple service providers that are independent of each other instead of all one company. For example, your portfolio manager is an asset management firm, the broker is a different company that executes the trades and the custodian is a separate company that holds the securities and handles the cash in and out. Then, require it be audited by even another independent company. For example, if you enter into an investment management agreement with ABC Capital Management, LLC that firm is the portfolio manager and the agreement gives it authority to buy and sell in your account. Your account should then be held at a financial institution registered as a broker or bank like Folio Institutional, Trust Company of America, or JP Morgan. You deposit money to that financial institution that holds your money and they send you statements. ABC Capital Management, LLC is just trading the account independently and shouldn’t have custody of the money. If the investment program is a “hedge fund” instead of a separately managed account then it’s typically structured as a private investment partnership, say: ABC Fund, LP. A private fund is operated like a business – the business is trading for profit. You review a Private Placement Memorandum that explains every detail of ABC Fund, LP. When you invest, you sign a “Subscription Agreement” instead of an investment management agreement. You wire the deposit to the bank account of ABC Fund, LP and that money is then wired to the funds brokerage account. It’s best to require the fund to have a “third party administrator” who acts as the funds controller and accountant. That third party administrator is who accounts for your investment and sends you statements showing the value of your investment. You can probably see why you want the administrator to be a third party – independent from the fund manager. Then, the fund is audited annually to verify the administrators accounting is accurate. When ABC Fund, LP is a private investment partnership, it should be operated like any other major business with multiple investors. It has a bank account that sends/receives wires, a custodian that holds securities, a broker that executes trades, a third party administrator that does the accounting and creates profit and loss statements, and an independent accountant that audits all of it. Those should be separate companies independent of each other, not one.
Unfortunately, most of the smaller scams we hear about are even worse than the Madoff scheme. The investors write a check to “John A. Doe” which isn’t even a company at all. I don’t think any legitimate investment program has you writing a check to the individual portfolio manager. Deposits should be made to an independent bank or custodian and statements should come from that custodian. In fact, it’s even better to wire the funds rather than write a check. But “You can’t fix stupid”. There will always be Madoff-like scams and people stupid enough to write them a check. If you simply require that all the service providers be separate companies you won’t be one of them.
I am often fascinated by investor perception and behavior. I notice it everywhere and study it always. What a person believes makes their world what it is and how they see things. It can also explain their own poor results. You see, if the majority of individual investors and professional investors actually have poor performance over long periods (as evidenced by Dalbar and SPIVA®) they necessarily must be doing and believing the wrong things.
I just came across something that said “Why are hedge fund indexes performing so poorly?”. My first thought was “Are they?”. There are a few different hedge fund indexes, but I use the Barclay Hedge Fund Indices because it can include more than 1,000 funds each month across a wide range of strategies.
The Barclay Hedge Fund Index is a measure of the average return of all hedge funds (excepting Funds of Funds) in the Barclay database. The index is simply the arithmetic average of the net returns of all the funds that have reported that month.
As you can see below, the Barclay Hedge Fund Index, which is the average return of all hedge funds in the Barclay database, has gained 5.22% year to date through August. Is 5.22% a “poor” return when the risk free rate on short-term T-Bills, money markets, and CD’s are near zero? I don’t think so. But, if you compare it to the highest returning index you can find maybe you’ll perceive it as “poor”. For example, the stock market indexes are so far “up” double digits this year, but they can reverse back down and end the year in the red. Stock indexes are long-only exposure to stocks so their results reflect a risk premium earned for owning stocks with no risk management to limit the downside. I don’t know anyone who thinks the stock indexes have created the kind of risk adjusted return they want after declining more than -50% twice the past several years. If they want to compare “hedge funds” to a long-only stock index they should consider focusing on hedge funds that focus on stocks.
As you can see below, the hedge fund index includes a wide range of alpha strategies. The Equity Short Bias is one of only two that are down year to date and that is expected: they are short stocks and stocks have gained this year, so these strategist that short stocks have lost money. Emerging Markets is the other that is down, which is not terribly surprising since most emerging markets are down. They have still managed risk: through August the Emerging Markets Hedge Fund Index is down -1.73% while the iShares MSCI Emerging Markets ETF is down -13.17%. I’m sure any of those hedge fund managers who are down don’t think that’s “good”, but its just a short period of time.
Investment managers are to compare their performance to something to illustrate the general market and economic conditions over a period. Since my investment programs don’t intend to benchmark any indexes, we often use the Barclay Hedge Fund Index as a comparison of this “alpha index” to our programs.
In the chart below, we have compared over a full market cycle the Barclay Hedge Fund Index, Dow Jones Global Moderate (a monthly rebalanced index of an allocation across 14 global indexes that are 60% global stocks, 40% global bonds), and the S&P 500 stock index The blue line is the Barclay Hedge Fund Index. Keep in mind that the hedge fund index is net of hedge fund fees while the S&P 500 stock index and Dow Jones Global Moderate does not reflect any fees. If an investor used an adviser, they would pay a management fee, index fund fees, and trading cost, so the net return would be less. Recently, it has “lagged” the other two, but over the full cycle, its risk/reward profile is significantly superior. Though they all ended with about the same total return, the Barclay Hedge Fund Index declined -24% peak to trough during the 2007 – 2009 bear market. That -24% is compared to -38% for the Dow Jones Global Balanced 60/40 index and -55% for the S&P 500 total return (including dividends). That is the advantage of “active risk management” many hedge funds attempt to apply. Look closely at the chart below and decide which experience you would have rather had. And then, consider that it’s important to view the full picture over a full market cycle rather than focus on short-term periods.
As to why the Barclay Hedge Fund Index has lagged stocks lately?
They are supposed to. Hedge funds as a group, as measured by a composite index, are investing and trading long and short multiple strategies across multiple markets: bonds, stocks, currency, commodities, and alternatives like volatility, real estate, etc.
You may also consider that hedge funds are generally risk managers (though not all have that objective). If you look at the end of the last bull market in stocks (late 2007) the hedge fund index lagged 100% stock indexes then, too. You may consider that risk managers are actively managing risk and they could be right in doing it now considering the stage in the cycle. It’s probabilistic, never a sure thing. It worked the last time. Some hedge fund strategies begin to reduce their exposure to high risk markets like stocks after they have moved up to avoid even the early stage of the decline. By doing that, they “miss out” on both the final gains but also the initial decline after a peak. Others wait until stocks actually reverse their trend, which means they’ll participate in some of the initial decline when it happens.
You may also consider that people bragging about the gains to long-only stock indexes that have no downside protection may be another sentiment indicator. Historically, it seems that about they time they get to bragging and become complacent the trend turns against them…
Note: you cannot invest directly in any of these indexes.
A performance incentive fee is the key compensation for a hedge fund manager. Many people may not understand the concept of “alignment of interest”. For example, an investor recently told me they only invest in private funds because of alignment of interest. Essentially they want the fund manager to profit when they do. For example, if a $50 million private fund earns a 10% net return, the fund manager would earn $1 million of the profit as a performance incentive. If the fund manager earned a 100% return, his compensation would be $10 million. If the fund manager has a loss he gets no performance incentive fee until the loss is fully recovered and the fund reaches a new high. You can probably see why some money managers focus on growing the fund through the process of trading rather than trying to find more and more new investor money. I know people across various sides of the money management industry – the incentives and motivations are vastly different depending on their business structure and specialization. A wealth manager that measures success by assets under management will focus on gaining new clients. An alternative portfolio manager pursuing asymmetric investment returns may have an incentive to focus more on the profits they generate. That is, if you really believe you’ve got some skill, you’ll want to align your rewards in that direction. At least, that’s what an entrepreneur who sells a business for $100 million may tell you.
A comparison by Preqin of hedge fund net returns categorized by the performance fees they charge shows that funds charging more than 20% in performance fees actually outperform those that charge 20% or less. Funds charging higher fees appear to be producing higher, and more consistent net returns…
I read The Little Book of Hedge Funds over a weekend. It’s an easy read and an excellent choice if you want to get a good overall understanding of hedge funds and the general industry of hedge fund management, selection, or absolute return strategies in general. It doesn’t get into detailed strategies, but instead a high level overview of the pursuit of asymmetric returns. My favorite part of the book was Anthony’s section on selection of hedge fund portfolio managers and how he defines “pedigree”. As he puts it (pp. 149-150):
“To make a long story short, the investment research and due diligence process is focused on determining or not a manager can: Generate attractive absolute and relative returns. Manage risk. Produce uncorrelated returns, with relatively attractive liquidity. Evolve as market conditions evolve. Perhaps most important, we have to understand how they will behave when the shit hits the fan in market debacles like LTCM, September 11th, the summer of 2002, 2008, the European financial crisis, and so on.”
He goes on to say he breaks the manager selection process into two categories. The first is Pedigree (pp. 150-151):
Pedigree:
“Pedigree is an all-encompassing term we use to assess whether a manager possesses the right experience and skill to execute a particular strategy in a particular market environment. Typically, an investor should strive to find a manager with many years of real “buy-side experience,” that is, the manager should have actually managed a reasonable amount of capital over a reasonable period of time. The exception to this rule is a new, cutting-edge manager who is implementing strategies that may not have existed three years ago. You would be surprised at how many hedge funds fail the basic “experience” test. For instance, if a manager’s only prior experience is that he was a fixed-income salesman, you could undoubtedly find someone with more relevant experience and skills. For whatever reason, a lot of hedge fund investors tend to be drawn like moths to a flame to big-name sell-side guys who come out and launch a new hedge fund. A general rule of thumb: Avoid these guys like the plague as history has shown that they tend to always fail. After all, managing capital for private investors is completely different from running market making/prop trading outfits. Pedigree also includes a manager’s temperament and qualitative judgment. Is he a loose cannon or thoughtful and deliberative? Has he experienced personal and professional setbacks in his career and how has he responded? Has he treated his investor capital with prudence or has he viewed it as a tool to make a name for himself and get rich quick? Answering these questions takes a lot of work. But, if you want to invest with a hedge fund manager you have to be willing to roll up your sleeves and analyze that manager’s pedigree.”
I thought his explanation of pedigree is outstanding. He points out that pedigree is more about a persons actual experience and skill as evidenced by track record rather than the things we would see on a resume like college alumni, GPA, and places they’ve worked. It shows Anthony Scaramucci is the real deal. That is especially true because Anthony himself is a Harvard MBA graduate and began his career at Goldman Sachs before staring his own firm. Getting in and out of Harvard’s MBA program and landing a job at Goldman is an accomplishment, but says nothing about ability to manage money. A portfolio managers pedigree is about executing with an edge and is evidenced by a track record.
The Little Book of Hedge Funds description from Amazon:
The Little Book of Hedge Funds that’s big on explanations even the casual investor can use. An accessible overview of hedge funds, from their historical origin, to their perceived effect on the global economy, to why individual investors should understand how they work, The Little Book of Hedge Funds is essential reading for anyone seeking the tools and information needed to invest in this lucrative yet mysterious world. Authored by wealth management expert Anthony Scaramucci, and providing a comprehensive overview of this shadowy corner of high finance, the book is written in a straightforward and entertaining style. Packed with introspective commentary, highly applicable advice, and engaging anecdotes, this Little Book:
Explains why the future of hedge funds lies in their ability to provide greater transparency and access in order to attract investors currently put off because they do not understand how they work
Shows that hedge funds have grown in both size and importance in the investment community and why individual investors need to be aware of their activities
Demystifies hedge fund myths, by analyzing the infamous 2 and 20 performance fee and addressing claims that there is an increased risk in investing in hedge funds
Explores a variety of financial instruments—including leverage, short selling and hedging—that hedge funds use to reduce risk, enhance returns, and minimize correlation with equity and bond markets
Written to provide novice investors, experienced financiers, and financial institutions with the tools and information needed to invest in hedge funds, this book is a must read for anyone with outstanding questions about this key part of the twenty-first century economy.
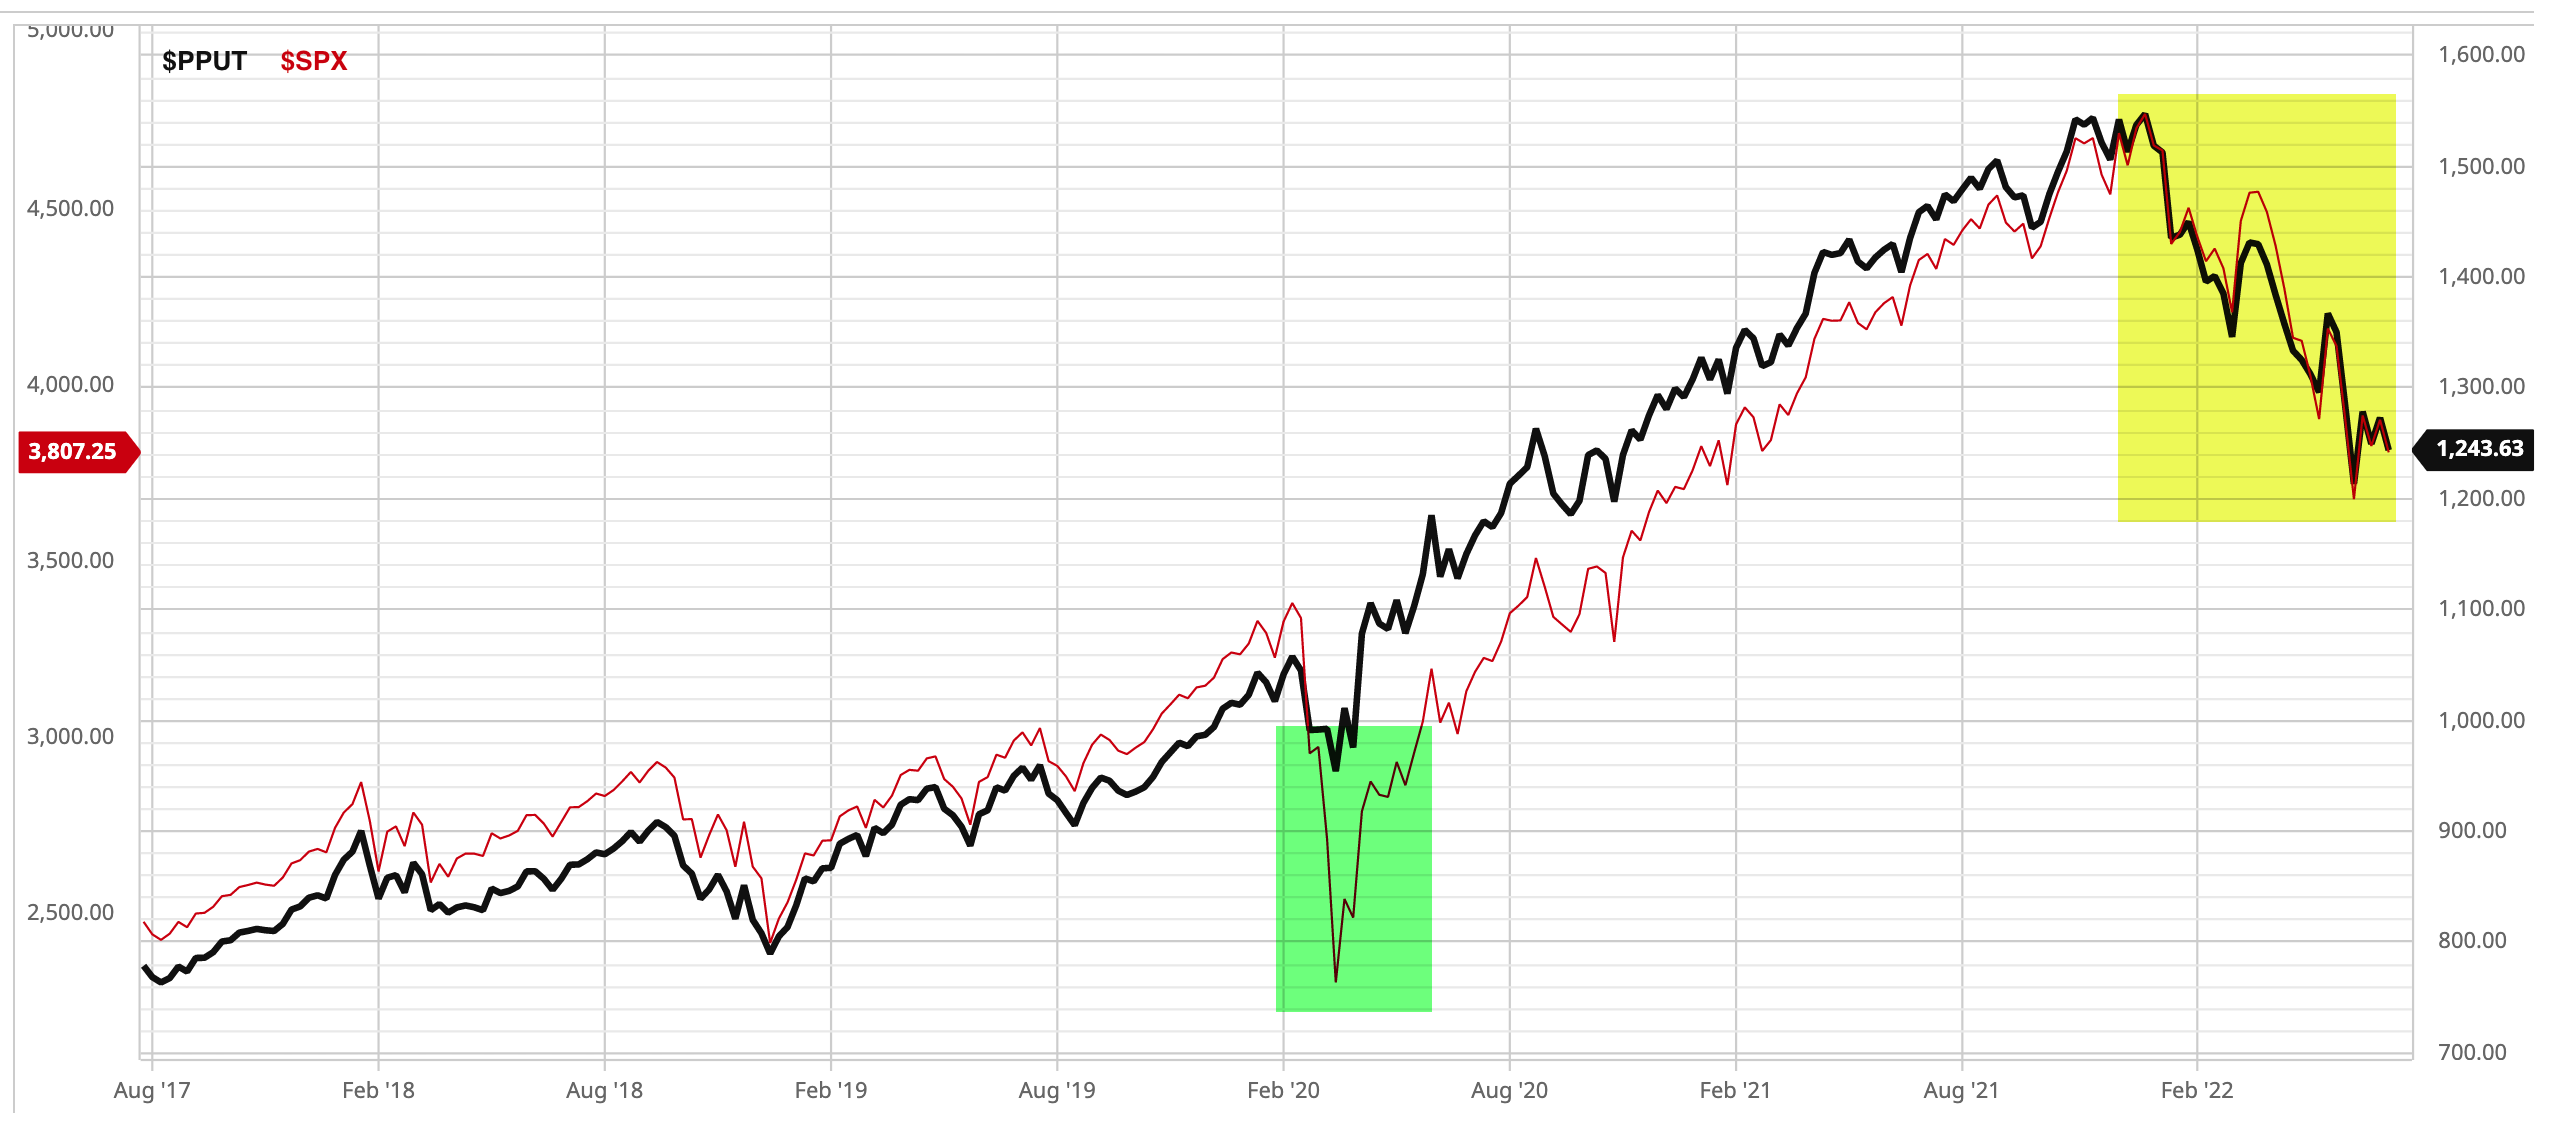
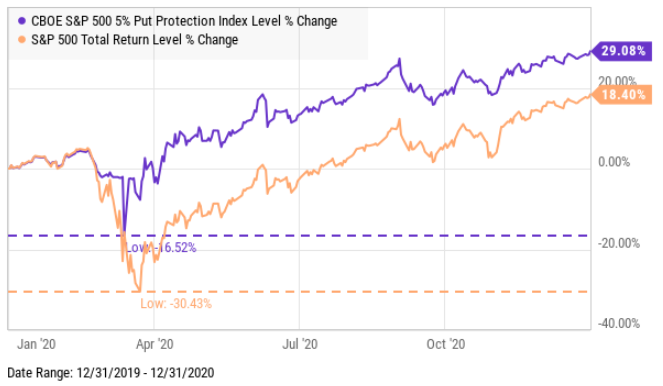


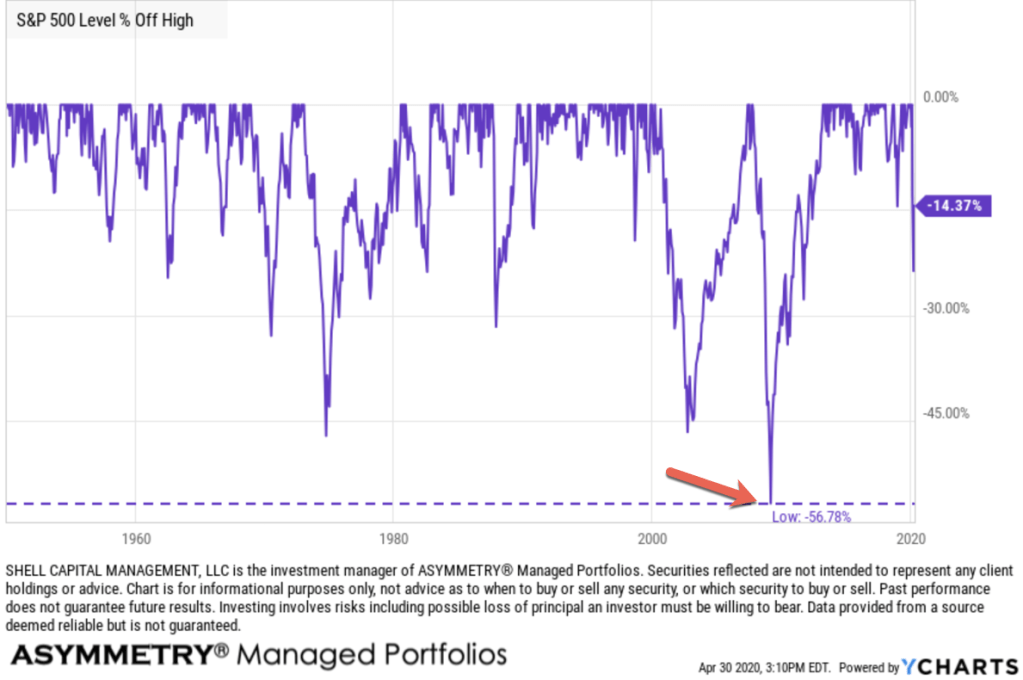
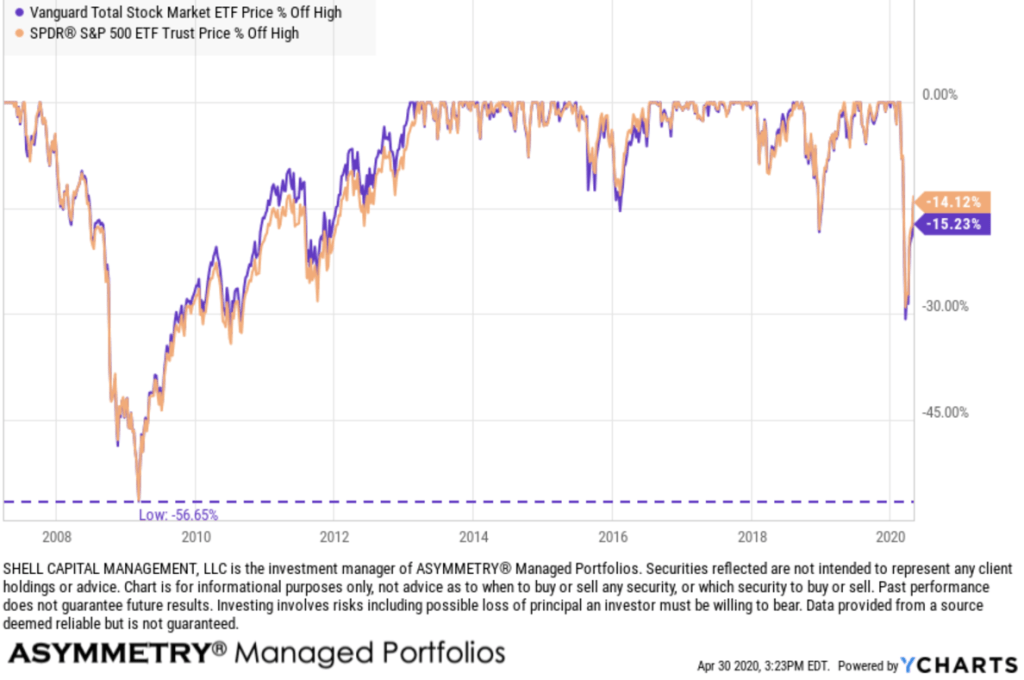
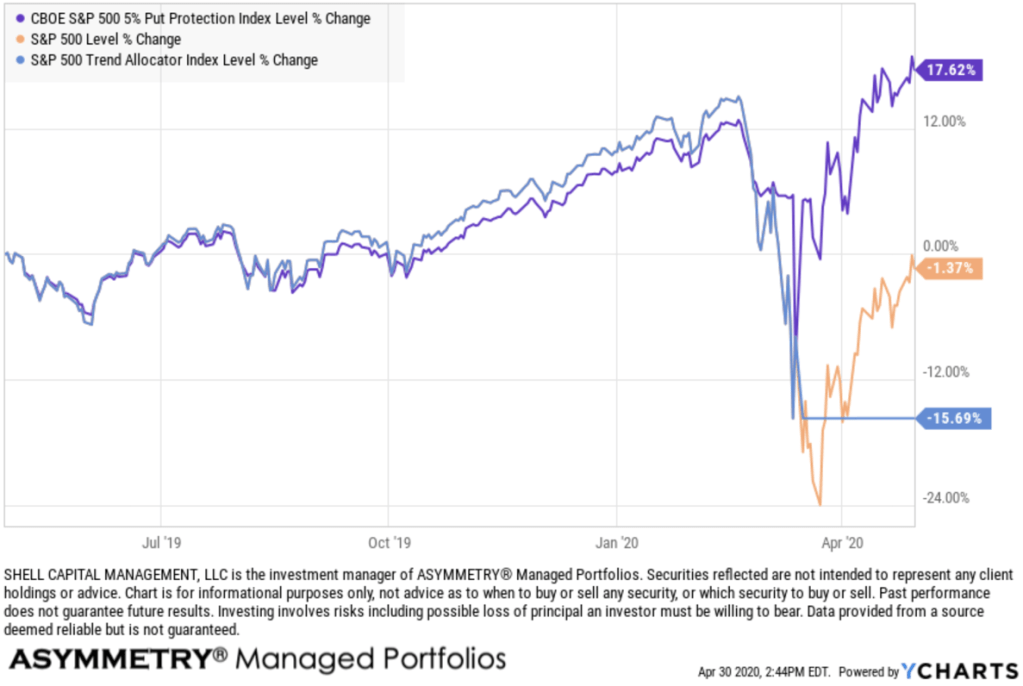
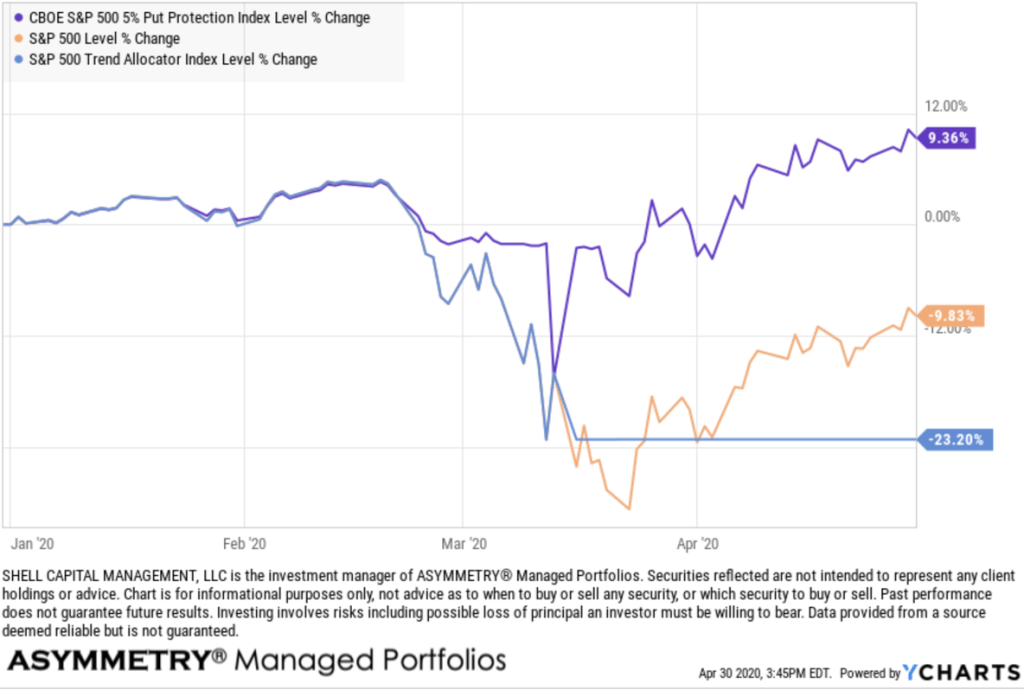
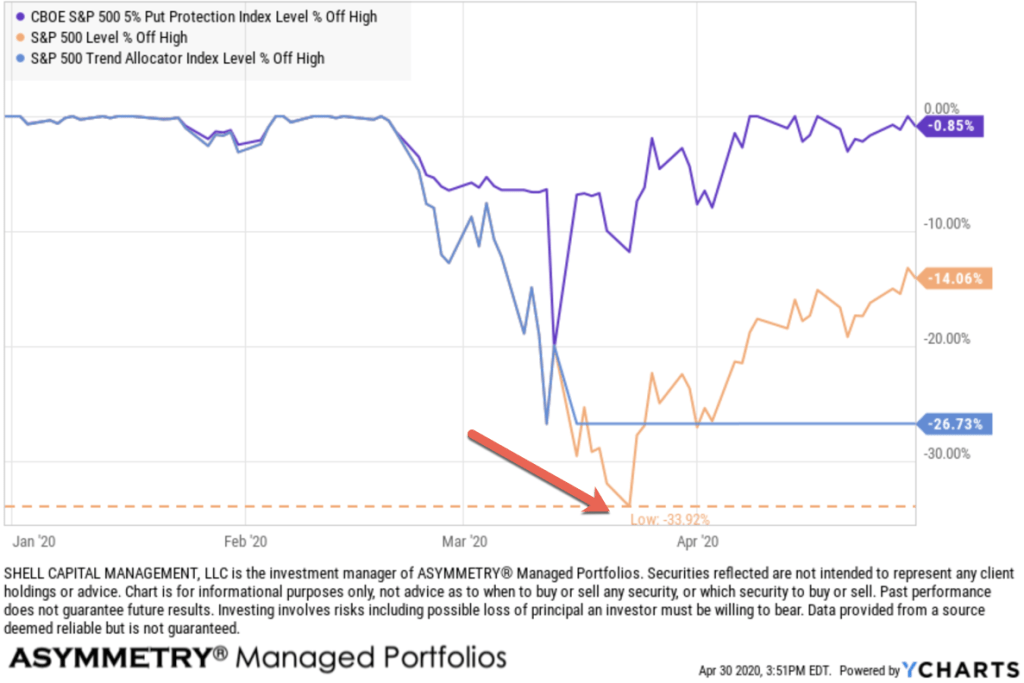
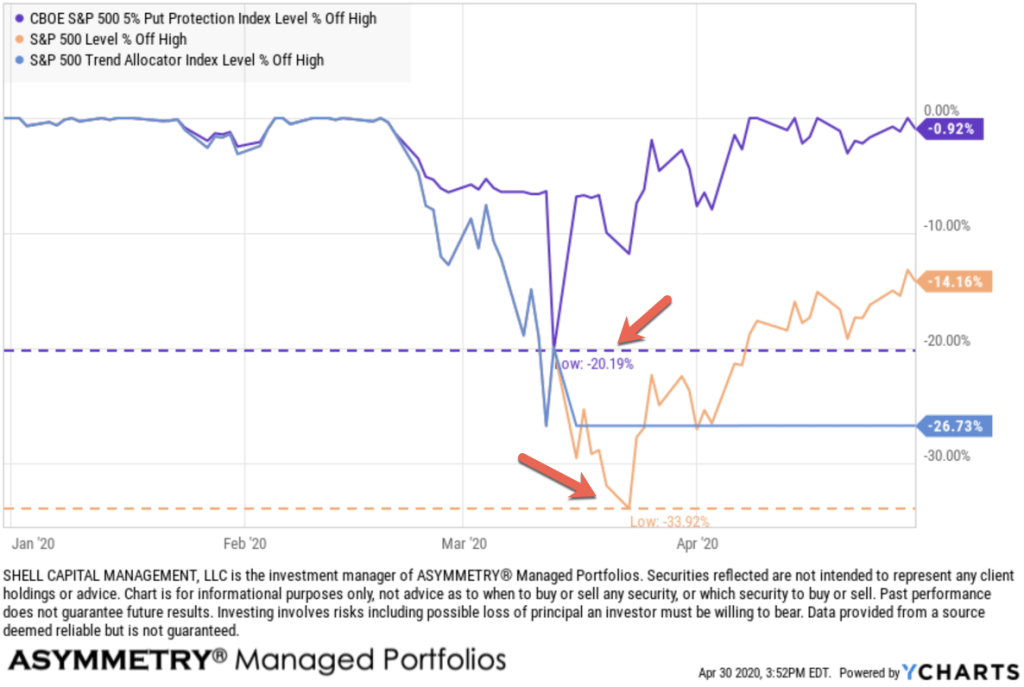
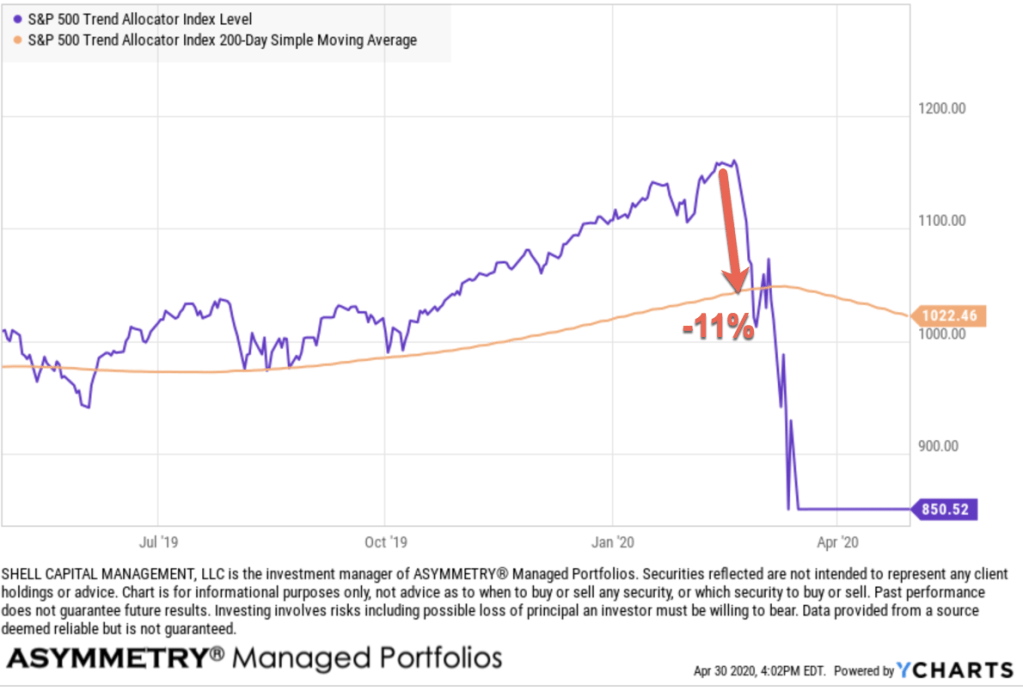
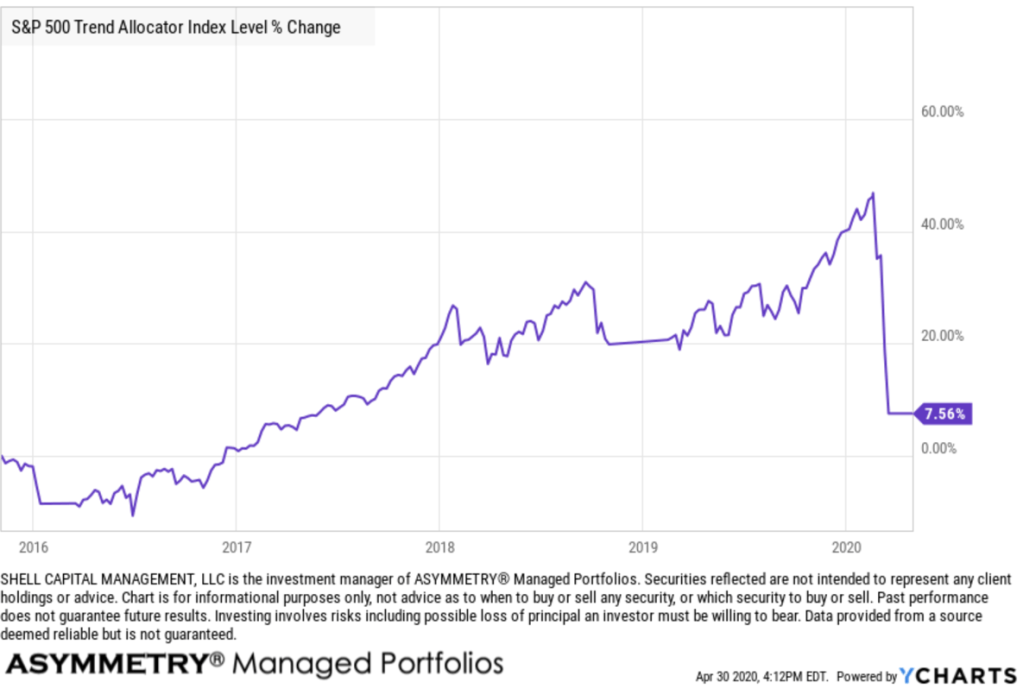
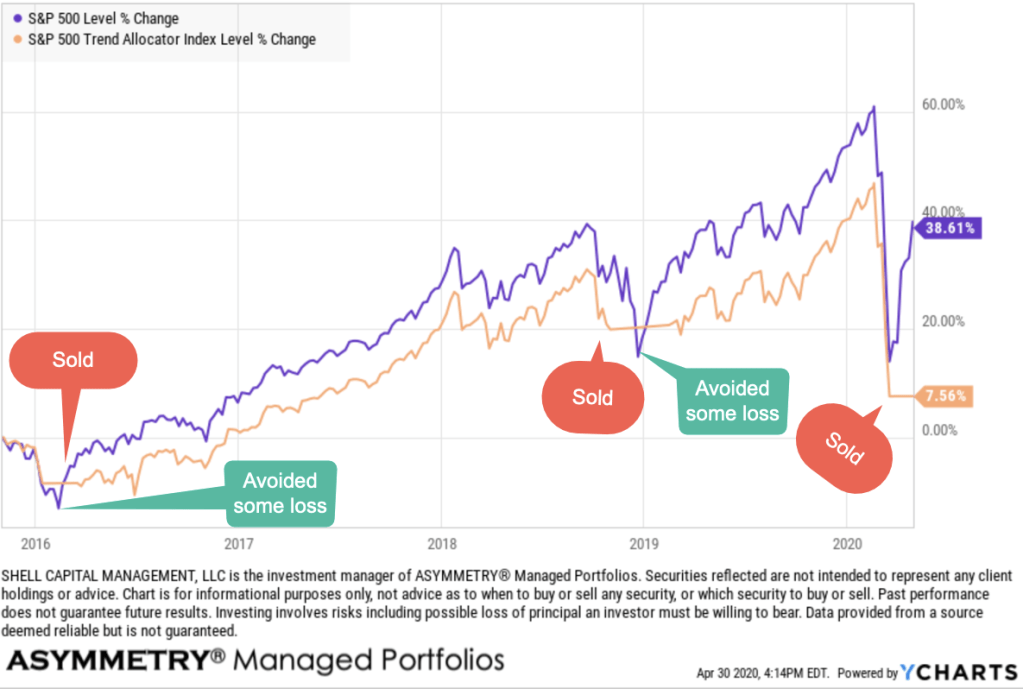
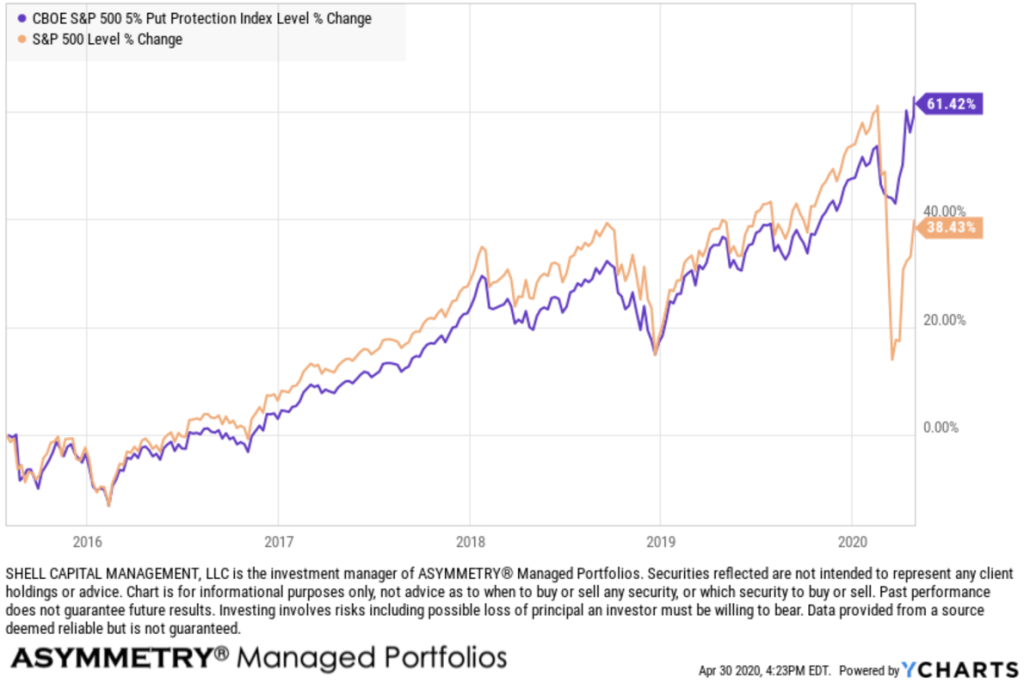

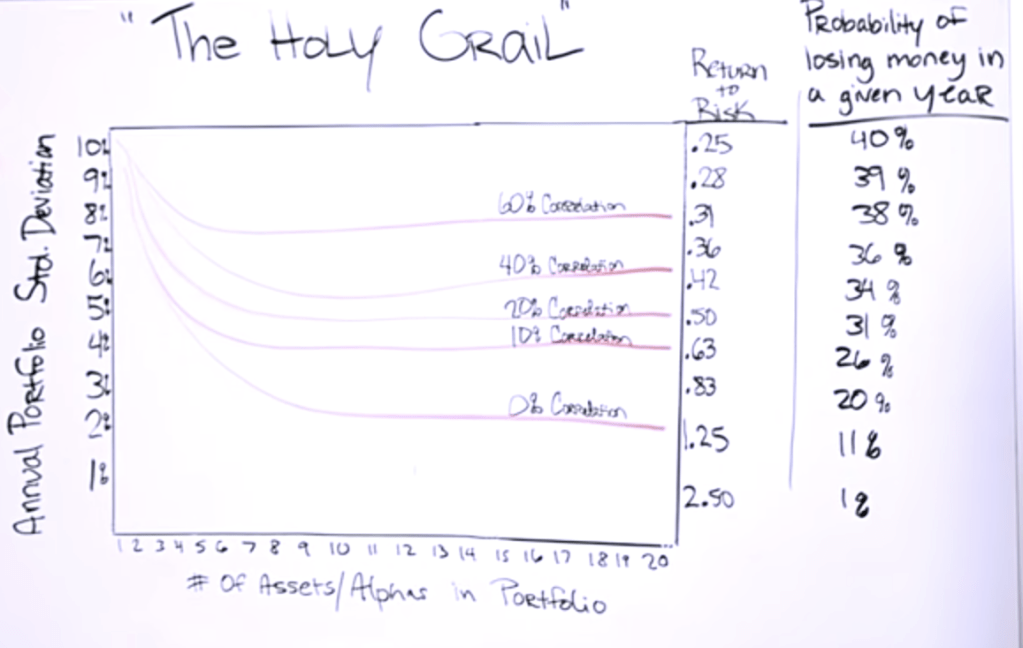
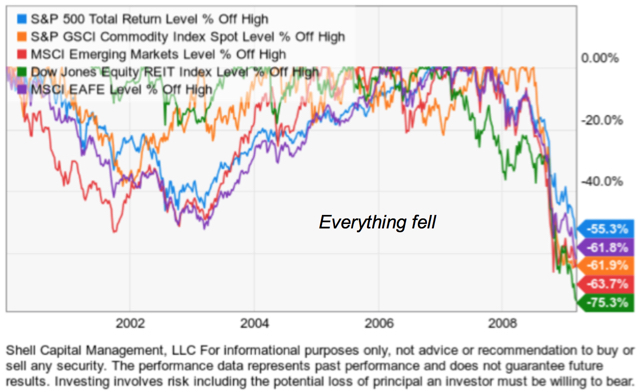
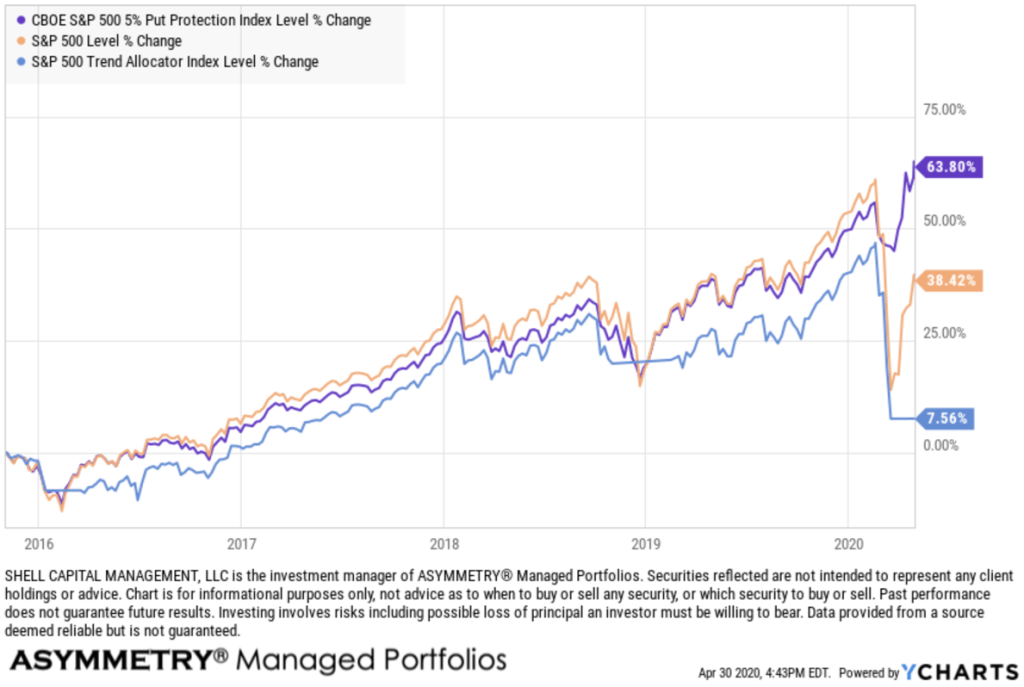


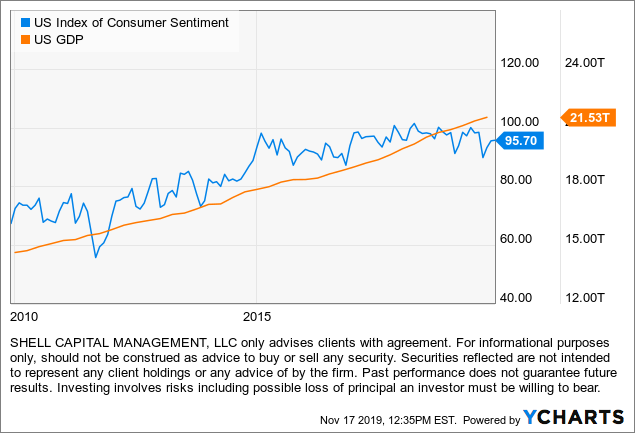

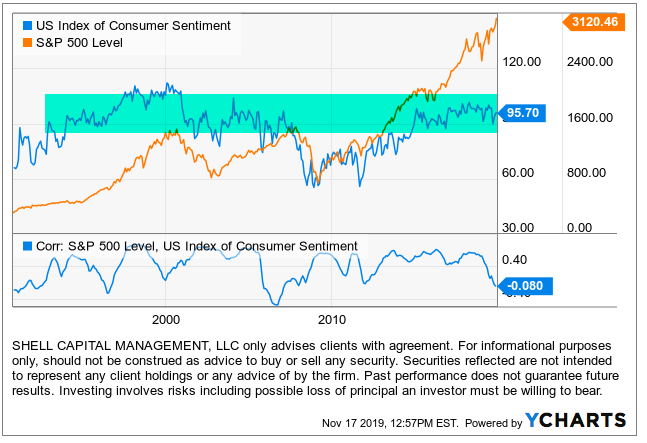


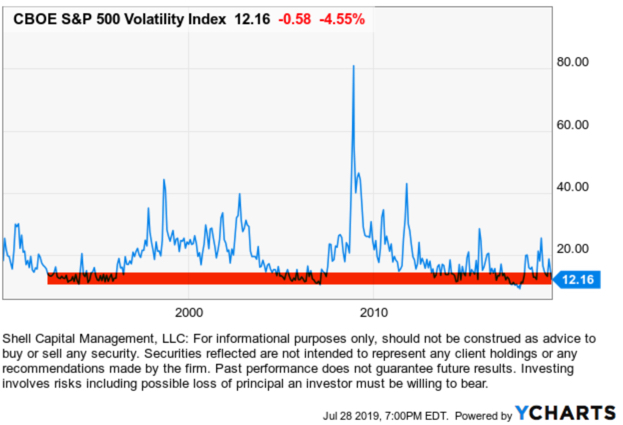
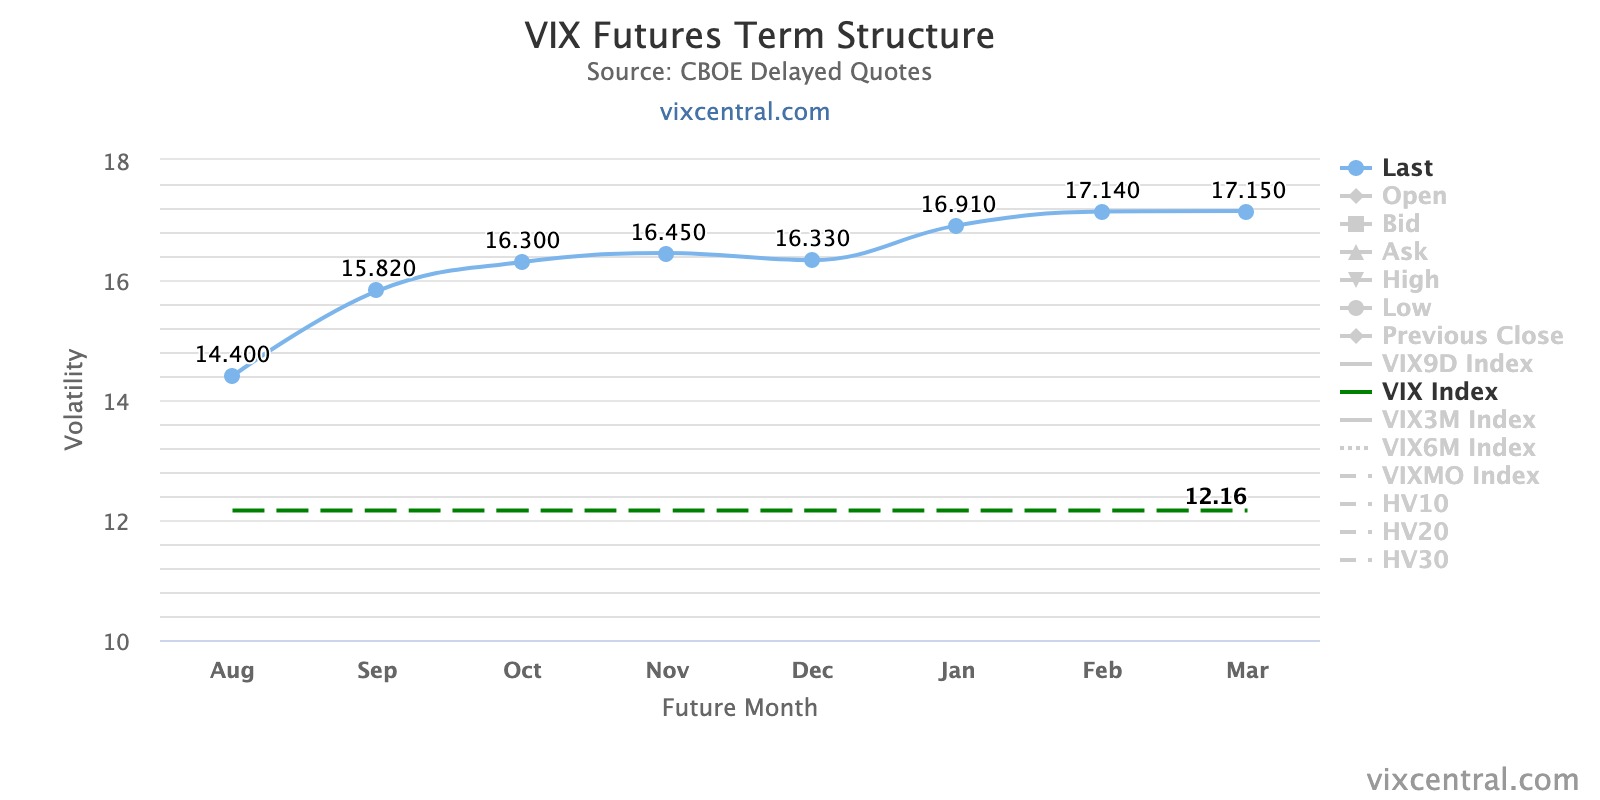
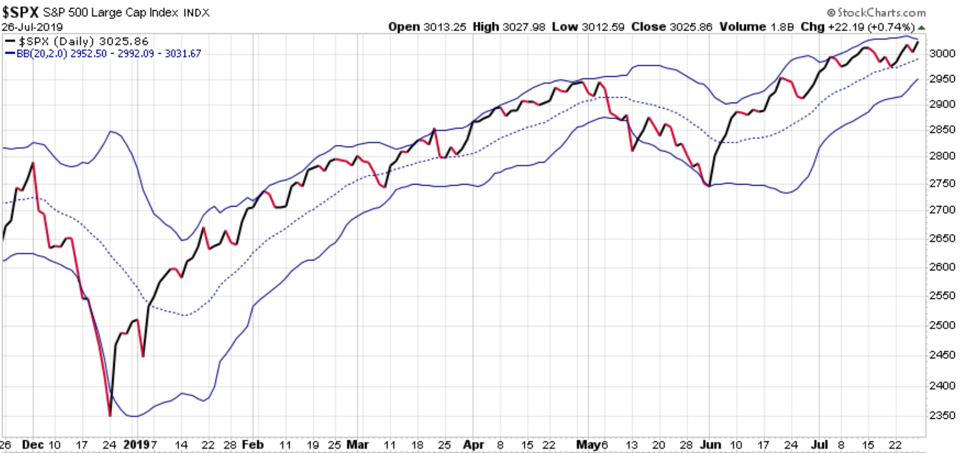
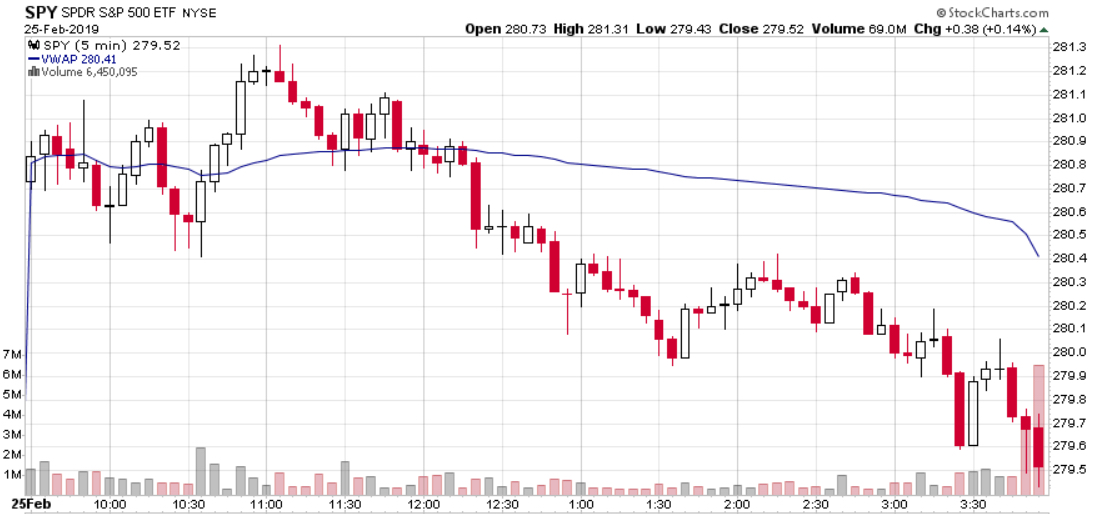
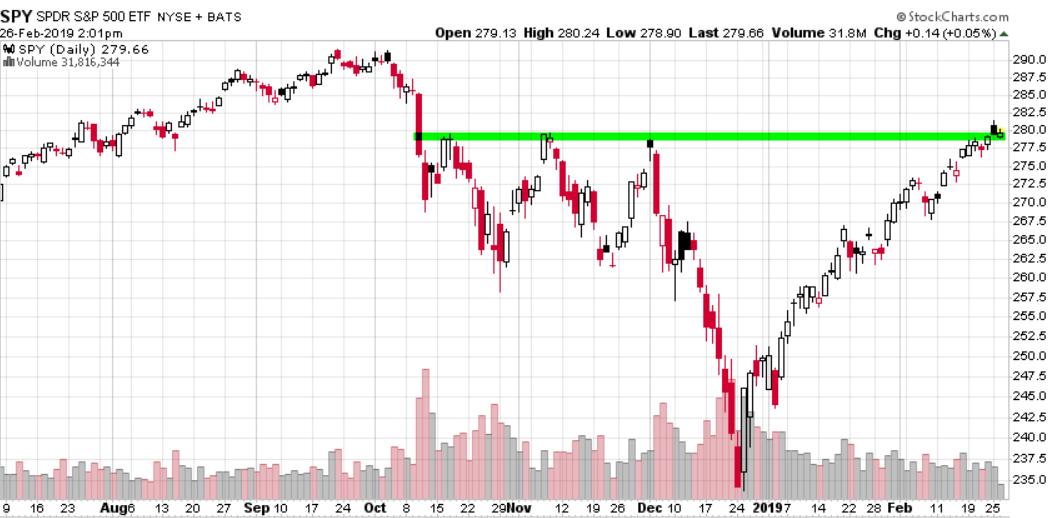
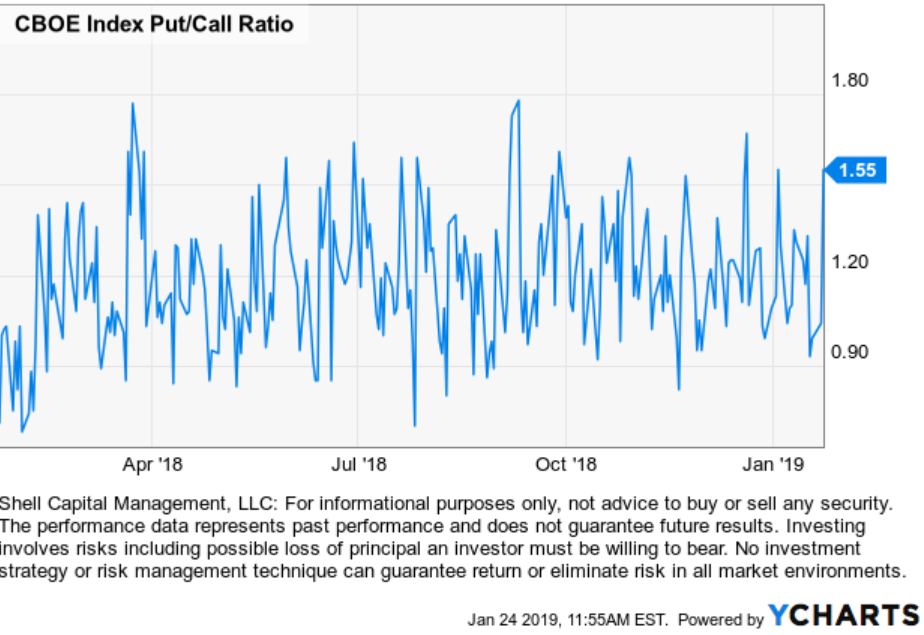
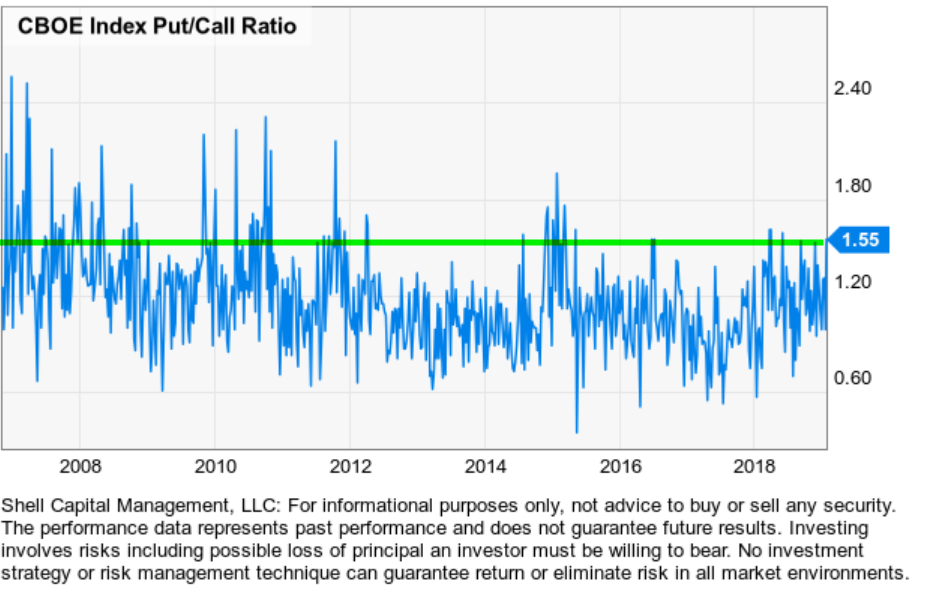
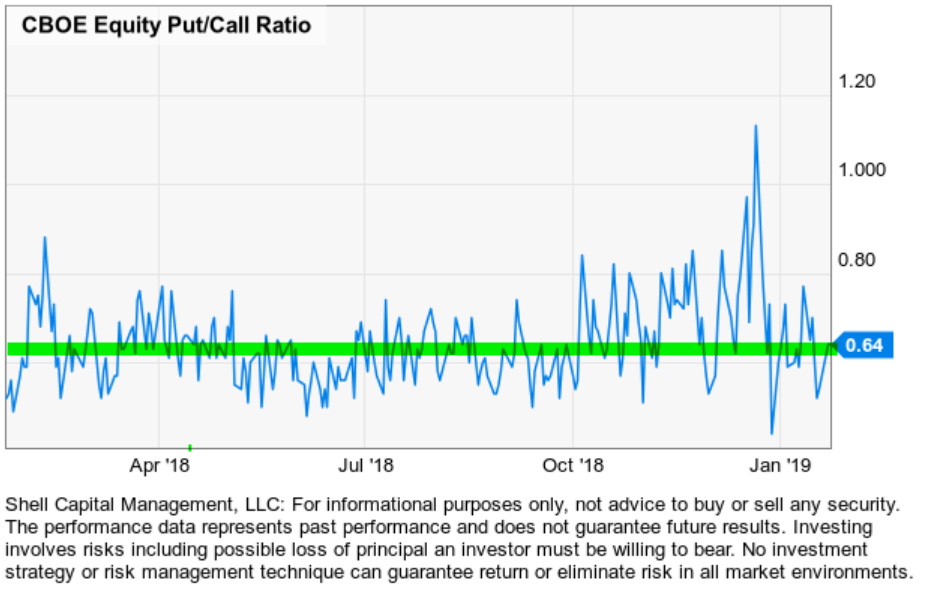
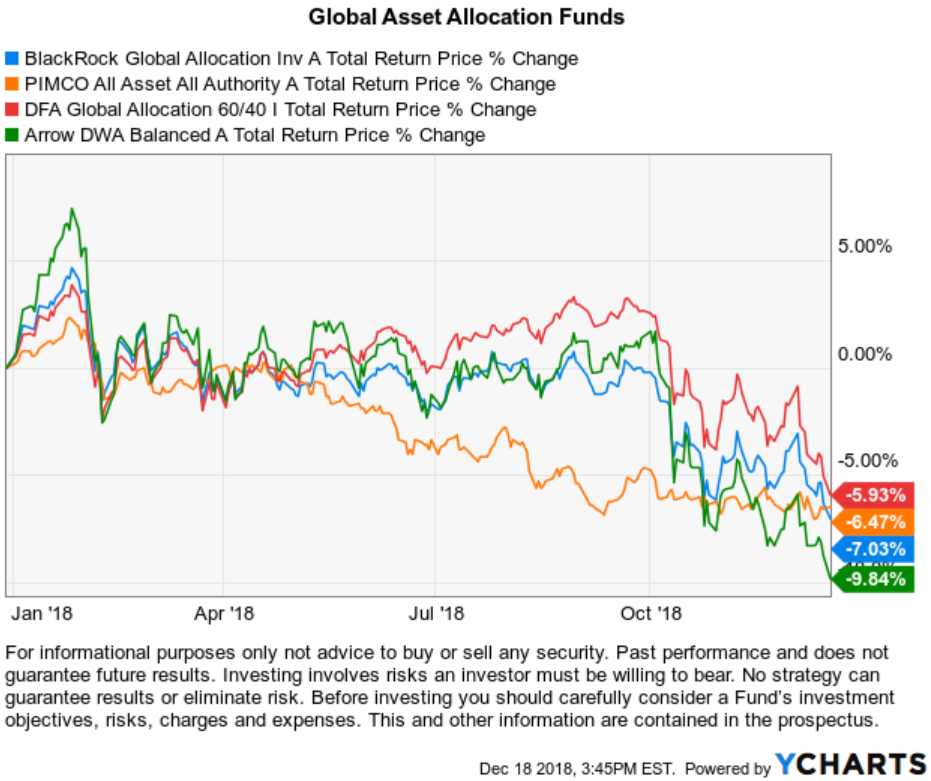
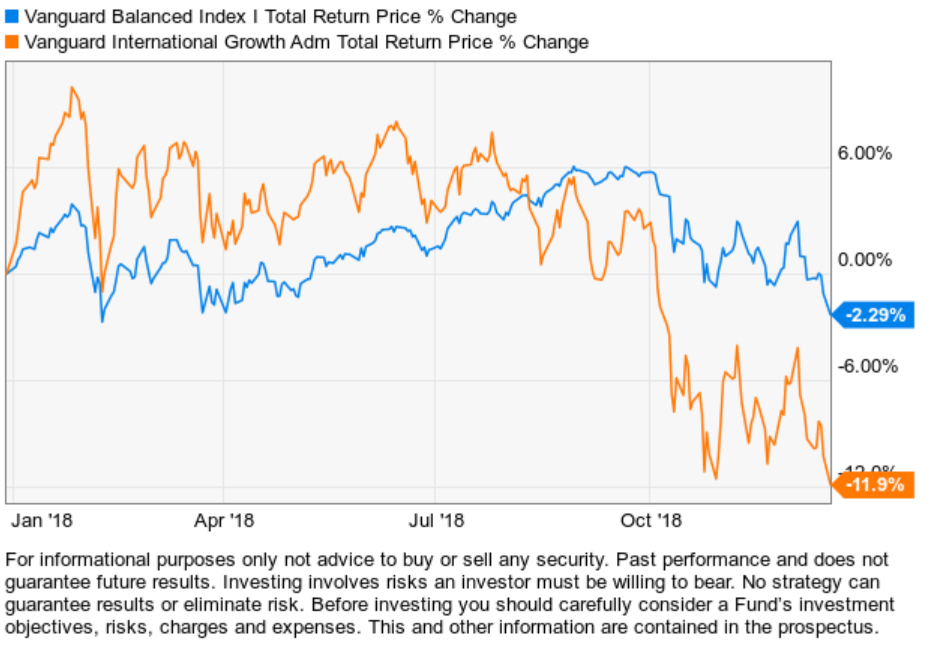
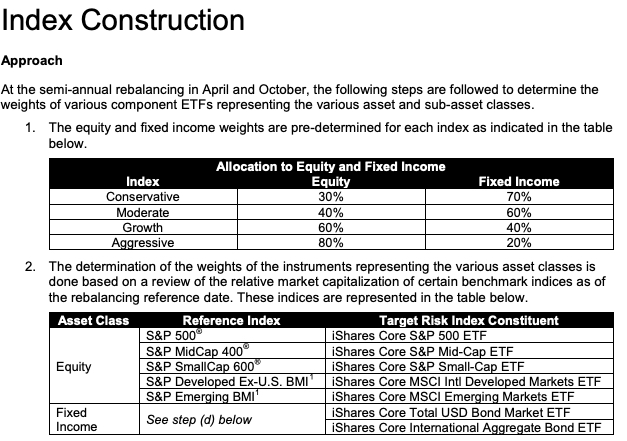
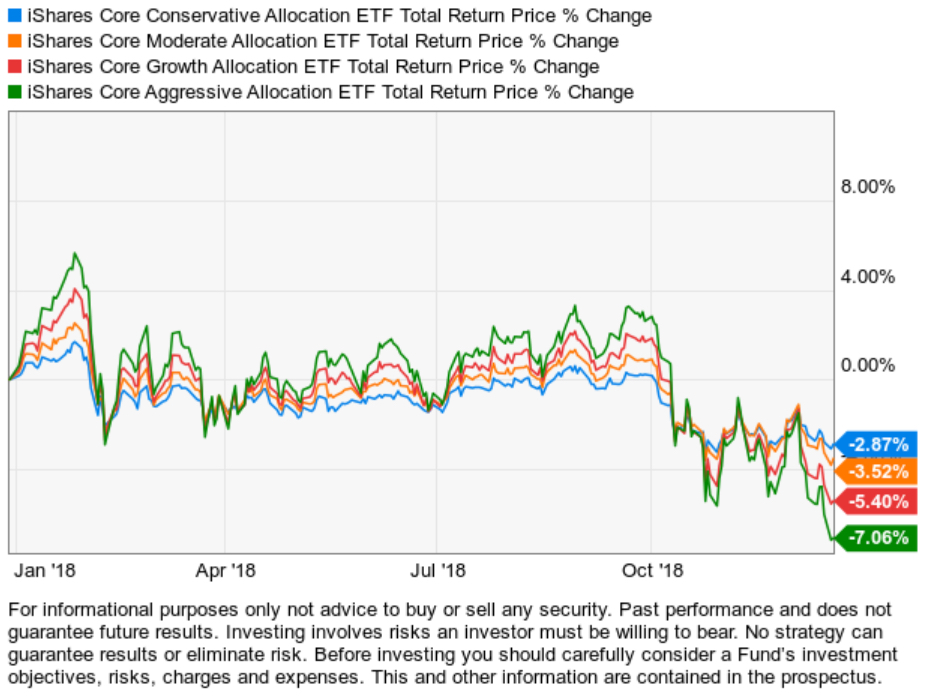
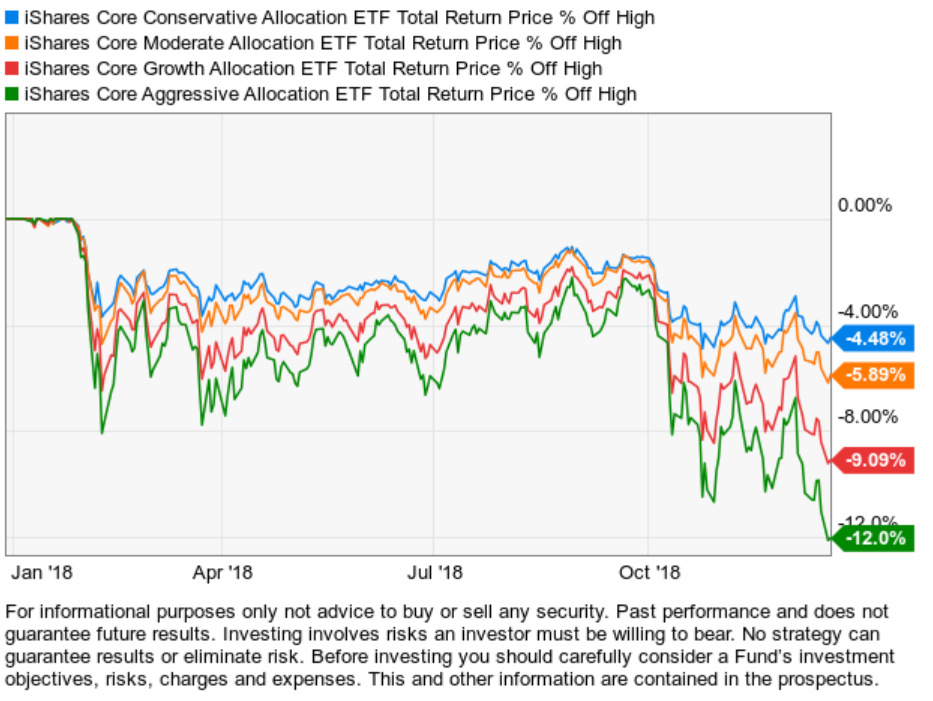
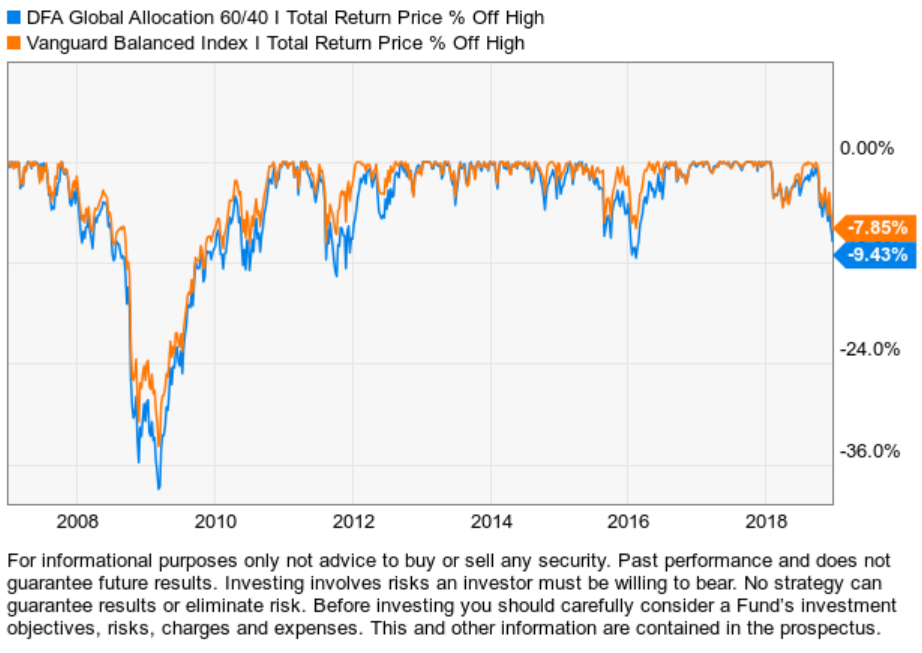
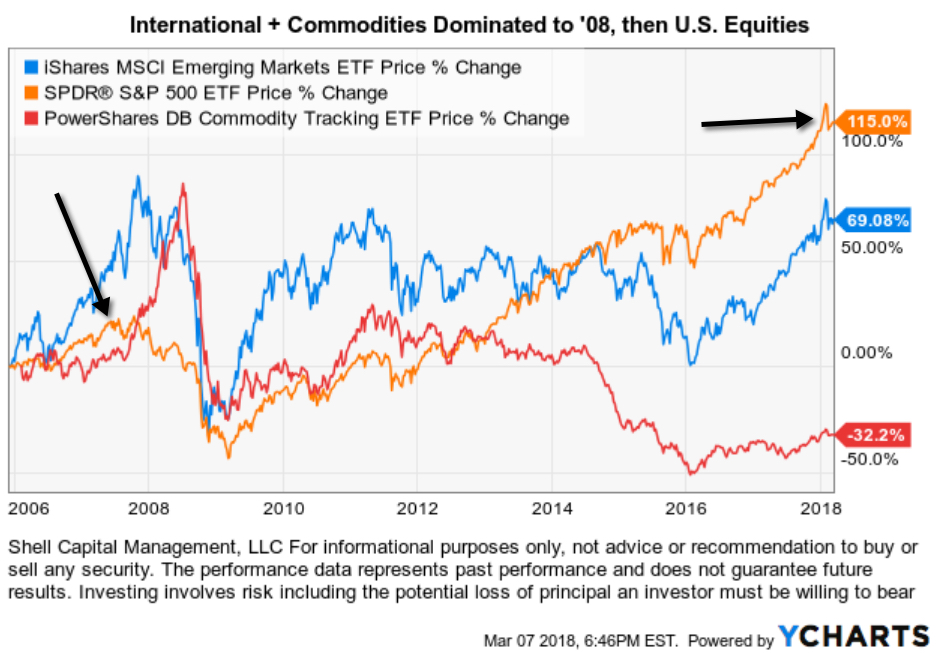
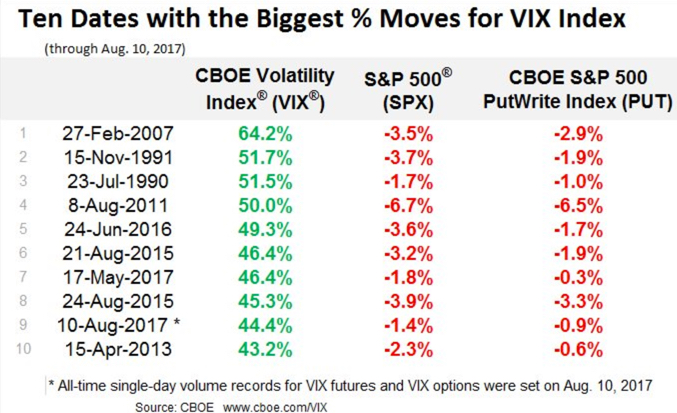
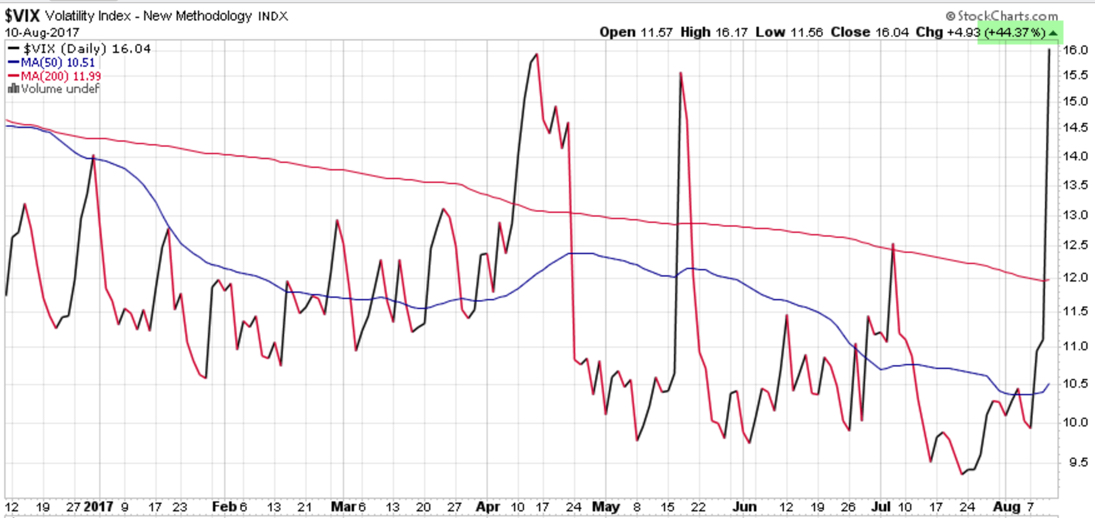
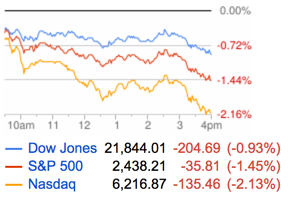
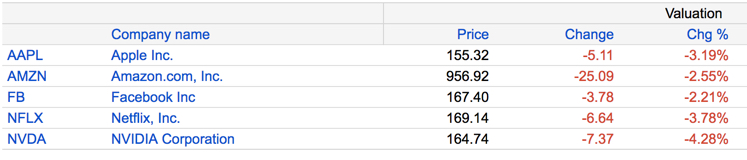 Source:


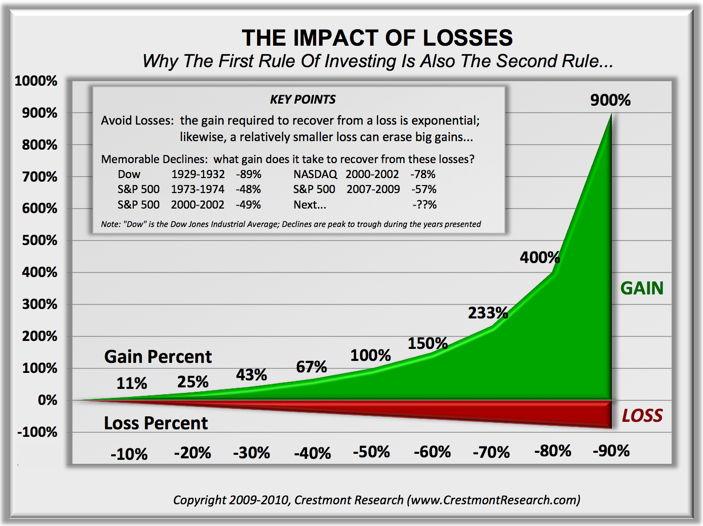

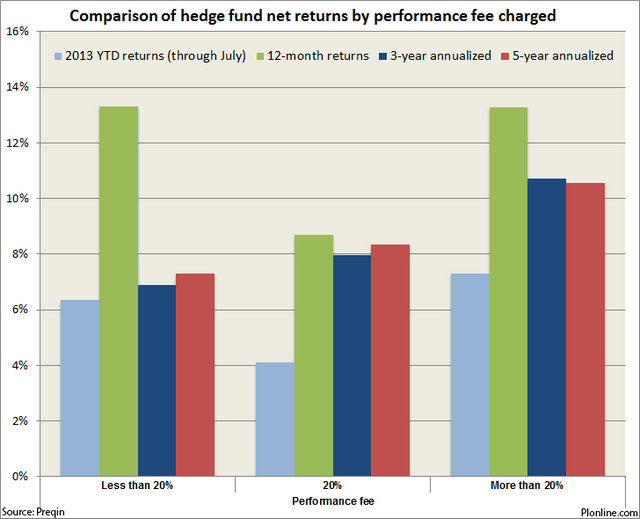


You must be logged in to post a comment.