Wondering what to expect from this starting point for stocks and bonds?
The starting point matters. From this starting point, the expected return is a calculation of earnings growth, dividend yield, and P/E ratio.
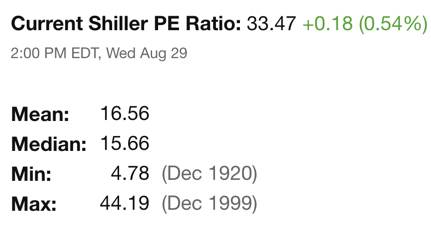
Below is the current Shiller PE Ratio for the S&P 500 stock index. The Shiller PE Ratio is the second highest level it’s ever been. It’s second only to the stock market bubble 1995-2000 and higher than Black Tuesday before the Great Depression. This measure suggests investors are highly optimistic as they have priced in high expectations about stock prices and earnings.
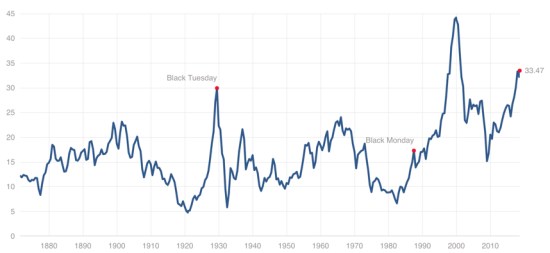
Below are the historical average (mean) and the highest and lowest level of the PE ratio of the S&P 500 based on Shiller. The median is around 15, undervalued is below 10, overvalued it above 20.
Next, we observe the 10 Year Treasury Yield. Interest rates are about as low as they’ve ever been. So, investors buying bonds and holding today are yielding about as little as they ever have. The challenge going forward is if interest rates rise, the value of current bond holdings will fall, so their price of bonds will fall. When we observe this chart, it’s a reminder of how low interest rates are and how high they could go for investors who buy and hold bonds or bond funds.
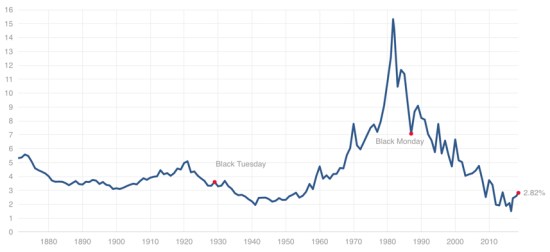
Though it is unlikley we’ll see the extremely high interest rates of the late 1970s, the current rate is 2.82% which is much lower than the 4.57% long-term average and 3.85% long-term median. The point is: interest rates could easily trend up to the 3% to 5% range which would drive the current bond values down. As bond prices fall, it will have a negative impact on fixed asset allocations to bond or bond funds.
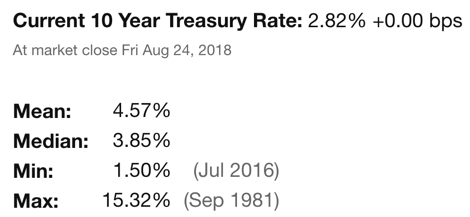
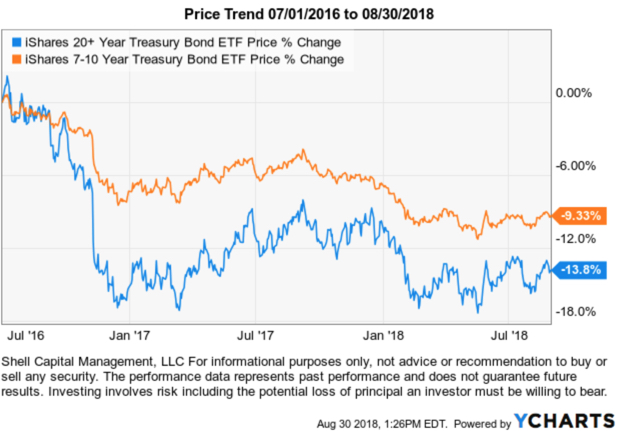
The interest rate was only 1.5% in July 2016. Since then, interest rates have already trended up to 2.82%. How has that 1.32% increase impacted the price of the bonds?
The iShares 7-10 Year Treasury Bond ETF (IEF) seeks to track the investment results of an index composed of U.S. Treasury bonds with remaining maturities between seven and ten years. If you had invested in this ETF in July 2016 at the low, it’s down -9.33%. It’s been down over -10% from it’s high.
It’s a little worse for the longer-dated bonds. The iShares 20+ Year Treasury Bond ETF seeks to track the investment results of an index composed of U.S. Treasury bonds with remaining maturities greater than twenty years. If you had invested in this ETF in July 2016 at the low, it’s down -13.8%. It has been down about -20% from its 2016 high.
From this starting point, we observe a historical extreme stock valuation levels, the second highest level, ever. Observing this high valuation level provides us situational awareness that volatility expansion and a bear market is a real possibility from these levels.
What makes for an even more challenging situation for investors is interest rates are at a historical extreme low looking back over a century. At such low interest rates, we shouldn’t be surprised to see them rise. As interest rates rise, bond prices fall. Falling bond values will have a negative impact for buy and hold investors in a fixed allocation to bonds. So, bonds may not be the crutch they are expected to provide diversified portfolios when stocks fall. Diversification does not guarantee investment returns and does not eliminate the risk of loss.
Going forward from this starting point, traditional diversification of a stock and bond portfolio is unlikely to provide the investment returns investors want.
We believe risky markets require active risk management and tactical decisions with a focus on asymmetric risk/reward. To discover what we call ASYMMETRY®, contact us.
Mike Shell is the Founder and Chief Investment Officer of Shell Capital Management, LLC, and the portfolio manager of ASYMMETRY® Global Tactical.
The observations shared on this website are for general information only and are not specific advice, research, or buy or sell recommendations for any individual. Investing involves risk including the potential loss of principal an investor must be willing to bear. Past performance is no guarantee of future results. The presence of this website on the Internet shall in no direct or indirect way raise an implication that Shell Capital Management, LLC is offering to sell or soliciting to sell advisory services to residents of any state in which the firm is not registered as an investment advisor. Use of this website is subject to its terms and conditions.

You must be logged in to post a comment.