The volatility expansion observation I shared last week has continued.
If you haven’t followed along, I suggest reading VIX level shows the market’s expectation of future volatility and Here comes the volatility expansion to see where I am coming from.
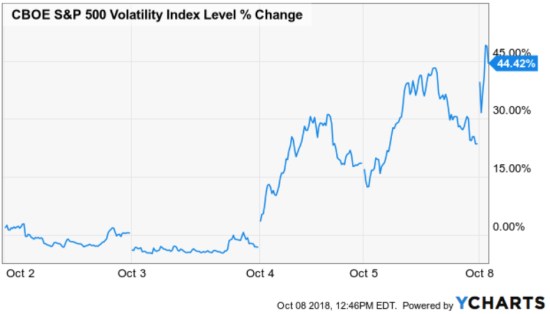
Implied volatility as measured by the CBOE Volatility Index $VIX has gained about 45% in the past three trading sessions, so volatility is expanding.
I discussed what a rising VIX and volatility expansion means in the prior observations.
Rising implied volatility means rising expectations for future volatility as implied by options prices. Ultimately, Implied volatility is determined by the price of options contracts.
In other words, implied volatility is driven by supply and demand and order flow.
An increase in options buying increases the price of options which results in higher implied volatility.
The net selling of options decreases the price of options which results in lower implied volatility.
Volatility isn’t directional.
Volatility is a measure of movement and how wide prices spread out, which says nothing about the direction of the price trend. Prices can be trending up sharply and volatility measures could expand.
Here are some examples:
Trending up with volatility expansion: a price trend that gains 10% a day for several days is a directional uptrend, but it’s also volatile. We would say the trend is up, but it’s also a volatility expansion as the price range is expanding.
Non-trending with volatility expansion: a price trend that cycles up and down around 5% a day for a long time with no clear direction up or down is a non-trending condition, but it’s also volatile. We would say it is non-trending, but it’s also a volatility expansion.
Trending down with volatility expansion: a price trend that declines 10% a day for several days is clearly a downtrend, with volatility. We could say the trend is down with expanding volatility.
Most of the time, the risk is asymmetric since we tend to see increased volatility when we see falling prices. As prices fall, more investors and traders respond to the simple fact the prices are falling and they are losing money. This serial correlation with falling prices can lead more prices falling even more as investors sell because prices are falling.
However, occasionally we may observe prices trending down with volatility contraction. A falling price trend with contracting volatility is necessarily going to be a slower downtrend with less directional movement. Instead of 5% or 10% declines, it may be 1 or 2% declines. A downtrend without volatility expansion would be observed as a slower decline that would necessarily take longer for a large loss to develop. For example, a -30% loss would happen much faster with -10% down periods than it would at a rate of -1%. You can probably see how volatility expansions in downtrends get the attention of someone who wants to manage their drawdown.
I’ll share some more detailed ways to observe volatility to decide if volatility is expanding or contracting.
At the top of the chart is the S&P 500 stock index. The bands around the stock index are 2 times the stock index average true range over the past 20 days. The dotted line in the center of the bands is the 10-day moving average. Price trends move in cycles, so they oscillate up and down over time. When we apply bands around the price trend is gives us a visual representation of a “normal” range of prices around the trend. We observe the price trend tends to oscillate or cycle up and down within certain parameters – the range. When this range spreads out, I call it volatility expansion. When the range contracts, it’s volatility contraction. Volatility itself also tends to cycle between expansion and contraction. We can see that here.
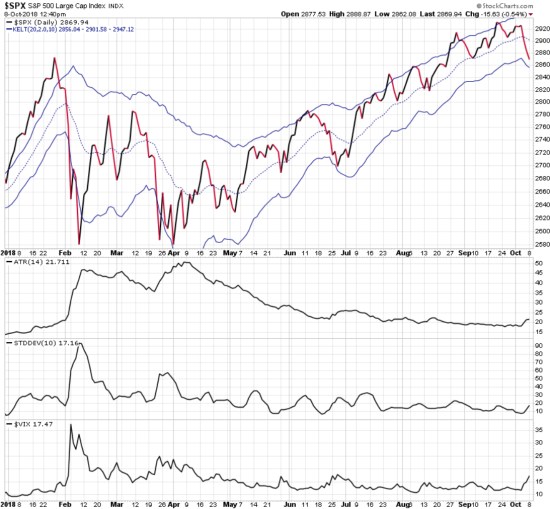
Below the price trend chart with bands of the average true range (ATR) I included a chart of ATR, standard deviation, and the VIX. Both standard deviation and average true range are actual, historical, and realized volatility. These indicators are measuring how the price of the index has actually expanded or contracted. As I pointed out before, the VIX is a measure of options prices on the stocks in this index, so it’s driven by expectations of future volatility over the next 30 days determined by the price of options. ATR and standard deviation are the actual range of movement of the index.
I started with the year-to-date time frame to show how the price trend spread out as it started swinging up and down at the beginning of the year and has since trended up with lower volatility; smaller cycles, smaller swings.
Just as we observe market price trends tend to cycle and swing up and down over time, so does volatility. p
- Price trends may reach an extremely high or low point, then reverse in the other direction.
- Volatility may reach an extremely high or low point, then reverse in the other direction.
When we see volatility reach an extreme low/high point, we can expect to see it drift the other way eventually. Investors and traders who only believe trends in price and volatility only go one way are those who get surprised and caught in a loss trap.
Now, let’s zoom in for a closer look with just a three-month time frame to observe what has been going on more recently.
I highlighted in green the recent volatility expansion I pointed out last week. Notice the forward-looking VIX index at the bottom turned up sharper and has trended up higher than its last cycle high last month. However, realized historical volatility as measured by standard deviation and the average true range of index prices has also trended up, but on a lag relative to the forward-looking VIX.
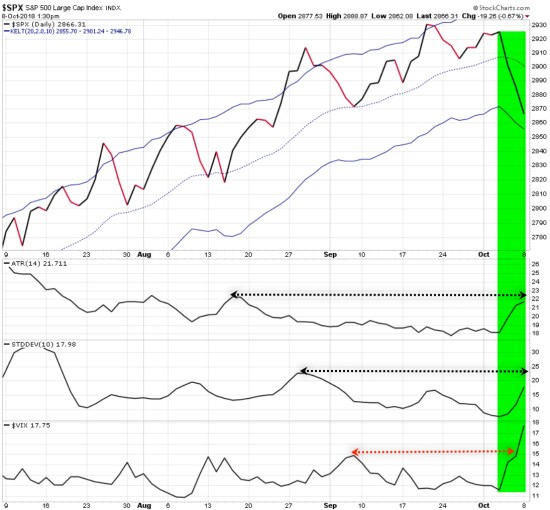
So, you can probably see why I’m calling it a volatility expansion. It is drifting up, though it could certainly trend up a lot more, or it could reverse back down. For now, the rising prices in options suggest there is demand for protection and it is probably in response to something the market believes may lead to increase risk or volatility. It could be something seasonal like earnings season or it could be as simple as the month of October is historically one of the most volatile months.
Speaking of October…
October is a typical month to see hurricanes in the Gulf and Atlantic, too. Right now, we have Michael (no relation) coming up through the Gulf of Mexico. As of this morning, Michael was just a named storm, but its expected to expand into a Category 2 or 3 hurricane by the time it reaches the Florida panhandle to our favorite places like Sandestin, Miramar Beach, Destin, and the 30A area like Rosemary Beach and Alys Beach. The intensity, speed, and how wide the storm spreads out to reach higher categories is a lot like volatility expansion in market price trends. Most people prefer to experience calm and quiet. We would prefer to see the storm contract and slow down its speed.
Although the tropical storm monitors have ways of measuring the probability of speed, expansion, etc. we are always dealing with the certainty of uncertainty. Hurricanes can shift and drift in different directions, speed up or slow down, and expand or contract. How we respond is a matter of situational awareness of measuring the cone of uncertainty as best we can. Some of us do it better than others. Some of us prepare more timely and respond better than others.
Right now we have some volatility expansion and we are positioned as such. The implied volatility index suggests the market believes we’ll see some price swings (up and down) this month.
We’ll see how it all plays out.
Semper Gumby (Always Flexible).
Let’s hope Michael doesn’t give me a bad name.
Mike Shell is the Founder and Chief Investment Officer of Shell Capital Management, LLC, and the portfolio manager of ASYMMETRY® Global Tactical.
You can follow ASYMMETRY® Observations by click on on “Get Updates by Email” on the top right or follow us on Twitter.
The observations shared in this material are for general information only and are not intended to provide specific advice or recommendations for any individual. Investing involves risk including the potential loss of principal an investor must be willing to bear. Past performance is no guarantee of future results.

You must be logged in to post a comment.