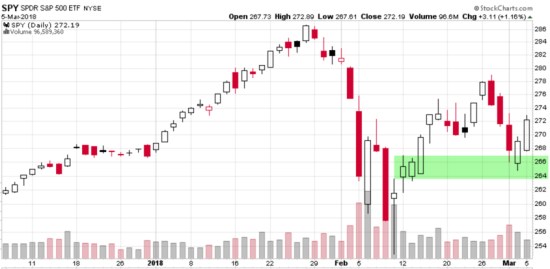
Past performance is no guarantee of future results and that was the case today. After last weeks Selling pressure overwhelms buying demand for stocks for the third day in a row the enthusiasm to buy overwhelmed the desire to sell. Market prices are driven by simple Economics 101: when buying enthusiasm overwhelms sellers, prices rise. The S&P 500 gained 1.16% today and seems to have found some buying interest at the prior range I highlighted in green.
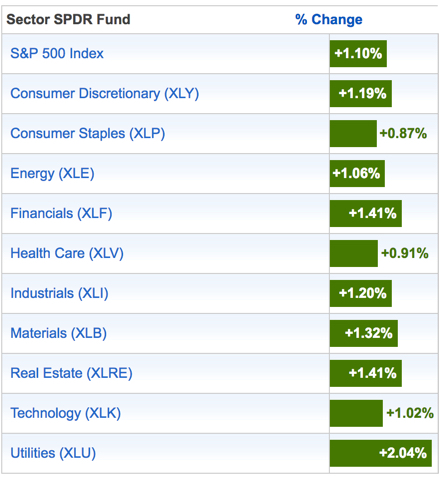
Sector breadth was strong with Utilities, Real Estate, and Financials leading the way.
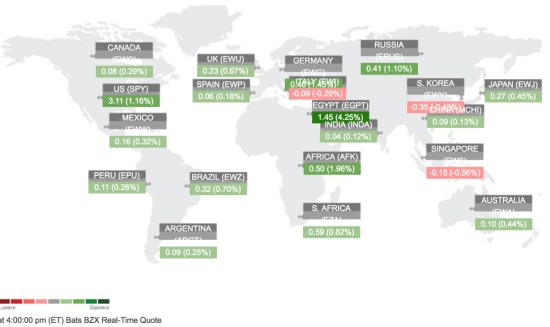
We don’t just invest and trade in U.S. stocks and sectors, I look for trends globally across the world. Though the Global ETF Trends monitor below shows many international countries were in the green, the good ole USA was one of the biggest gainers today.
Back to the U.S. stock market, in the chart below, I added Kelner Channels to illustrate a few things.
Keltner Channels are volatility-based envelopes set above and below an exponential moving average. This indicator is similar to Bollinger Bands, which use the standard deviation to set the bands. Instead of using the standard deviation, Keltner Channels use the Average True Range (ATR) to set channel distance.
Kelner Channels show the range of volatility has spread out and got wider since the stock market price trend trended above the upper channel in January, suggesting its uptrend was abnormal. Since then, the trend reversed down and again traded outside the range of the Kelner Channel on the downside. It’s a good example of how the market can overreact on both the upside and downside.
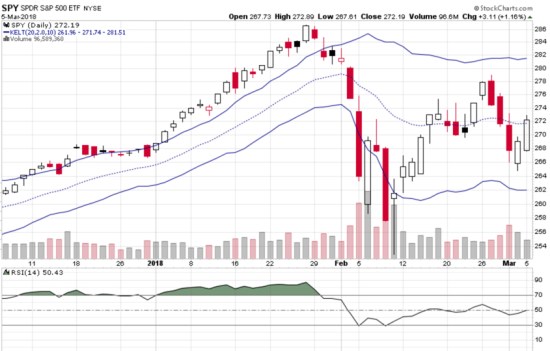
In the chart above, I also include the Relative Strength Index, which is on its 50-yard line. You can see how it was reading “overbought” in January (and had been for months), then after that extreme it became oversold. This kind of price action presented us with an opportunity to turn on the swing trading systems. My countertrend systems signaled short-term entries in several stocks and ETFs very near the low prices.
I pointed out in Stock Market Analysis of the S&P 500 on February 9th near the lows the breadth of the stock market was oversold at a lower risk. Market analysis is best used as a weight of the evidence. You can probably see how these different indicators signaled a countertrend move was possible and this time that has happened so far. I say this time because it’s always probabilistic, never a sure thing. If the stock market were going to trend down -50% over a two year period it would start off this way being “oversold” and look “washed out”, only to get worse as it swings up and down on it’s way to a lower low. During times like this, a skilled swing trader or countertrend systems can help to generate profits as price trends swing up and down.
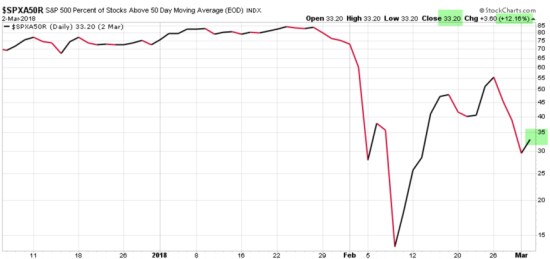
Below is an updated chart of the percent of stocks in the S&P 500 that are trading above their 50-day moving average. 12% more stocks are trading above their 50-day moving average after today, bringing it to 32%. I point this out because it gives us an idea of how many stocks are still left to trend back up. That is, based on this breadth indicator, there is room for stocks to keep trending up if buyers continue their enthusiasm. This is the opposite of the condition in the last months of 2017 and January when 80% or more stocks were already in positive trends. To revisit this concept I encourage you to read Stock Market Analysis of the S&P 500.
The bottom line is, the supply and demand for the stock market seems to be shifting back in control of buyers for now. Only time will tell if it continues in the days and weeks ahead. This is just a quick market analysis to look at what is going on, not investment advice. Our investment management and advice are only offered through an investment management agreement. If you want investment management or advice, contact us.
Mike Shell is the Founder and Chief Investment Officer of Shell Capital Management, LLC, and the portfolio manager of ASYMMETRY® Global Tactical.
You can follow ASYMMETRY® Observations by click on on “Get Updates by Email” on the top right or follow us on Twitter.
Investment results are probabilistic, never a sure thing. Past performance is no guarantee of future results.

Pingback: Stock pickers market? Sector rotation with stocks for asymmetric reward to risk « ASYMMETRY® Observations