Investing in stocks involves risks you must be willing to bear, or actively manage and hedge

It is widely accepted that a portfolio diversified across a number of stocks will provide an inherent return over time, that buying and holding stocks for the long term is virtuous and pragmatic, and that the longer your perspective, the lower your investment risk.

This strategy is flawed because it is based on a single set of baseline conditions and return drivers, and there is no guarantee that the future will not deviate significantly from the past.

In fact, “past performance is no guarantee of future results” is a required regulatory statement for registered investment advisors like my firm.

Year to date the widely followed S&P 500 stock index that tracks 500 stocks, fully invested, all the time, is down -25% for 2022.

In the chart, we show the index is about 9% below its 50-day average and 14% below the 200-day average. These simple trend-following indicators have signaled defense most of the year, and you can see the red when they’re underwater.

Though it’s oversold on a short-term basis and could see some countertrend follow-through from yesterday’s radical swing, the primary trend is clearly down. So, we declined to participate in its descent like a passive investor does.

Investments and markets require active risk management to avoid larger losses and to create the positive risk-adjusted investment returns people want.

Active risk management and hedging aren’t a sure thing, either, but for me, it’s far better than just sitting there doing nothing.

You can probably see why I’ve preached active risk management and dynamic hedging for drawdown control for over two decades.

More importantly, I’ve done it.

Investing involves risks of loss you must be willing to bear, or actively manage and hedge.

All our endeavors involve some degree of risk, but we all get to tactically decide which risks we want, and which we prefer to hedge off.

Check out our new website, which is a work in progress. We’ll eventually transfer these observations to the new site. https://shell-capital.com/

Mike Shell is the Founder and Chief Investment Officer of Shell Capital Management, LLC, and the portfolio manager of ASYMMETRY® Managed PortfoliosMike Shell and Shell Capital Management, LLC is a registered investment advisor focused on asymmetric risk-reward and absolute return strategies and provides investment advice and portfolio management only to clients with a signed and executed investment management agreement. The observations shared on this website are for general information only and should not be construed as investment advice to buy or sell any security. This information does not suggest in any way that any graph, chart, or formula offered can solely guide an investor as to which securities to buy or sell, or when to buy or sell them. Securities reflected are not intended to represent any client holdings or recommendations made by the firm. In the event any past specific recommendations are referred to inadvertently, a list of all recommendations made by the company within at least the prior one-year period may be furnished upon request. It should not be assumed that recommendations made in the future will be profitable or will equal the performance of the securities on the listAny opinions expressed may change as subsequent conditions change. Please do not make any investment decisions based on such information, as it is not advice and is subject to change without notice. Investing involves risk, including the potential loss of principal an investor must be willing to bear. Past performance is no guarantee of future results. All information and data are deemed reliable but are not guaranteed and should be independently verified. The presence of this website on the Internet shall in no direct or indirect way raise an implication that Shell Capital Management, LLC is offering to sell or soliciting to sell advisory services to residents of any state in which the firm is not registered as an investment advisor. The views and opinions expressed in ASYMMETRY® Observations are those of the authors and do not necessarily reflect the position of Shell Capital Management, LLC. The use of this website is subject to its terms and conditions.

Observations of the Stock Market Trend, Bond Market, and Investor Sentiment

Nothing drives investor sentiment like a strong price trend.

The S&P 500 stock index is down over -20% this year, and it was down -24% YTD just two weeks ago.

The stock index peaked at the end of last year and is down about -13% over the past 12 months.

But that’s not all.

This time it’s different.

I’ve been warning here for years all the Fed intervention would eventually have to stop, and it would also drive down bond prices, too.

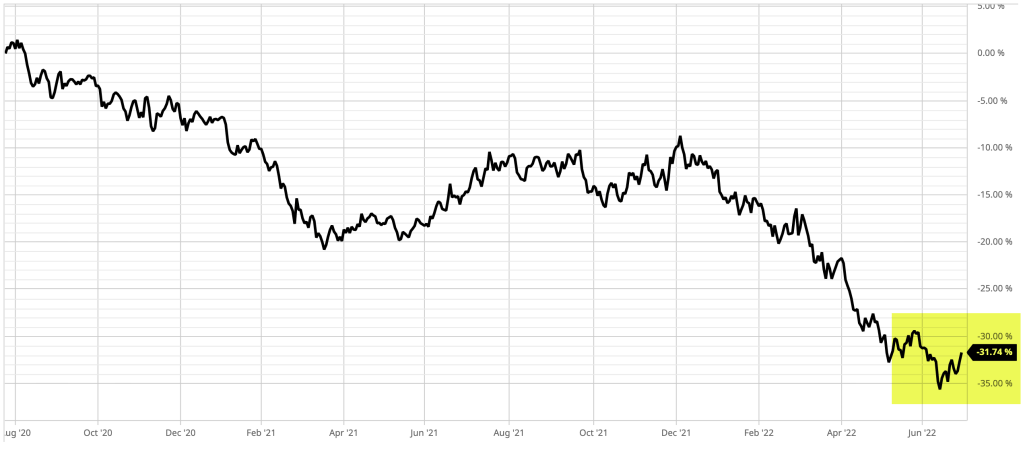
The ICE US Treasury 20+ Year Index is down -23% this year, so long-term U.S. Treasury bonds are down even more than the stock index.

The ICE US Treasury 20+ Year Index peaked July 27, 2020, and has since declined by -32%, far more than stocks.

As warned, bonds are no longer a crutch for declining stocks.

Bonds have been worse.

The Federal Reserve FOMC and U.S. Treasury are no longer accommodating higher stock and bond prices, or applying the “Fed Put” as we call it.

Since 2008, the Feds have stepped in to support the economy and the markets by providing unpreceded liquidity, which has eased selling pressure in waterfall declines and made the market more optimistic.

Fed intervention has resulted in a windfall for stock and bond investors since.

You can no longer rely on the Fed to step in to support market prices.

The challenge today is we’ve never seen the Fed provide such support for stocks and bonds as it has post-2008, so the windfall stock/bond investors have received has now come due.

I had been warning of it:

It’s eventually going to be payback time for the windfall stock market investors have received over the last decade – if you don’t actively manage risk for drawdown control.

Stocks had reached the second-highest most expensive valuation in 140 years, and as you can see in the above chart, and stayed there for the last decade.

High valuations could previously be justified by low inflation, but clearly, that’s no longer the case.

Nothing drives investor sentiment like a strong price trend.

As prices are trending up, investors and traders get more and more bullish, optimistic, and confident.

As prices fall into downtrends, investors and traders get more and more bearish, pessimistic, unsure, doubtful, and outright scared.

Although we tilt more optimistic or pessimistic as a personality trait, by and large investor behavior changes more in downtrends than uptrends.

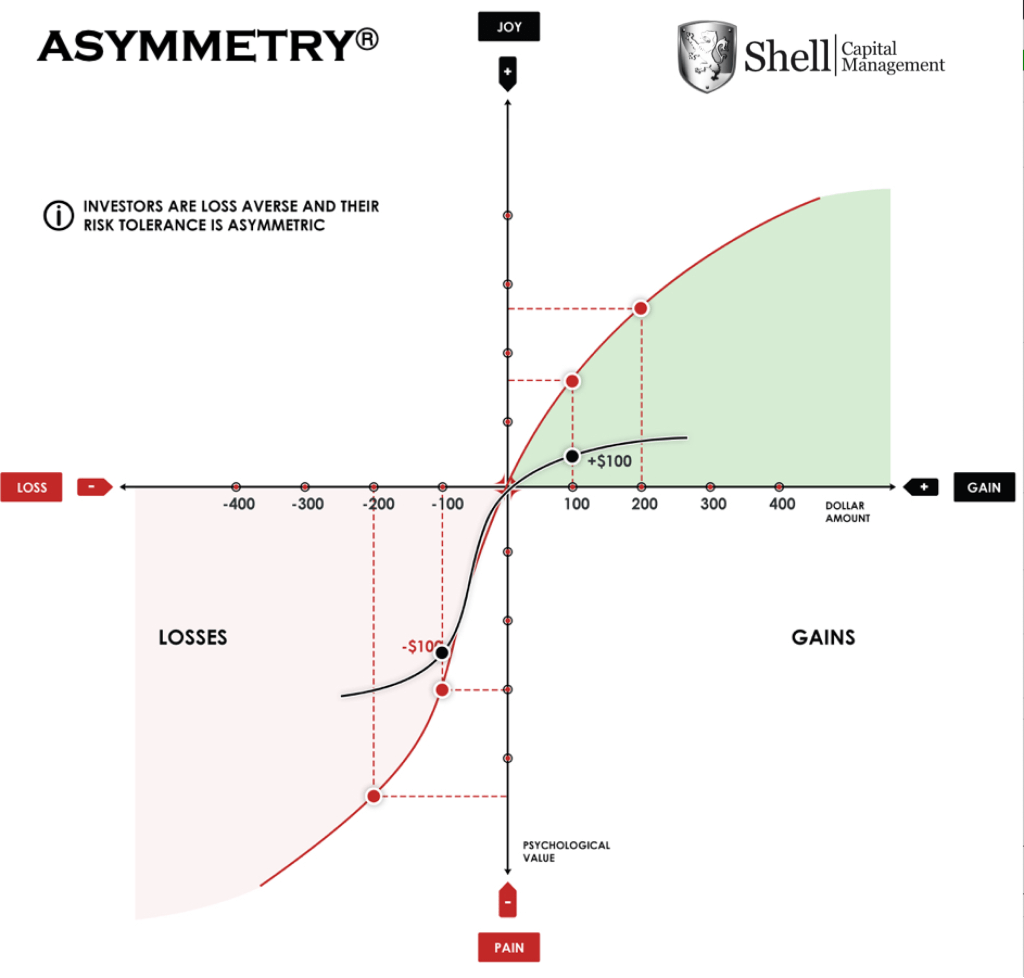
The prospect theory says that investors value gains and losses differently, placing more weight on perceived gains versus perceived losses.

Prospect theory is also known as the loss-aversion theory.

With Prospect Theory, the work for which Daniel Kahneman won the Nobel Prize, he proposed a change to the way we think about decisions when facing risk, especially financial. Alongside Tversky, they found that people aren’t first and the optimal utility maximizes, but instead react to changes in terms of gains and losses.

In short, Prospect Theory suggests investors are loss-averse, so our risk reward preferences are asymmetric.

We prefer asymmetric investment returns; we want more of the upside, and less of the downside.

Clearly, want can’t receive asymmetric investment returns from just buying and holding risky markets, bonds included.

I believe asymmetric investment returns are pursued by our focus on asymmetric payoffs and positive mathematical expectation over many trades.

ASYMMETRY® is about more upside than downside, an average, over a period of many buys and sells.

ASYMMETRY® is about producing higher average gains than losses, or a positive expectancy.

Back to investor sentiment.

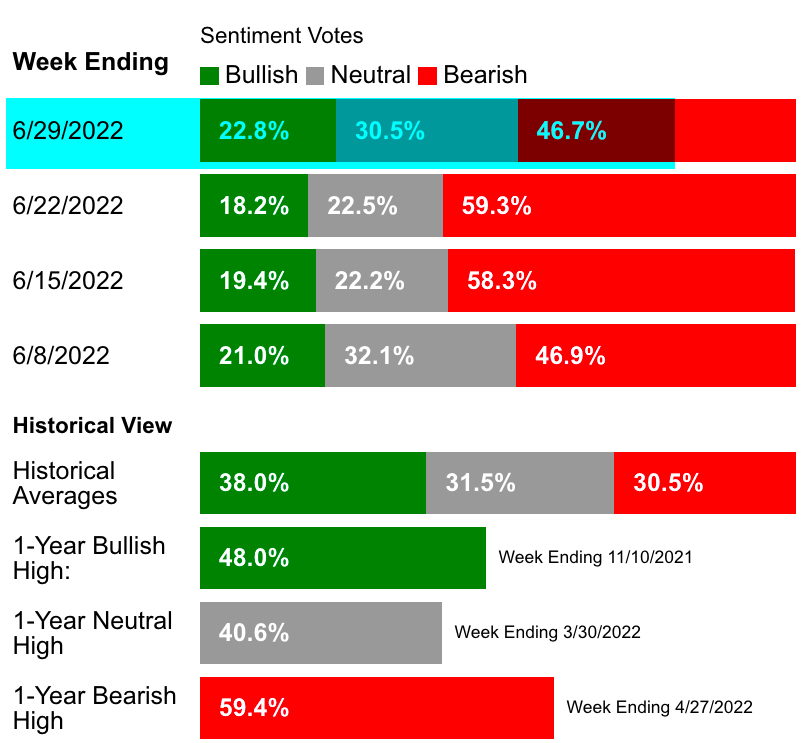
AAII Investor Sentiment remains very asymmetric, though it has shifted more neutral, it remains BEARISH.

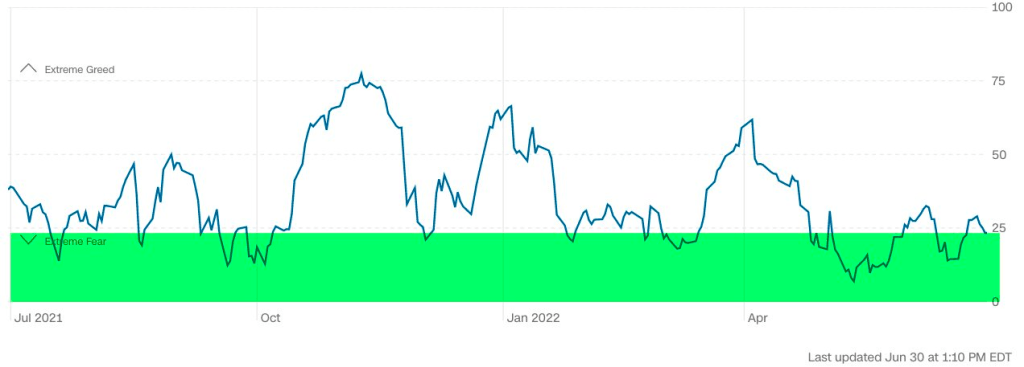
The Fear & Greed IndexFear & Greed Index, which is driven by 7 market indicators instead of a sentiment survey, remains in the EXTREME FEAR zone.

EXTREME levels of FEAR or GREED are usually a contrary indicator, but in a prolonged bear market, bearish sentiment is like a pressure cooker.

Investors who hold their losses too long get caught in a LOSS TRAP.

A loss trap is like the Chinese Finger Pull game.

The harder you pull, the tighter the loss trap.

It’s why I predefined my risk in advance, to cut losses short rather than allow losses to grow large and larger.

The LOSS TRAP is not fun, and can be very costly.

Don’t let smaller losses become larger and larger losses, or you’ll be caught in the trap, and the harder you resist, the tighter it gets.

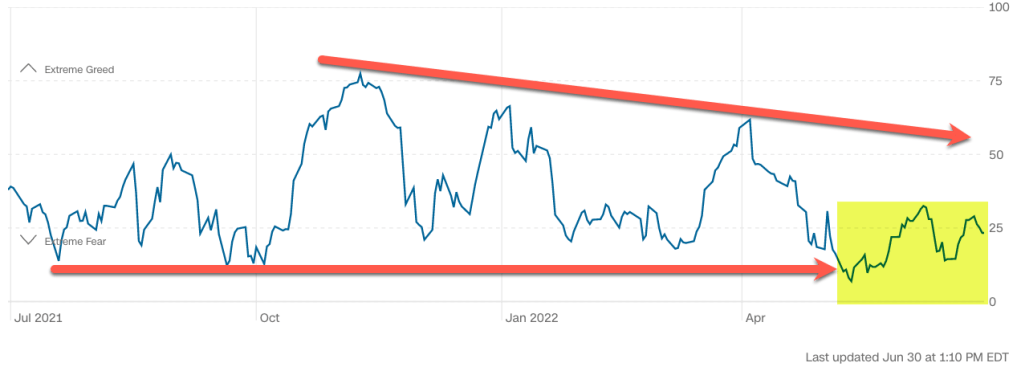
The Fear & Greed Index peaked on November 9th and has since printed lower highs and lower lows; a downtrend.

At this point, the prolonged trend in investor fear suggests this may be the early stages of a prolonged bear market, so govern yourself accordingly.

It’s why I tactically trade market trends.

It’s why I actively manage my risk in each position and across the entire portfolio for drawdown control.

The windfall buy-and-hold passive investors have received from the U.S. stock market from Fed action is due for payback.

Our ASYMMETRY Managed Portfolio has been positive for the year.

Though past performance is never a guarantee of future results, this is when I’ve historically revealed an edge.

When the wind is blowing, we can cast the sail ride and enjoy the ride.

But when the wind stops blowing, we have to get out the oars or risk sinking.

At Shell Capital, we row, not sail.

We are here to help if you need it, contact us.

We are a fiduciary money manager fully committed to guiding our clients.

Mike Shell is the Founder and Chief Investment Officer of Shell Capital Management, LLC, and the portfolio manager of ASYMMETRY® Managed PortfoliosMike Shell and Shell Capital Management, LLC is a registered investment advisor focused on asymmetric risk-reward and absolute return strategies and provides investment advice and portfolio management only to clients with a signed and executed investment management agreement. The observations shared on this website are for general information only and should not be construed as investment advice to buy or sell any security. This information does not suggest in any way that any graph, chart, or formula offered can solely guide an investor as to which securities to buy or sell, or when to buy or sell them. Securities reflected are not intended to represent any client holdings or recommendations made by the firm. In the event any past specific recommendations are referred to inadvertently, a list of all recommendations made by the company within at least the prior one-year period may be furnished upon request. It should not be assumed that recommendations made in the future will be profitable or will equal the performance of the securities on the listAny opinions expressed may change as subsequent conditions change. Please do not make any investment decisions based on such information, as it is not advice and is subject to change without notice. Investing involves risk, including the potential loss of principal an investor must be willing to bear. Past performance is no guarantee of future results. All information and data are deemed reliable but are not guaranteed and should be independently verified. The presence of this website on the Internet shall in no direct or indirect way raise an implication that Shell Capital Management, LLC is offering to sell or soliciting to sell advisory services to residents of any state in which the firm is not registered as an investment advisor. The views and opinions expressed in ASYMMETRY® Observations are those of the authors and do not necessarily reflect the position of Shell Capital Management, LLC. The use of this website is subject to its terms and conditions.

How We’ll Know if a Recession is Imminent

Recessions are officially announced long after they begin.

It usually takes nine to twelve months before the National Bureau of Economic Research (NBER) to announce when a recession started.

For example, on June 8, 2020, the National Bureau of Economic Research announced the U.S. economy was officially in a recession. The COVID lockdown-driven recession was so obvious NBER’s Business Cycle Dating Committee didn’t need the typical time frame to decide.

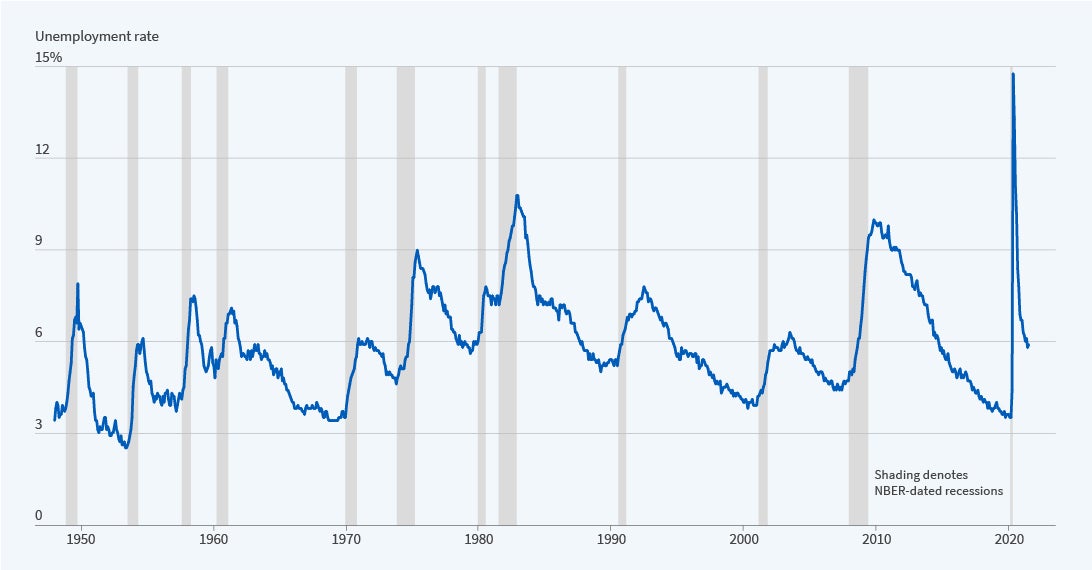
Here’s the Unemployment Rate with NBER-dated recessions in gray, for an example of business cycle dating.

recessions figure 071921.jpg
Unemployment rate. NBER-dated recessions in gray. Source: Bureau of Labor Statistics via the Federal Reserve Bank of St. Louis.

Who is the National Bureau of Economic Research and its Business Cycle Dating Committee?

The NBER’s Business Cycle Dating Committee maintains a chronology of US business cycles. The chronology identifies the dates of peaks and troughs that frame economic recessions and expansions. A recession is the period between a peak of economic activity and its subsequent trough, or lowest point. Between trough and peak, the economy is in an expansion. Expansion is the normal state of the economy; most recessions are brief. However, the time that it takes for the economy to return to its previous peak level of activity or its previous trend path may be quite extended.

According to the NBER chronology, the most recent peak occurred in February 2020. The most recent trough occurred in April 2020.

That was quick!

But the NBER’s Business Cycle Dating Committee maintains a chronology of US business cycles in the past, which tells us nothing about here, now.

I follow the 10-2 Treasury Yield Spread as an early warning signal of an imminent recession.

The 10-2 Treasury Yield Spread is the difference between the 10 year treasury rate and the 2 year treasury rate. This yield spread is commonly used as the main indicator of the steepness of the yield curve.

A yield curve is a visual representation of yields (interest rates) on U. S. Treasury bonds across a range of different maturities. In normal circumstances, the shape of the trend is upward; short-term rates are lower than long-term rates. It makes sense because if we are investing in bonds to earn interest, we should expect a higher rate for investing for a longer period. Another reason is a risk premium longer-term bonds as longer term durations are exposed to a greater probability interest rates will change over its remaining duration, causing the price to fluctuate.

If you invest in a bond that doesn’t mature for 10 or 20 years and rates of new bonds being issued increase, as they are now, the price of the bonds you hold will decline in price so their yield matches about what the market is paying now. This is a risk for bond holders in a rising interest rate environment as we are in now, driving by rising inflation.

As the 10-2 Treasury spread approaches zero it signals a “flattening” of the yield curve. Here is the spread today, and it’s history over the past few decades. I shaded in gray the historical recessions to see how the 10-2 Treasury spread preceded historical recessions several months in advance. I also highlighted the area below zero where the signal occurs as the yield curve is flat. Right now, because short term interest rates are trending up driven by the U. S. Federal Reserve, the yield curve is trending toward flattening.

Only time will tell if the yield curve goes flat, where the short term (2 year) rate is the same as the longer term (10 year) yield, but we see its the directional trend at this point.

But what’s the 10-2 Treasury spread signal?

A negative 10-2 yield spread has historically been considered a precursor to a recessionary period.

A negative 10-2 spread has predicted every recession from 1955 to 2020, but has inverted 6 – 24 months before the recession occurring, so it is a far-leading indicator.

The 10-2 spread reached a high of 2.91% in 2011, and went as low as -2.41% in 1980.


10-2 Year Treasury Yield Spread is currently at 0.62%, compared to 1.01% last year, and its lower than the long term average of 0.93%.

If the 10-2 Year Treasury Yield Spread crosses below zero, and the yield curve becomes inverted, that’s what will signal a recession is probably imminent, but a recession may not be identified until 6 – 24 months later.

Or, it could be very fast, like 2020.

Until then, I’m systematically monitoring the 10-2 Year Treasury Yield Spread for the advance warning.

For information about our proactive investment management, active risk management, hedging your risks, and ASYMMETRY® Managed Portfolios, contact us.

Mike Shell is the Founder and Chief Investment Officer of Shell Capital Management, LLC, and the portfolio manager of ASYMMETRY® Managed PortfoliosMike Shell and Shell Capital Management, LLC is a registered investment advisor focused on asymmetric risk-reward and absolute return strategies and provides investment advice and portfolio management only to clients with a signed and executed investment management agreement. The observations shared on this website are for general information only and should not be construed as advice to buy or sell any security. Securities reflected are not intended to represent any client holdings or any recommendations made by the firm. Any opinions expressed may change as subsequent conditions change. Please do not make any investment decisions based on such information, as it is subject to change. Investing involves risk, including the potential loss of principal an investor must be willing to bear. Past performance is no guarantee of future results. All information and data are deemed reliable but are not guaranteed and should be independently verified. The presence of this website on the Internet shall in no direct or indirect way raise an implication that Shell Capital Management, LLC is offering to sell or soliciting to sell advisory services to residents of any state in which the firm is not registered as an investment advisor. The views and opinions expressed in ASYMMETRY® Observations are those of the authors and do not necessarily reflect a position of Shell Capital Management, LLC. The use of this website is subject to its terms and conditions.

The stock market tapped its prior high, then backed off

On Friday I suggested “If we’re going to see selling pressure become resistance, this is where it starts” and though this has been an incredibly resilience market, I’m seeing signs of weakness.

I shared some of the signs this afternoon in “Point & Figure Charting the NASDAQ Trend.”

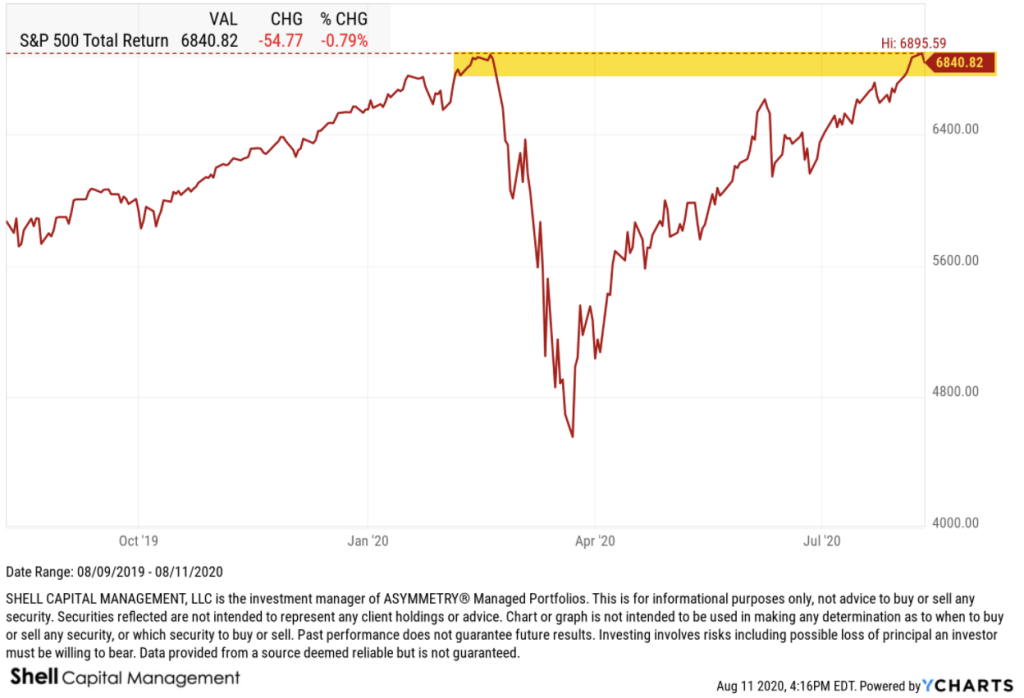
As the trading day got to the close, the S&P 500 and other stock market indexes drifted down.

The S&P 500 tapped its prior high, then backed off.

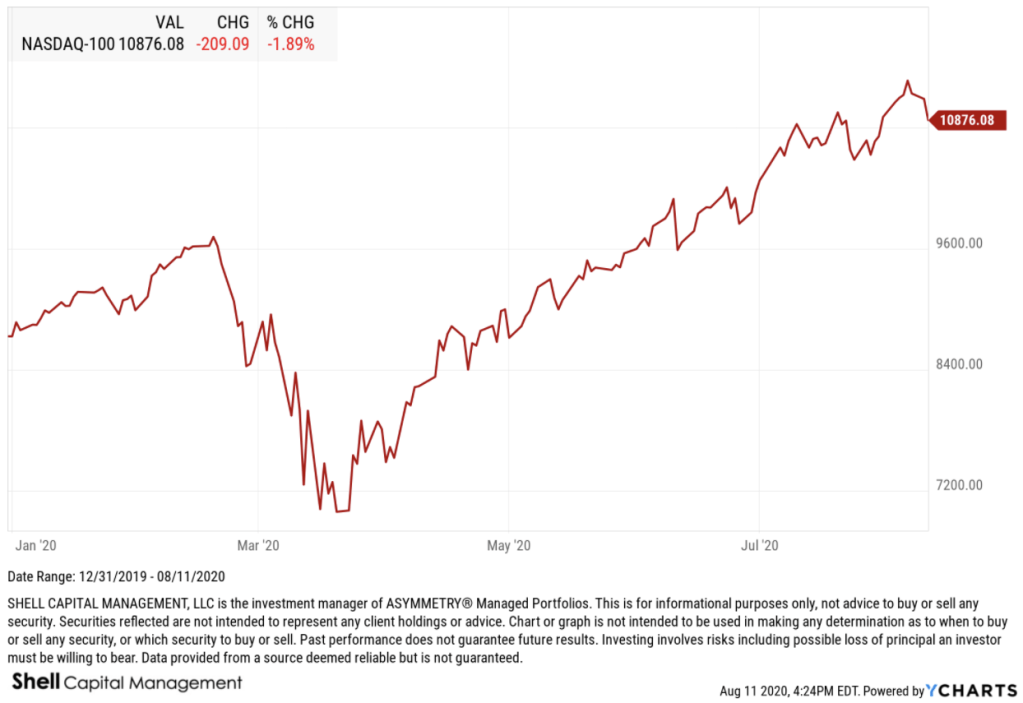
The NASDAQ 100, which has been in the strongest uptrend, also reversed down the most at nearly -2% today.

I had pointed out the internal weakness in the NASDAQ stocks earlier today.

It seems to be a continuation.

So, “If we’re going to see selling pressure become resistance, this is where it starts” and we’ll soon see if the US stock market attracts some new selling pressure, or if it’s there is enough enthusiasm to buy to overpower any selling.

Even the longest of long term investors should be aware of the risk this could be a significant top in the US stock market. That is, no matter how passive or “buy and hold” you are, if this turns out to be the early stage of a prolonged bear market, you’ll wish you had put in a place a hedging and/or risk management program to protect your capital.

If you need investment advice on risk management, or are interested in our ASYMMETRY® Hedging program, an overlay we can add to any investment portfolio, get in touch here.

Mike Shell is the Founder and Chief Investment Officer of Shell Capital Management, LLC, and the portfolio manager of ASYMMETRY® Global TacticalMike Shell and Shell Capital Management, LLC is a registered investment advisor focused on asymmetric risk-reward and absolute return strategies and provides investment advice and portfolio management only to clients with a signed and executed investment management agreement. The observations shared on this website are for general information only and should not be construed as advice to buy or sell any security. Securities reflected are not intended to represent any client holdings or any recommendations made by the firm. Any opinions expressed may change as subsequent conditions change.  Do not make any investment decisions based on such information as it is subject to change. Investing involves risk, including the potential loss of principal an investor must be willing to bear. Past performance is no guarantee of future results. All information and data are deemed reliable but is not guaranteed and should be independently verified. The presence of this website on the Internet shall in no direct or indirect way raise an implication that Shell Capital Management, LLC is offering to sell or soliciting to sell advisory services to residents of any state in which the firm is not registered as an investment advisor. The views and opinions expressed in ASYMMETRY® Observations are those of the authors and do not necessarily reflect a position of  Shell Capital Management, LLC. The use of this website is subject to its terms and conditions.

The 2 Year U.S. Treasury trends to uncharted territory and you better git your mind right

The 2 Year U.S. Treasury has never been this low before.

2 Year Treasury Rate is at 0.13%, compared to 0.17% the previous market day and 2.30% last year. This is lower than the long term average of 3.32%.

2 Year Treasury Rate is the yield received for investing in a US government issued treasury security that has a maturity of 2 years. The 2 year treasury yield is included on the shorter end of the yield curve and is important when looking at the overall US economy. Historically, the 2 year treasury yield trended as low as 0.16% in the low rate environment after the Great Recession post 2008. Here is the chart.

This is uncharted territory.

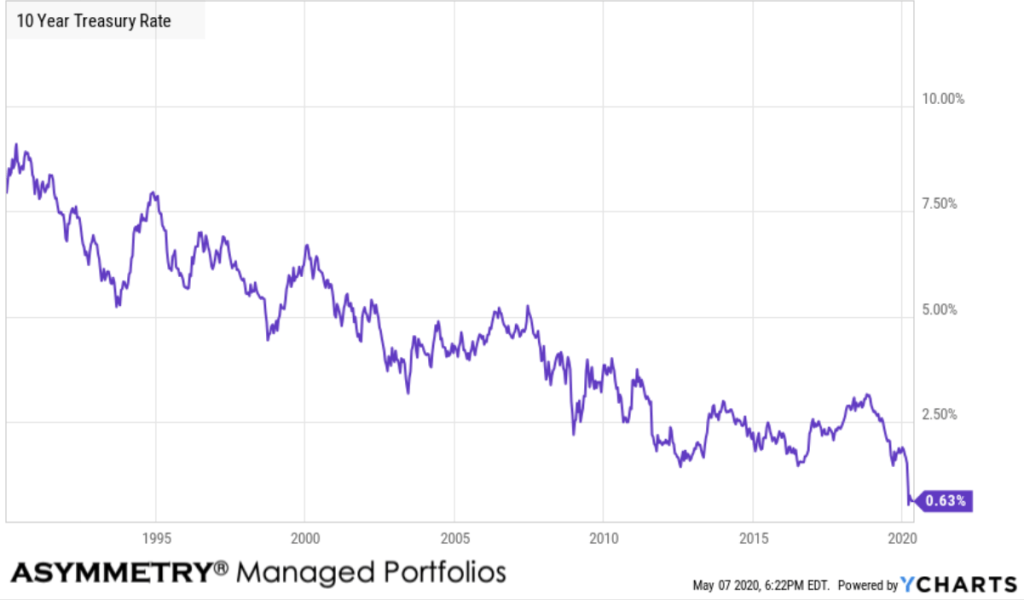
Here is the trend in the interest rate since 1990.

The 10 year treasury remains at an all time low.

On December 29, 2019, I shared my observations of the yield spread in “Asymmetry in yield spreads, inverted yield curve warning shot, and unemployment” when I said:

“A 10-2 treasury spread that approaches zero indicates a “flattening” yield curve. A flattening yield curve is when the shorter-term interest rate (2 years) is the same as longer-term interest rate (10 year).”

With the 2 year reaching an all time low, it’s a good time to revisit the yield curve.

10-2 Year Treasury Yield Spread is at 0.50%, compared to 0.55% the previous market day and 0.19% last year. This is lower than the long term average of 0.93%. But, it isn’t zero. Instead, the yield spread is trending up some. I labeled recessions in grey. The current recession hasn’t been called one yet by the historian economist, but it will be.

The 10-2 Treasury Yield Spread is the difference between the 10 year treasury rate and the 2 year treasury rate. A 10-2 treasury spread that approaches zero signifies a “flattening” yield curve. A negative 10-2 yield spread has historically been viewed as a precursor to a recessionary period. A negative 10-2 spread has predicted every recession from 1955 to 2018, but has occurred 6-24 months before the recession occurring, and is thus seen as a far-leading indicator. The 10-2 spread reached a high of 2.91% in 2011, and went as low as -2.41% in 1980.

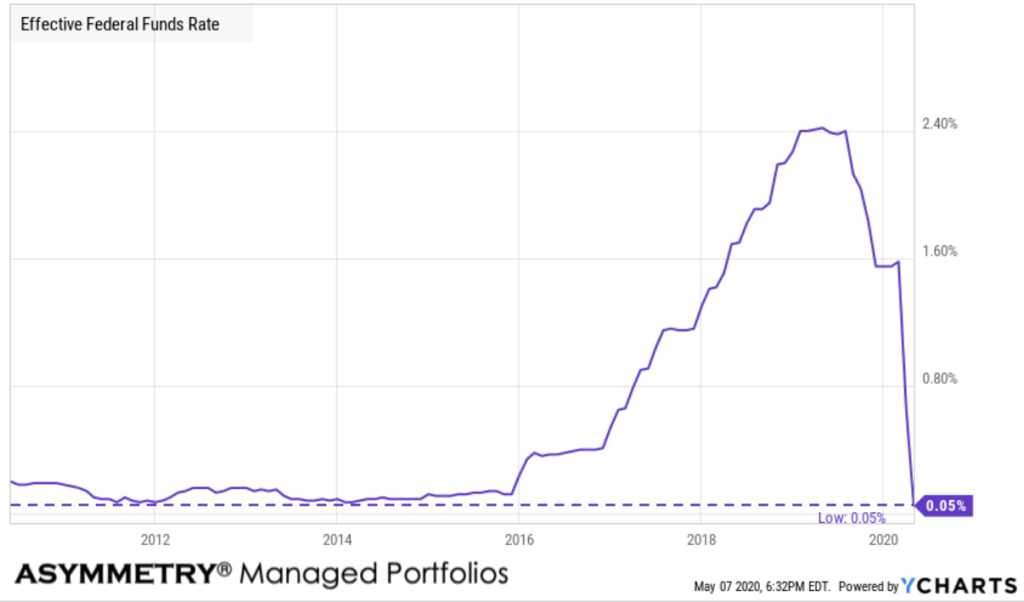
Interest rates in the U.S. are trending toward zero.

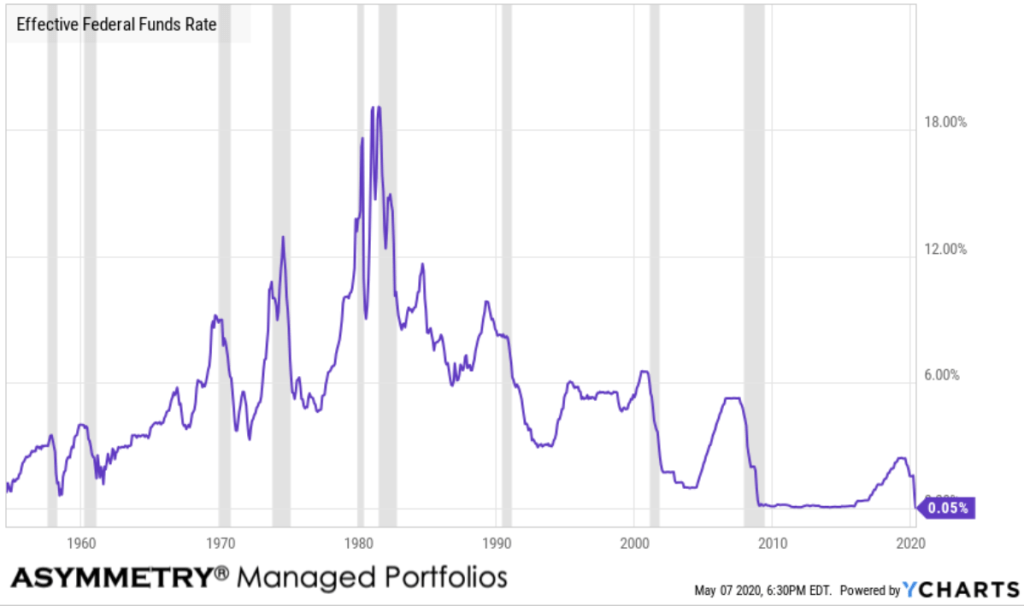
Effective Federal Funds Rate is at 0.05%, compared to 2.40% last year. This is lower than the long term average of 4.75%. The Effective Federal Funds Rate is as low as its ever been.

The Effective Federal Funds Rate is the rate set by the FOMC (Federal Open Market Committee) for banks to borrow funds from each other. The Federal Funds Rate is important because it can act as the benchmark to set other rates. Historically, the Federal Funds Rate reached as high as 22.36% in 1981 during the recession. Additionally, after the financial crisis in 2008-2009, the Federal Funds rate nearly reached zero when quantitative easing was put into effect.

Here is the Effective Federal Funds Rate going back to 1976.

Interest rates can’t be lowered in depressions.

They are already at or near zero.

Operating through the years ahead is going to require rowing, not sailing. It’s going to require rotating, rather than allocating. It’s going to require actively directing and controlling risk, rather than a passive buy and hope approach. We are entering a cycle that is long overdue, but it’s here, now, and I’m looking forward to operating through it tactically.

This is going to be big boy stuff here.*

You better git your mind right.

*Sorry ladies, saying big girl stuff wouldn’t be right.

Join 39.5K other subscribers

Mike Shell is the Founder and Chief Investment Officer of Shell Capital Management, LLC, and the portfolio manager of ASYMMETRY® Global TacticalMike Shell and Shell Capital Management, LLC is a registered investment advisor focused on asymmetric risk-reward and absolute return strategies and provides investment advice and portfolio management only to clients with a signed and executed investment management agreement. The observations shared on this website are for general information only and should not be construed as advice to buy or sell any security. Securities reflected are not intended to represent any client holdings or any recommendations made by the firm. Any opinions expressed may change as subsequent conditions change.  Do not make any investment decisions based on such information as it is subject to change. Investing involves risk, including the potential loss of principal an investor must be willing to bear. Past performance is no guarantee of future results. All information and data are deemed reliable but is not guaranteed and should be independently verified. The presence of this website on the Internet shall in no direct or indirect way raise an implication that Shell Capital Management, LLC is offering to sell or soliciting to sell advisory services to residents of any state in which the firm is not registered as an investment advisor. The views and opinions expressed in ASYMMETRY® Observations are those of the authors and do not necessarily reflect a position of  Shell Capital Management, LLC. The use of this website is subject to its terms and conditions.

Profiting from the Madness of Crowds

If we want to profit from the madness of crowds, we necessarily need to believe and do different things than the crowd at the extremes.

You may have heard the stock market was down a lot yesterday. I consider yesterday’s price action a black swan event.  The -8% one-day decline was the worst day for S&P500 since 2008 and the 19th worst day since 1928.

The popular S&P 500 stock index dropped -7.6%, which was enough to trigger a circuit breaker to halt trading for the first time in 23 years. Circuit breakers are the thresholds when, if reached during a single-day decline in the S&P 500, trading is halted. Circuit breakers halt trading on US stock markets during dramatic price declines and are set at 7%, 13%, and 20% of the closing price for the previous day.

After yesterday’s waterfall decline, the price trend of the S&P 500 lost the 24% gain it had achieved a month ago.
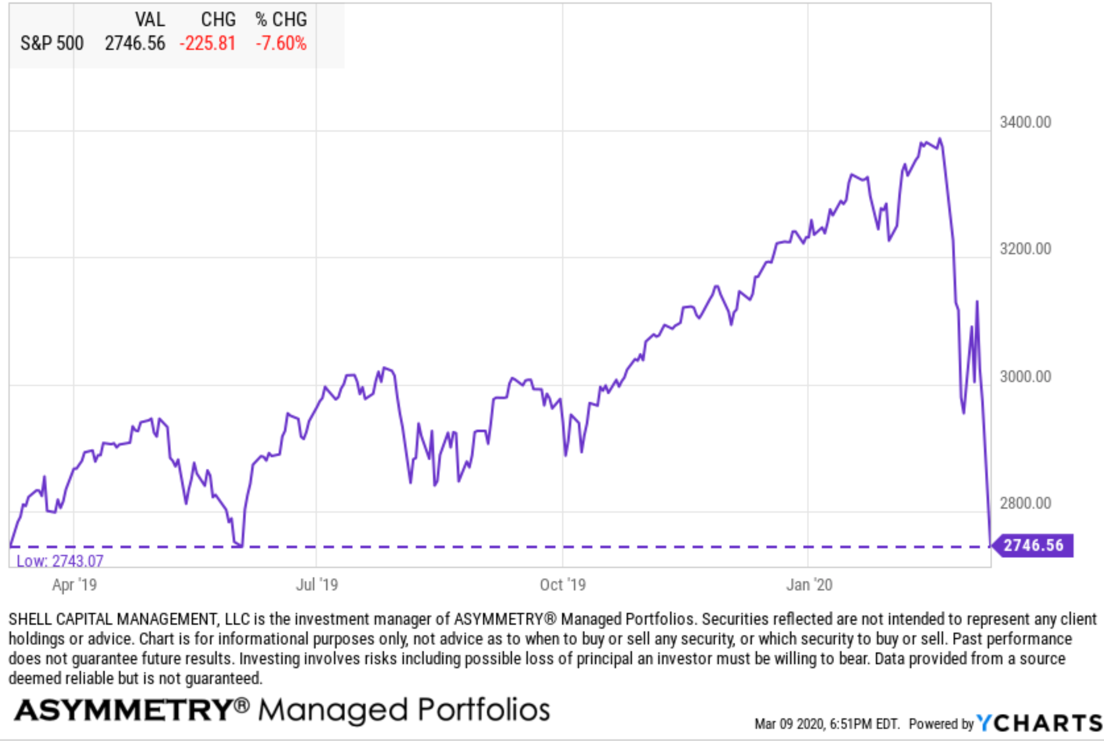
stock market lost 2020 gain

Interestingly, we’re seeing “mean reversion” as the SPX is now all the way back to the same level it reached in January 2018. In investment management, mean reversion is the theory that a stock’s price will tend to move to the average price over time. This time it did.
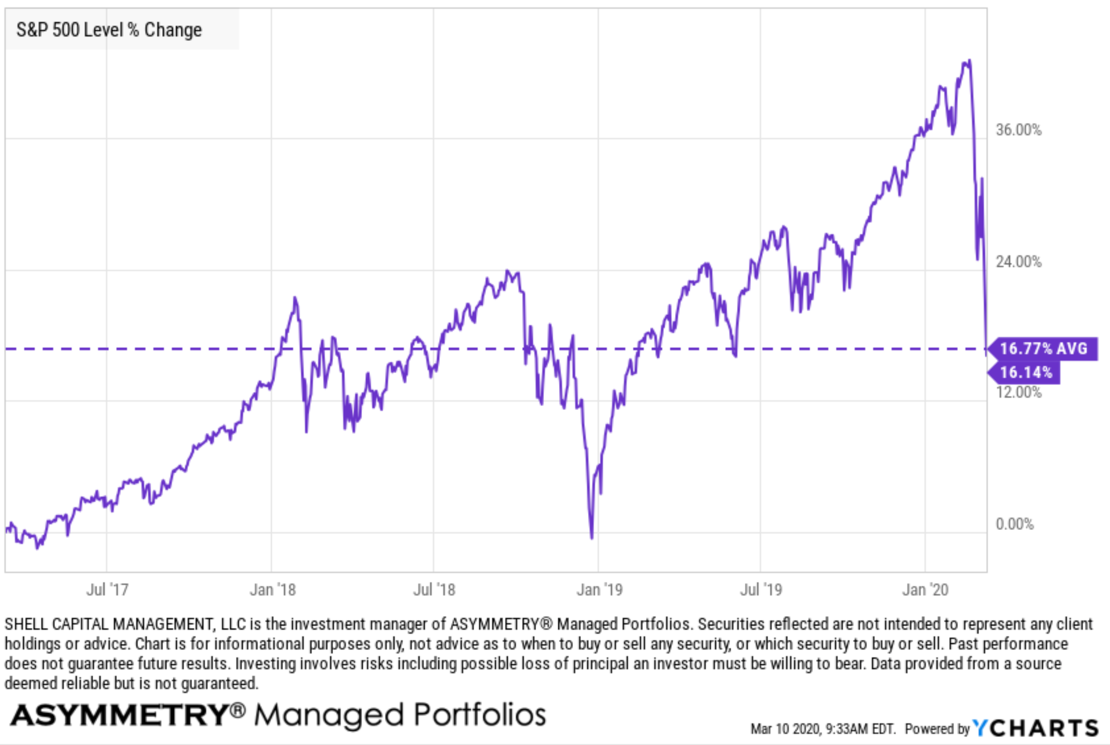
mean reversion SPX SPY S&P 500

US equity investors would have been better off believing the market was too overvalued then and shifting to short term Treasuries. But, who would have been able to do that? Who wouldn’t have had the urge to jump back in on some of the enormous up days the past two years? There’s the real challenge: investor behavior. And yes, some may even look back and say they knew then but didn’t do anything. If we believed it then, we can go back and read out notes we made at the time. But, it wouldn’t matter if a belief isn’t acted on. I’m a trigger puller, I pull the trigger and do what I believe I should do in pursuit of asymmetric risk/reward for asymmetry.

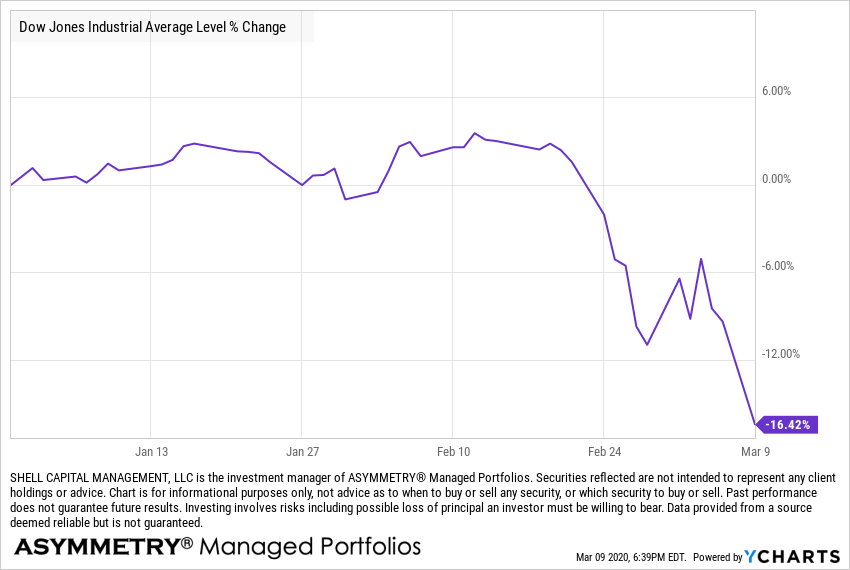
Dow Jones is down -16.4% YTD at this point.
dow jones 2020 loss

The Dow Jones has also experienced some “mean reversion” over the 3-year time frame.

dow jones 2020 loss bear stock market

Mid-cap stocks, as measured by the S&P 400, are down, even more, this year, in the bear market territory.

mid cap stock in bear market MDY

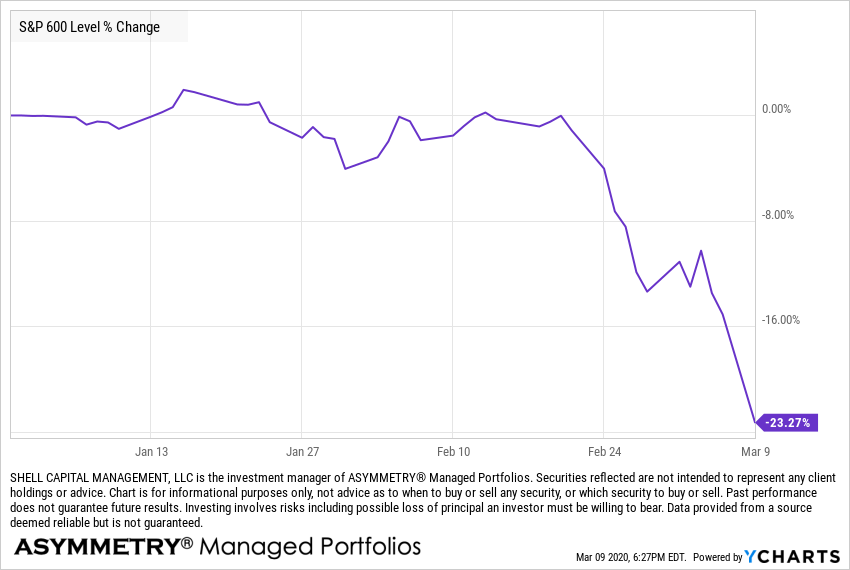
Small-cap stocks, considered even riskier, are now down -23% in 2020.
small cap stocks are in a bear market

Clearly, the speed and magnitude of this waterfall decline have been impressive since the February 19th top just three weeks ago. Decreases in these broad stock indexes of -20% are indications of a strong desire to sell and yesterday, panic selling.

So, -20% from peak, the stock market decline has reached bear market territory and is now nearly in-line with the typical market-sell off since 1928 that preceded an upcoming recession.

Global Equity Market Decline

And by the way, it wasn’t just US equities, the selling pressure was global with some markets like Russia, Australia, Germany, Italy, and Brazil down much more.

stock stock market selloff

Extreme Investors Fear is Driving the Stock Market 

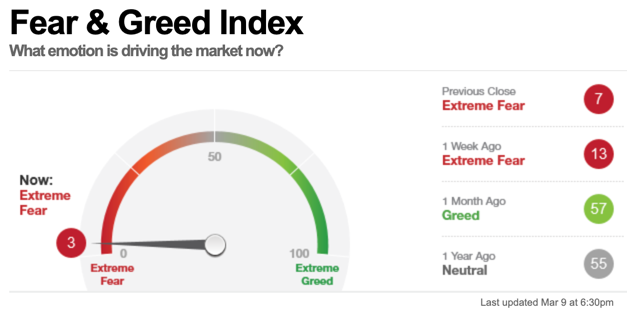
Indeed, after Extreme Fear is driving the stock market according to investor sentiment measures. A simple gauge anyone can use is the Fear & Greed Index, which measures seven different indicators.

As of today, it shows the appetite for risk is dialed back about as close to zero it can get.
what is driving the stock market

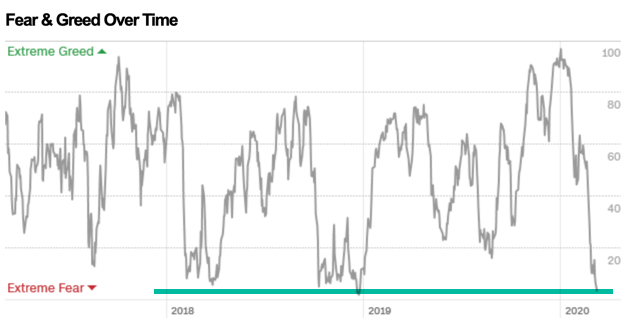
In the next chart, we can observe the relative level of the gauge to see where it is comparable to the past. While this extreme level of fear can stay elevated for some time, it has now reached the lowest levels of 2018. It’s important to note this isn’t a market timing indicator, and it does not always provide a timely signal. As you can see, at prior extreme lows such as this, the fear remained extreme for some time as the indicator oscillated around for a while. It’s a process, not an event. Investor sentiment measures like this tell us investors are about as scared as they get at their extreme level of fear is an indication those who wanted to sell may have sold.
fear greed investor sentment over time

Monitoring Market Conditions

My objective is asymmetric investment returns, so I look to find an asymmetric risk-reward in a new position. An asymmetric return profile is created by a portfolio of asymmetric risk-reward payoffs. For me, these asymmetric payoffs are about low-risk entries created through predefined exits and how I size the positions at the portfolio level. As such, I’ve been entering what I consider to be lower risk points when I believe there is potentila for an asymmetric payoff. Sometimes these positions are entering a trend that is already underway and showing momentum. The market is right most of the time, but they get it wrong at extremes on both ends. I saw that because of my own personal observations for more than two decades of professional money management, which is confirmed, markets and behavior really haven’t changed.

Humphrey B. Neill, the legendary contrarian whose book “The Art of Contrary Thinking,” published in 1954, including the same observations nearly seventy years ago.

“The public is right more of the time than not ” … but “the crowd is right during the trends but wrong at both ends.”

As market trends reverse and develop, we see a lot of indecision about if it will keep falling or reverse back up, which results in volatility as prices spread out wider driven by this indecisiveness. Eventually, the crowd gets settled on once side and drives the price to trend more in one direction as the majority of capital shifts enough demand to overwhelm the other side.

Risk Manager, Risk Taker

At these extremes, I have the flexibility to shift from a trend following strategy to a  countertrend contrarian investment strategy. My ability to change along with conditions is why I am considered an “unconstrained” investment manager. I have the flexibility to go anywhere, do anything, within exchange-traded securities. By “go anywhere,” I mean cash, bonds, stocks, commodities, and alternatives like volatility, shorting/inverse, real estate, energy MLPs, etc. I give myself as broad of an opportunity set as possible to find potentially profitable price trends. So, as prices have been falling so sharply to extremes, I was entering new positions aiming for asymmetric risk/reward. I was able to buy at lower prices because I had also reduced exposure at prior higher prices. As trends became oversold as measured by my systems, I started increasing exposure for a potential countertrend.

On ASYMMETRY® Observations, I’m writing for a broad audience. Most of our clients read these observations as do many other investment managers. My objective isn’t to express any detail about my specific buying and selling, but instead overall observations of market conditions to help you see the bigger picture as I do. As long time readers know, I mostly use the S&P 500 stock index for illustration, even though I primarily trade sectors, stocks, countries; an unconstrained list of global markets. I also share my observations on volatility, mostly using the VIX index to demonstrate volatility expansions/contractions. At the extremes, I focus a lot of my observations on extremes in investor sentiment and breadth indicators to get an idea of buying and selling pressure that may be drying up.

Market Risk Measurement 

One of my favorite indicators to understand what is going on inside the stock market is breadth. To me, breadth indicators are an overall market risk measurement system. Here on ASYMMETRY® Observations, I try to show these indicators as simple as possible so that anyone can understand.

If we want to profit from the madness of crowds, we necessarily need to believe and do different things than the group at the extremes.

One of my favorite charts to show how the market has de-risked or dialed up risk is the percent of S&P 500 stocks above the moving average. As you see in the chart, I labeled the high range with red to signal a “higher risk” zone and the lower level in green to indicate the “lower risk” zone.

percent of s&P stocks above moving average 2020

I consider these extremes “risk” levels because it suggests to me after most of the stocks are already in long term uptrends, the buying enthusiasm may be nearing its cycle peak. And yes, it does cycle up and down, as evidenced by the chart. As of yesterday’s close, only 17% of the S&P 500 stocks are trending above their 200-day moving average, so most stocks are in a downtrend. That’s not good until it reaches an extreme level, then it suggests we may be able to profit from the madness of crowds as they tend to overreact at extremes.  The percent of S&P 500 stocks above the longer-term moving average has now declined into the green zone seen in late 2018, the 2015-16 period, 2011, but not as radical as 2008 into 2009. If this is the early stage of a big bear market, we can expect to see it look more like the 2008-09 period.

We can’t expect to ever know if equities will enter a bear market in advance. If you base your trading and investment decisions on the need to predict what’s going to happen next, you already have a failed system. You are never going to know. What I do, instead, is focus on the likelihood. More importantly, I predefined the amount of risk I’m willing to take and let it rip when the odds seem in my favor. After that, I let it all unfold. I know I’ll exit if it falls to X, and my dynamic risk management system updates this exit as the price moves up to eventually take profits.

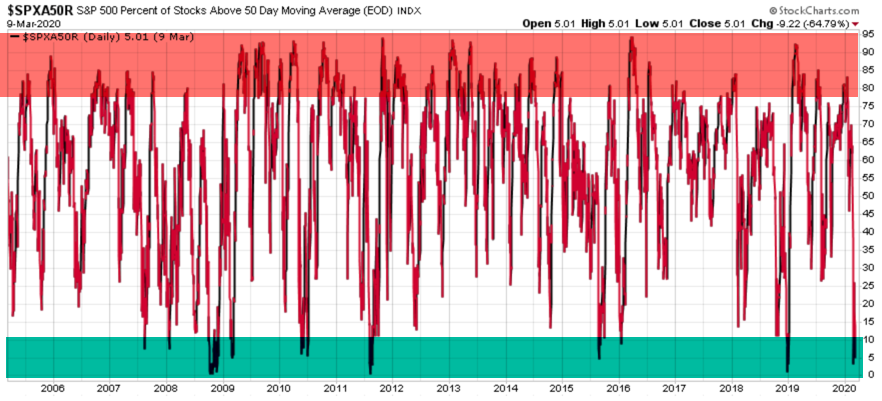
Zooming in to the shorter trend, the percent of stocks above their 50 day moving average has fallen all the way down to only 5% in an uptrend. This means 95% of the S&P 500 stocks are in shorter-term downtrends. We can interpret is as nearly everyone who wants to sell in the short term may have already sold.
stock market breadth risk management market timing

I can always get worse. There is no magical barrier at this extreme level that prevents it from going to zero stocks in an uptrend and staying there a long time as prices fall much more. But, as you see in the charts, market breadth cycles up and down as prices trend up and down.

If we are in the early stage of a big bear market, I expect there will be countertrends along the way if history is a guide. I’ve tactically traded through bear markets before, and the highlight of my career was my performance through the 2007-09 period. I didn’t just exit the stock market and sit there, I traded the short term price trends up and down. If someone just exited the stock market and sit there, that may have been luck. If we entered and exited 8 or 10 different times throughout the period with a positive asymmetry of more significant profits than losses, it may have required more skill. I like my managed portfolio to be in synch with the current risk/reward characteristics of the market. If that is what we are achieving, we may have less (or hedged) exposure at the peak and more exposure after prices fall. I believe we should always be aware of the potential risk/reward the market itself is providing, and our investment strategy should dynamically adapt to meet these conditions.

If we want to profit from the madness of crowds, it means we have some cash or the equivalent near trend highs and reenter after prices fall. It may also be achieved by hedging near highs and using profits from the hedge to increase exposure after prices have dropped. It sounds like a contrarian investor. To be a contrarian investor at extremes to profit from a countertrend, we study crowd behavior in the stock market and aim to benefit from conditions where other investors/traders act on their emotions. These extremes of fear and greed are seen at major market turning points, presenting the disciplined contrarian with opportunities to both enter and exit the market.

This crowd psychology has been observed for many decades, and unfortunately, investors and traders are excellent lab rates to study the behavior.

Believe it or not, 179 years ago, in 1841, Charles Mackay published his book “Extraordinary Popular Delusions and the Madness of Crowds” in which discussing the South Sea Bubble and Dutch Tulip Mania as examples of this mass investment hysteria. People haven’t changed. As a crowd, we the people still underreact to initial information and then overreact at the extremes.

As Mackay observed nearly two centuries ago:

“Men, it has been well said, think in herds; it will be seen that they go mad in herds, while they only recover their senses slowly, and one by one.”

Once people begin to go with the crowd, their thinking can become irrational and driven by the emotional impulses of the crowd rather than on their own individual situation.

According to studies like DALBAR’s Quantitative Analysis of Investor Behavior (QAIB), individual investors have poor results over the long haul. QAIB has measured the effects of investor decisions to buy, sell and switch into and out of mutual funds over short and long-term timeframes since 1994 and finds people tend to do the wrong things at the wrong time. If we want to create different results from the majority, we must necessarily believe and do things differently.

At this point, we’ve seen fund flows from stocks to bonds reach extreme levels across multiple time frames as panic selling set in. I’m glad to say, while imperfect as to timing, I have done the opposite by shifting to short term US Treasuries at the prior high stock prices and then started rebuying stocks last week. Of course, I have predetermined points I’ll exit them if they fall, so I remain flexible and may change direction quickly, at any time.

I’m seeing a lot of studies showing that history suggests single-day waterfall declines like yesterday were followed by gains over the next few weeks. Rather than hoping past performance like that simply repeats, I prefer to measure the current risk level and factor in existing conditions.

It’s important to understand, as. I have pointed out many times before, that the US stock market has been in a very aged bull market that has been running 11 years now. And the longest on record. The US is also in the longest economic expansion in history, so we should be aware these trends will eventually change. But, when it comes to the stock market, longer trends are a process, not an event. Longer trends unfold as many smaller swings up and down along the way that may offer the potential for flexible tactical traders to find some asymmetry from the asymmetric risk/reward payoffs these conditions may create.

It’s also important to be aware the volatility expansion and waterfall decline the past three weeks seems to indicate a fragile market structure with a higher range of prices, so we’re likely to observe turbulence for some time. These conditions can result in amplified downtrends and uptrends.

Falling prices create forced selling by systematic investment managers similar to what we saw in the December 2018 market crash. As I’ve seen signals from my own systematic trend following and momentum systems shift, it’s no surprise to see some increased selling pressure that may be helped by more money in these programs.

We are in another period of extremes driven by the “madness of crowds,” and my plan is to apply my skills and experience with the discipline to tactically operate through whatever unfolds.

Mike Shell is the Founder and Chief Investment Officer of Shell Capital Management, LLC, and the portfolio manager of ASYMMETRY® Global TacticalMike Shell and Shell Capital Management, LLC is a registered investment advisor in Florida, Tennessee, and Texas. Shell Capital is focused on asymmetric risk-reward and absolute return strategies and provides investment advice and portfolio management only to clients with a signed and executed investment management agreement. The observations shared on this website are for general information only and should not be construed as advice to buy or sell any security. Securities reflected are not intended to represent any client holdings or any recommendations made by the firm. I observe the charts and graphs to visually see what is going on with price trends and volatility, it is not intended to be used in making any determination as to when to buy or sell any security, or which security to buy or sell. Instead, these are observations of the data as a visual representation of what is going on with the trend and its volatility for situational awareness. I do not necessarily make any buy or sell decisions based on it. Any opinions expressed may change as subsequent conditions change.  Do not make any investment decisions based on such information as it is subject to change. Investing involves risk, including the potential loss of principal an investor must be willing to bear. Past performance is no guarantee of future results. All information and data are deemed reliable but is not guaranteed and should be independently verified. The presence of this website on the Internet shall in no direct or indirect way raise an implication that Shell Capital Management, LLC is offering to sell or soliciting to sell advisory services to residents of any state in which the firm is not registered as an investment advisor. The views and opinions expressed in ASYMMETRY® Observations are those of the authors and do not necessarily reflect a position of  Shell Capital Management, LLC. The use of this website is subject to its terms and conditions.


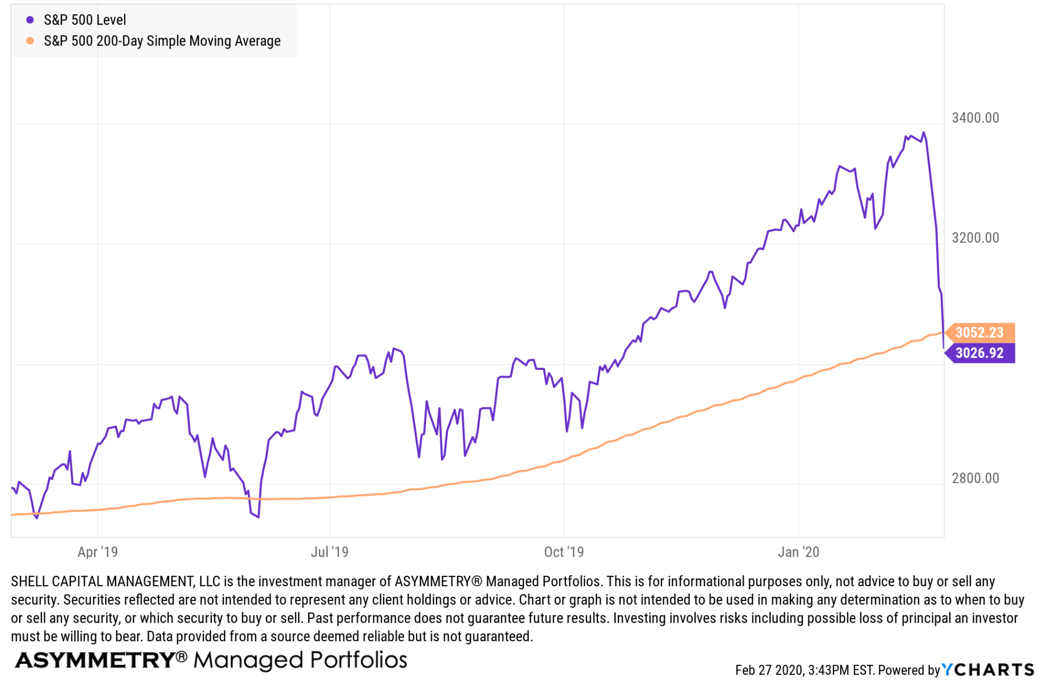
The stock index falls below its long-term trend, but stocks are now getting oversold

The stock index falls below its long-term trend, but just as stocks are getting oversold. The 200-day moving average was about 11% below the high February 19th, just eight days ago.

spx spy 200 day moving average trend 11 percent Feb 2020

As you can see in the chart, this has been a sharp waterfall decline and one I’m glad we avoided so far. For those of us in a position of strength, we stalk the market actively looking for a lower-risk entry point that offers the potential for asymmetric risk-reward payoff. An asymmetric payoff is when we structure our positions so our potential for downside loss is limited to much less than the potential for capital gains.

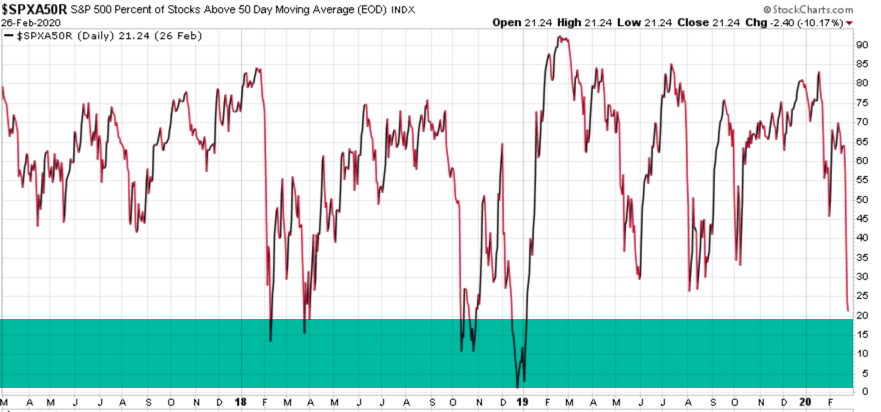
The stock market is now getting more oversold on a short term basis.

Only 21% of S&P 500 stocks are above their 50 day moving average. That’s a lot of broken uptrend lines shifting into downtrends.

stock market oversold

In the chart, I colored the “buy zone” in green. As you can see, it’s now down to a level I consider an indication that selling pressure may become exhausted as long as prices have been sold down to a low enough level to attract buying demand.

The stock market, and stock prices, are driven by supply and demand. It’s that simple. Measuring supply and demand isn’t so simple for most investors.

In the bigger picture, the longer-term trend lines are still at the 50-yard line, which is where all but one of the past five declines stopped. Of course, the one time stocks really got sold down was late 2018. Only time will tell if this becomes another period like that, but right now, those of us who had reduced or removed exposure to the market losses are probably looking to buy.

stock market breadth

The longer-term trend lines are holding better, which is no surprise because stocks had trended up well above their longer trend lines. For example, the S&P 500 index was trading about 11% above its own 200 day moving average and it just now crossed below it. When many stocks are trending that far above their trend line, it takes more of a price decline to trigger the percent of stocks to fall.

february 2020 stock market loss decline

Stocks market declines to tend to be asymmetric. Prices trend down faster than they trend up. After prices trend down, contagion sets in the lower prices fall. Prices then get driven down even more simply because investors are selling to avoid further loss. But, someone has to be on the other side of their panic selling. It’s those who had the cash to buy.

If you sell higher, you can buy lower.

Need help? Contact us here.

Mike Shell is the Founder and Chief Investment Officer of Shell Capital Management, LLC, and the portfolio manager of ASYMMETRY® Global TacticalMike Shell and Shell Capital Management, LLC is a registered investment advisor in Florida, Tennessee, and Texas focused on asymmetric risk-reward and absolute return strategies and provides investment advice and portfolio management only to clients with a signed and executed investment management agreement. The observations shared on this website are for general information only and should not be construed as advice to buy or sell any security. Securities reflected are not intended to represent any client holdings or any recommendations made by the firm. I observe the charts and graphs to visually see what is going on with price trends and volatility, it is not intended to be used in making any determination as to when to buy or sell any security, or which security to buy or sell. Instead, these are observations of the data as a visual representation of what is going on with the trend and its volatility for situational awareness. I do not necessarily make any buy or sell decisions based on it. Any opinions expressed may change as subsequent conditions change.  Do not make any investment decisions based on such information as it is subject to change. Investing involves risk, including the potential loss of principal an investor must be willing to bear. Past performance is no guarantee of future results. All information and data are deemed reliable but is not guaranteed and should be independently verified. The presence of this website on the Internet shall in no direct or indirect way raise an implication that Shell Capital Management, LLC is offering to sell or soliciting to sell advisory services to residents of any state in which the firm is not registered as an investment advisor. The views and opinions expressed in ASYMMETRY® Observations are those of the authors and do not necessarily reflect a position of  Shell Capital Management, LLC. The use of this website is subject to its terms and conditions.

Dow Jones is down -10% off its high

Dow Jones is down -10% off its high. I don’t pay much attention to the Dow Jones Industrial Average as it’s a price-weighted index of 30 stocks. But, the S&P 500 capitalization-weighted index of approximately 500 stocks seems a better proxy for “the market,” and it’s not far behind.

Here is the percent off high (drawdown) chart year to date.

dow jones down over 10 %

We don’t own either of these ETFs, they are for illustration only. In fact, our portfolio is was 85% U.S. Treasuries, and 15% invested in high dividend-yielding positions. One of them has a dividend yield of 9.8% and the other 11.9%, so while their prices may be falling with the stock market, we have some margin of safety from the high yield. In fact, as the prices fall, the yield rises from that starting point.

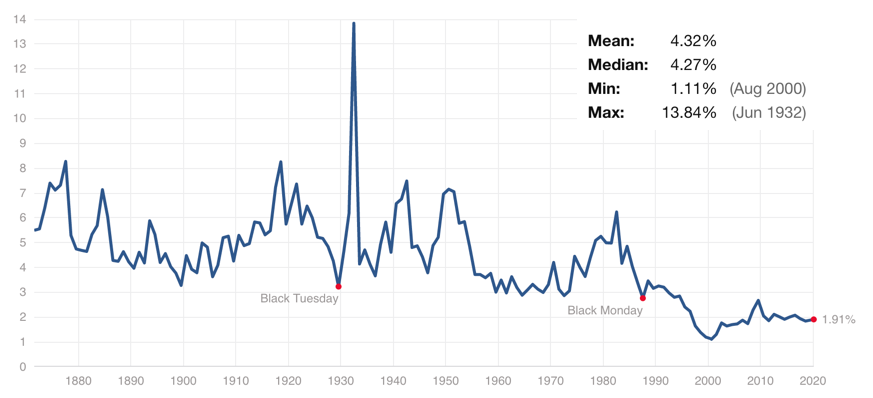
Speaking of dividend yield below is a visual of the dividend yield of the S&P 500 (1.84’%) and the Dow (2.27%), which are relatively low historically. But, as prices fall, the yields will rise, assuming the stocks in the index keep paying dividends.

stock dividend yield

In the above chart, I’m using the ETF dividend yields as they are real-time. Since the ETFs have only been trading for two or three decades, to see what I mean by “long term” I look at the S&P 500 Stock Index dividend yield (calculated as 12-month dividend per share)/price) to see how low the yield has been the past twenty years.

long term stock dividend yield

So, the future expected return from dividend yields on these stocks indexes is relatively low, looking back 150 years. The spikes you see are after stock market crashes as the price falls, the yield rises, as with bonds. Low dividend yield also suggests the stock market is overvalued. A higher dividend yield indicates the stock market is undervalued, and if nothing else, investors earn a higher income from the dividends from a lower starting price.

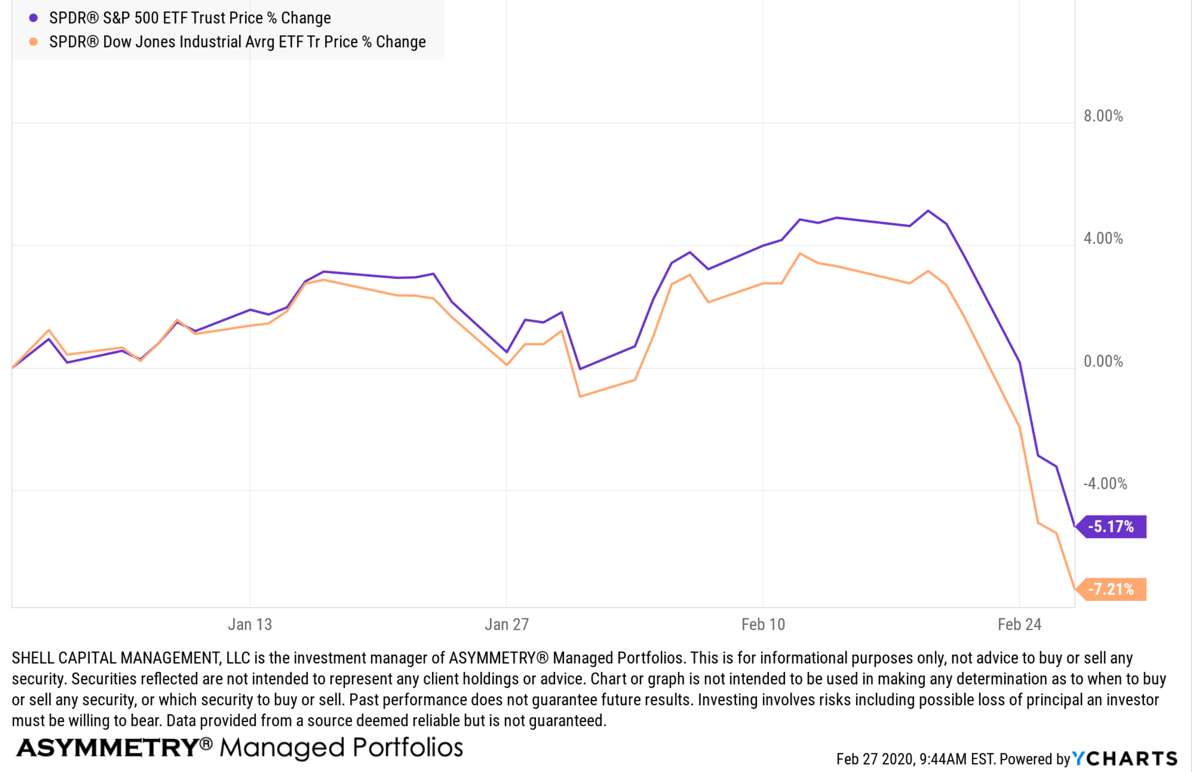
Back to the year to date, the short term, the S&P 500 is now down -5% in 2020, and the Dow Jones is down -7%.

stock market drop 2020

I believe this may be the fastest -10% decline in the history of the Dow Jones Industrial average.

I’m just glad we aren’t in it.

This is when drawdown controls and risk management pays. More importantly, it’s when discipline pays. While some investment managers want to manage risk to limit their drawdowns, they don’t always excel at doing it. Discipline is a personal edge. It doesn’t matter how good our scientifically tested quantitative models with a mathematical basis for believing in them are if we lack the discipline to execute them with precision. I can also say it isn’t enough for me to have all the discipline either, as we must necessarily help our investment management clients stick with it, too. So, investor behavior modification is part of our wealth management services. It’s why Christi Shell is not only a Certified Wealth Strategist® with over twenty-six years of experience helping high net worth families with the overall management of assets but also a certified Behavioral Financial Advisor® (BFA®) to help them manage themselves.

It’s what we do.

Need help? Contact us here.

Mike Shell is the Founder and Chief Investment Officer of Shell Capital Management, LLC, and the portfolio manager of ASYMMETRY® Global TacticalMike Shell and Shell Capital Management, LLC is a registered investment advisor in Florida, Tennessee, and Texas focused on asymmetric risk-reward and absolute return strategies and provides investment advice and portfolio management only to clients with a signed and executed investment management agreement. The observations shared on this website are for general information only and should not be construed as advice to buy or sell any security. Securities reflected are not intended to represent any client holdings or any recommendations made by the firm. I observe the charts and graphs to visually see what is going on with price trends and volatility, it is not intended to be used in making any determination as to when to buy or sell any security, or which security to buy or sell. Instead, these are observations of the data as a visual representation of what is going on with the trend and its volatility for situational awareness. I do not necessarily make any buy or sell decisions based on it. Any opinions expressed may change as subsequent conditions change.  Do not make any investment decisions based on such information as it is subject to change. Investing involves risk, including the potential loss of principal an investor must be willing to bear. Past performance is no guarantee of future results. All information and data are deemed reliable but is not guaranteed and should be independently verified. The presence of this website on the Internet shall in no direct or indirect way raise an implication that Shell Capital Management, LLC is offering to sell or soliciting to sell advisory services to residents of any state in which the firm is not registered as an investment advisor. The views and opinions expressed in ASYMMETRY® Observations are those of the authors and do not necessarily reflect a position of  Shell Capital Management, LLC. The use of this website is subject to its terms and conditions.

Stock market recoveries are a process, not an event

After yesterday’s close, the popular stock market indexes, including the S&P 500, Dow Jones Industrial Average, and NASDAQ were down around -3% for the day.

stock market

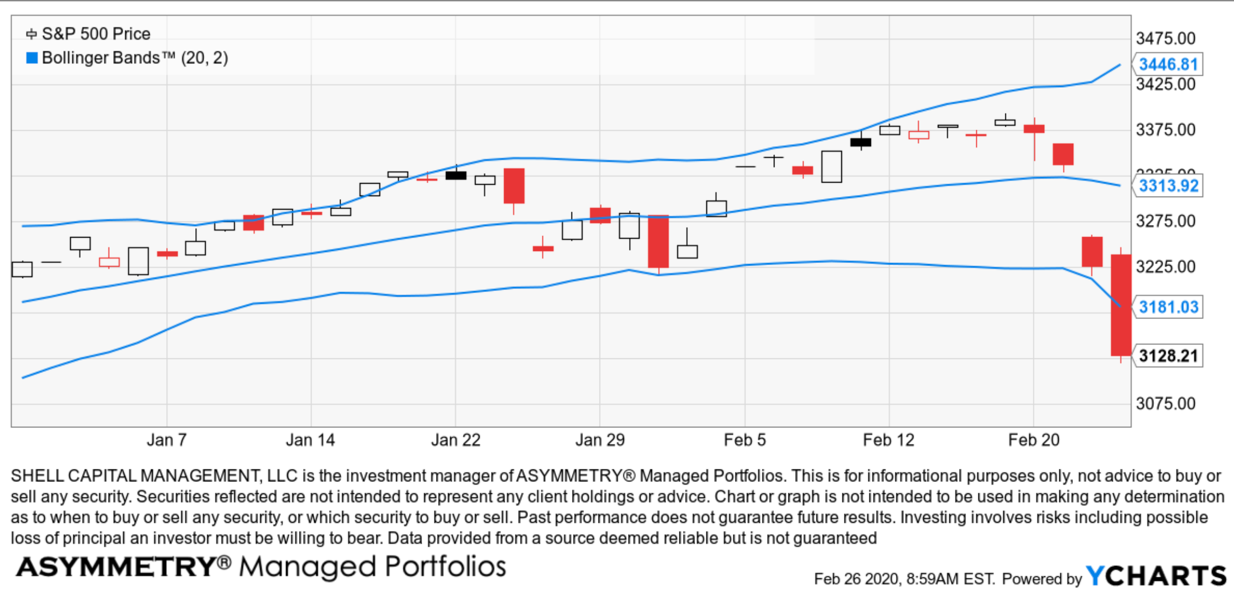
Adding volatility bands around the price trend and its 20 day moving average illustrates a volatility expansion as prices have spread out to a wider trading range. The S&P 500 stock index traded below its lower volatility band, which expands as the price action becomes volatile. Volatility bands and channels help to answer: Are prices high or low on a short term relative basis? The recent price action is relatively high at the upper band and low at the lower band. By the way, I observe the charts and graphs to visually see what is going on with price trends and volatility, it is not intended to be used in making any determination as to when to buy or sell any security, or which security to buy or sell. Instead, these are observations of the data as a visual representation of what is going on with the trend and its volatility for situational awareness. I do not necessarily make any buy or sell decisions based on it. 

volatility expansion bollinger band

At this point, the stock index has traded below its band, demonstrating panic level selling pressure outside what I consider a normal range of price action. 

Volatility channels are even more useful when combined with other indicators for confirmation. Next, I add a momentum measure for confirmation the index is oversold on a short-term basis. It can get more oversold, but a short term reversal now becomes likely if the desire to sell has become exhausted. 

spx spy countertrend trend following asymmetric risk reward

The potential good news for those with exposure to loss, in the short term, we may see a countertrend move back up to retrace some of the stock market losses. However, this will be the test to see if selling pressure has been exhausted or if prices have been driven down low enough to attract sufficient buying interest to push the price trends back up.

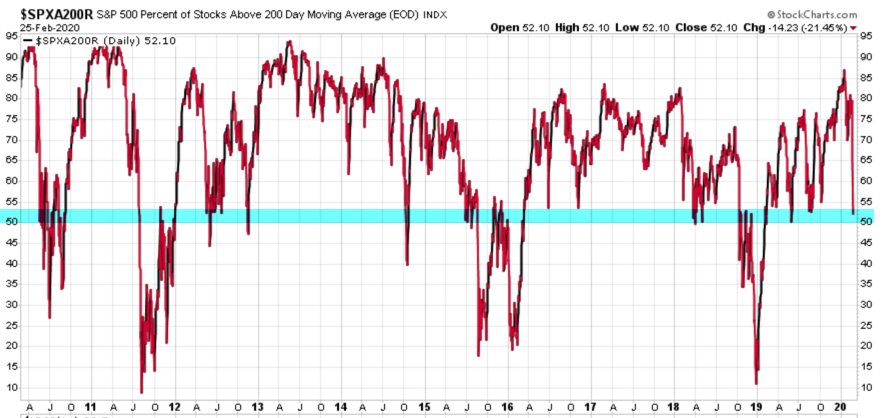
Another observation I’ll share is after the close, we recalculated the percent of S&P 500 stocks above their 200 day moving average using the end of day prices. The percent of stocks above their 200 day moving average is now at the 50-yard line, whit bout half of the SPX stocks in a longer-term uptrend and a half in a downtrend. Obviously, that’s more stocks now below the trend line than when I shared it yesterday.

percent of spx stocks above below 200 day moving average

A more significant decline is seen in the percent of stocks above their 50-day moving averages, which fell 38% to only 23% of S&P 500 stocks trading above their shorter-term moving average trend line.

percent of stocks above below 50 day moving average breadth

So, at least on a short term basis, selling pressure has pushed stocks down to the point more are in downtrends than uptrends.

Next, we’ll see if sellers have pushed prices low enough to attract significant buying demand. I expect to see at least a short term countertrend back up, as investors overreacted to the downside, but only time will tell if any countertrend up is sustainable long term. My longer-term indicators are neutral at this point, so there could be more selling if investors and traders anchor to prior highs wishing they’d sold previously and sell into an uptrend.

My objective is asymmetric returns, so I focus on asymmetric risk-reward. After prices seem to trend up too far, too fast, by my quantitative mathematical calculations, the asymmetric returns from future prices are limited, and the asymmetric risk is increased. After prices seem to fall too far, too fast, by my quantitative mathematical calculations, the asymmetric risk-reward profile becomes more positive. And, all of it is probabilistic, none of it is ever a sure thing.

It’s a process, not an event.

As I shared yesterday; Stock prices may not be finished falling, but some opportunities for asymmetric risk-reward may be present for those willing to take risks.  

Need help? Contact us here

Mike Shell is the Founder and Chief Investment Officer of Shell Capital Management, LLC, and the portfolio manager of ASYMMETRY® Global TacticalMike Shell and Shell Capital Management, LLC is a registered investment advisor in Florida, Tennessee, and Texas focused on asymmetric risk-reward and absolute return strategies and provides investment advice and portfolio management only to clients with a signed and executed investment management agreement. The observations shared on this website are for general information only and should not be construed as advice to buy or sell any security. Securities reflected are not intended to represent any client holdings or any recommendations made by the firm. I observe the charts and graphs to visually see what is going on with price trends and volatility, it is not intended to be used in making any determination as to when to buy or sell any security, or which security to buy or sell. Instead, these are observations of the data as a visual representation of what is going on with the trend and its volatility for situational awareness. I do not necessarily make any buy or sell decisions based on it. Any opinions expressed may change as subsequent conditions change.  Do not make any investment decisions based on such information as it is subject to change. Investing involves risk, including the potential loss of principal an investor must be willing to bear. Past performance is no guarantee of future results. All information and data are deemed reliable but is not guaranteed and should be independently verified. The presence of this website on the Internet shall in no direct or indirect way raise an implication that Shell Capital Management, LLC is offering to sell or soliciting to sell advisory services to residents of any state in which the firm is not registered as an investment advisor. The views and opinions expressed in ASYMMETRY® Observations are those of the authors and do not necessarily reflect a position of  Shell Capital Management, LLC. The use of this website is subject to its terms and conditions.


19 is the new 20, but is this a new low volatility regime?

We used to say the long term average for the Cboe Volatility Index VIX is 20.

Some would mistakenly say that VIX “reverts to the mean”, suggesting it is drawn to the average level of 20, which isn’t exactly the condition. It doesn’t cycle up and down to trend around 20 most of the time, but instead, it spends much of the time between 10 and 30.

Prior to 2015, the long term average of VIX since its inception was 20 and we heard the number 20 referenced with VIX often. ^VIX Chart

Since January 2015, we’ve seen the long term average decline to the 19 levels.  ^VIX Chart

So, 19 is the new 20.

What caused the downtrend in the long term average?

Obviously, it would take a very low level of readings to drive down the long term average of a volatility index introduced in 1993.

What happened in the past 5 years that impacted the prior 21 years of data so much to bring the 26-year average down?

A 5 year period of low implied volatility happened with an average of 15% and a low of 9.14%. Said another way; the past 5 years expected volatility priced into S&P 500 stock options has been about 25% lower than the prior two decades, or 75% of what we previously observed. Here is the trend for VIX from 2015 to today. A VIX level of 15 translates to implied volatility of 15% on the S&P 500. 
^VIX Chart

Is this a new low volatility regime?

Anything is possible, but I’m guessing the lower level of implied (expected) volatility may be driven by two facts that can both result in less concern for volatility.

  1. The current bull market that started in March 2009 is the longest bull market in history. It exceeded the bull market of the 1990s that lasted 113 months in terms of time, though still not as much gain as the 90s.
  2. The U.S. is in its longest economic expansion in history, breaking the record of 120 months of economic growth from March 1991 to March 2001, according to the National Bureau of Economic Research. However, this record-setting run observed GDP growth far slower than previous expansions.

The aged bull market and economic expansion can naturally lead to some level of complacency and expectation for less downside and tighter price trends. When investors are uncertain, their indecision shows up in a wide range of prices. When investors are smugger and confident, they are less indecisive and it’s usually after a smooth uptrend they expect to continue.

Is it another regime of irrational exuberance?

“Irrational exuberance” was the expression used by the former Federal Reserve Board chairman, Alan Greenspan, in a speech given during the dot-com bubble of the 1990s. The expression was interpreted as a warning that the stock market may have been overvalued. It was.

Irrational exuberance suggests investor enthusiasm drives asset prices up to levels that aren’t supported by fundamental financial conditions. The 90s ended with a Shiller PE Ratio over 40, far more than any other time in more than a century.

Is the stock market at a level of irrational exuberance?

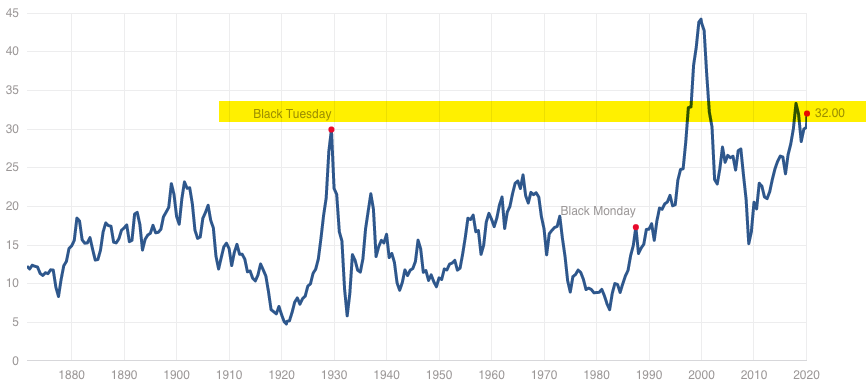
Maybe so, as this is the second-highest valuation in the past 150 years according to the Shiller PE.

shiller pe ratio are stocks overvalued

But, the driver here is inflation. When inflation rates are really low, we can justify a higher price to earnings ratio for stocks, so they say.

A new VIX average level of 19 translates to the implied volatility of 19% on the S&P 500 instead of the former after of 20%. It isn’t a huge range difference.

Looking over the full 26 years of implied volaltity, the more elevated levels in the past included the late 90s into around 2003, which elevated the average. Since then, we’ve seen more spikes up but not as many volatility expansions that stay high for longer periods. ^VIX Chart

A behavior of implied volatility I’ve observed over time is it spikes up very fast when the stock market drops and then trends back down more gradually as stocks trend back up.  For this reason, derivatives of volatility provide us an opportunity for asymmetric hedging.

I doubt this is a new lower long term volatility regime. My guess is we’ll see a very significant volatility expansion again at some point during the next bear market and economic recession. Historically we’ve observed trends that stretch far and wide swing back the other way, far and wide.

At a minimum, it’s no time for complacency.

Mike Shell is the Founder and Chief Investment Officer of Shell Capital Management, LLC, and the portfolio manager of ASYMMETRY® Global TacticalMike Shell and Shell Capital Management, LLC is a registered investment advisor in Florida, Tennessee, and Texas focused on asymmetric risk-reward and absolute return strategies and provides investment advice and portfolio management only to clients with a signed and executed investment management agreement. The observations shared on this website are for general information only and should not be construed as advice to buy or sell any security. Securities reflected are not intended to represent any client holdings or any recommendations made by the firm. Any opinions expressed may change as subsequent conditions change.  Do not make any investment decisions based on such information as it is subject to change. Investing involves risk, including the potential loss of principal an investor must be willing to bear. Past performance is no guarantee of future results. All information and data are deemed reliable but is not guaranteed and should be independently verified. The presence of this website on the Internet shall in no direct or indirect way raise an implication that Shell Capital Management, LLC is offering to sell or soliciting to sell advisory services to residents of any state in which the firm is not registered as an investment advisor. The views and opinions expressed in ASYMMETRY® Observations are those of the authors and do not necessarily reflect a position of  Shell Capital Management, LLC. The use of this website is subject to its terms and conditions.


Now, THIS is what a stock market top looks like!

Stock Market Risk is Elevated

I walked out the front door this morning with a cup of coffee to take the pup out and pick up my weekly Barron’s in the driveway.

When I got inside, I opened it up and BEHOLD! 

Barrons cover signal indicator

Gracing the cover of Barron’s is:

“Dow 30,000 THE MARKET’S BIG RUN: Why stocks could vault past the milestone”

I haven’t read the article, as the cover is signal enough for me.

The Magazine cover indicator says that the cover story on the major business magazines is often a contrary indicator.

I’m sure they made a great case for higher stock prices.

The trend is your friend until it ends.

Markets can remain irrational longer than you expect, but there are times when markets overreact and the probability of a trend reversal becomes more and more likely.

This looks like one of those times.

I searched for other headlines:

Dow 30,000 Barron's

I found a few.

barron's dow 30,000 melt up won't stop

And as a friend on Twitter pointed out, it’s way ahead of schedule. In 2017 Barron’s said :

“Next Stop Dow 30,000” and followed with “the Dow could surpass 30,000 by the year 2025.”

dow 30,000 2017 barron's call

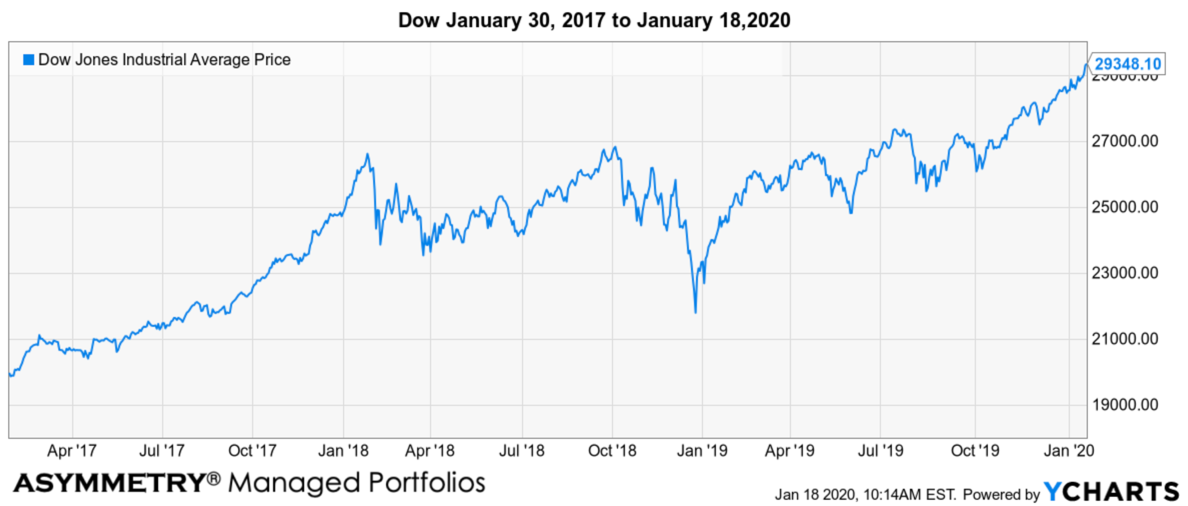
So far, Barron’s was right on that prediction. Below is the Dow price trend since the cover in 2017. But, consider the Dow is near 30,000 five years earlier than expected. 

dow performance barron's 2017 30,000 call to 2020

Notwithstanding the Dow is only about 2% from 30,000, the articles are calling for more uptrend. Sure, it’s possible this calm uptrend will continue to drift up without a volatility expansion, but it’s become much less likely as I see it.

I love me some good quiet uptrends, but all good things eventually come to an end.

In the case of equity market trends, these calm uptrends usually end when the majority least expect it.

That seems to be the case now.

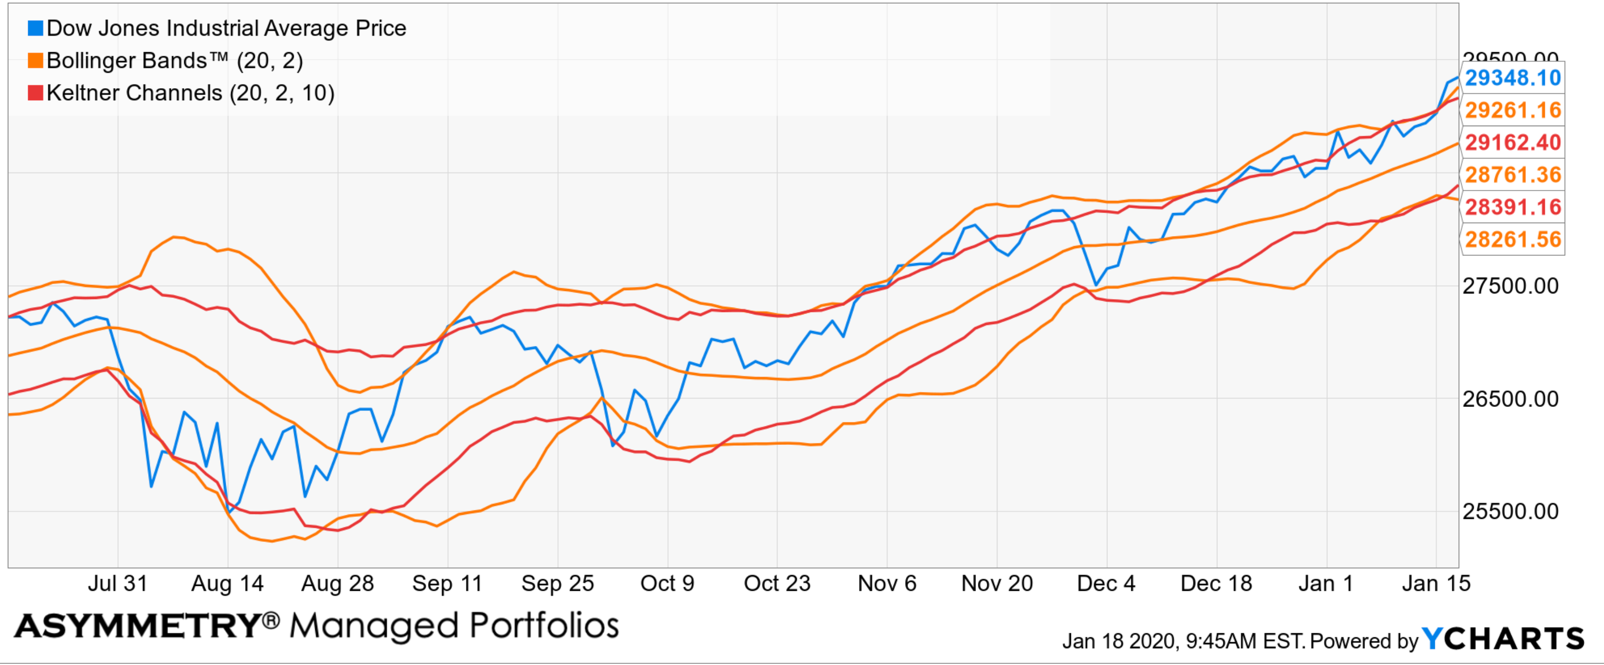
Right now, the Dow Jones Industrial Average is signaling the higher likelihood of a volatility expansion. I say this because the Dow price trend has drifted above its average true range volatility channel and the Bollinger Band® lines plotted two standard deviations away from a 20-day simple moving average. These volatility measures visually illustrate volatility expansions and contractions and signal when a price trend moves outside it’s “normal” range. I call it “the normal noise of the market.” Periods of low volatility are often followed by volatility expansions.

dow 30,000 trend

My observations this week seem especially important because risk levels have become more elevated, yet individual investor sentiment is extremely optimistic.

As I’ve had very high exposure to stocks, I have now taken profits in our managed portfolios.

It’s a good time to evaluate portfolio risk levels for exposure to the possibility of loss and determine if you are comfortable with it. 
For more information on my observations that risk is becoming elevated, read:

You probably want to invest in stocks

Investor sentiment is dialed up with stock trends

Is gold a good buy right now?

What’s the stock market going to do next?

Questions, comments, need help? email me here.

Mike Shell is the Founder and Chief Investment Officer of Shell Capital Management, LLC, and the portfolio manager of ASYMMETRY® Global TacticalMike Shell and Shell Capital Management, LLC is a registered investment advisor in Florida, Tennessee, and Texas focused on asymmetric risk-reward and absolute return strategies and provides investment advice and portfolio management only to clients with a signed and executed investment management agreement. The observations shared on this website are for general information only and should not be construed as advice to buy or sell any security. Securities reflected are not intended to represent any client holdings or any recommendations made by the firm. Any opinions expressed may change as subsequent conditions change.  Do not make any investment decisions based on such information as it is subject to change. Investing involves risk, including the potential loss of principal an investor must be willing to bear. Past performance is no guarantee of future results. All information and data are deemed reliable but is not guaranteed and should be independently verified. The presence of this website on the Internet shall in no direct or indirect way raise an implication that Shell Capital Management, LLC is offering to sell or soliciting to sell advisory services to residents of any state in which the firm is not registered as an investment advisor. The views and opinions expressed in ASYMMETRY® Observations are those of the authors and do not necessarily reflect a position of  Shell Capital Management, LLC. The use of this website is subject to its terms and conditions.