After prices have fallen, I start looking for signs of a potential countertrend and divergence.
“Be fearful when others are greedy and greedy when others are fearful.”
– Warren Buffett
If you want to be like Warren Buffett, you’re probably enjoying the recent rout in stocks.
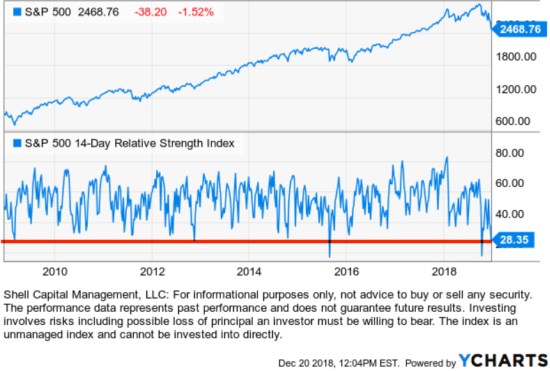
The U.S. stock market is now oversold based on short-term relative strength measures. Our 14 day RSI reading has declined to 28, which is at oversold levels that have historically signaled countertrend reversals up.
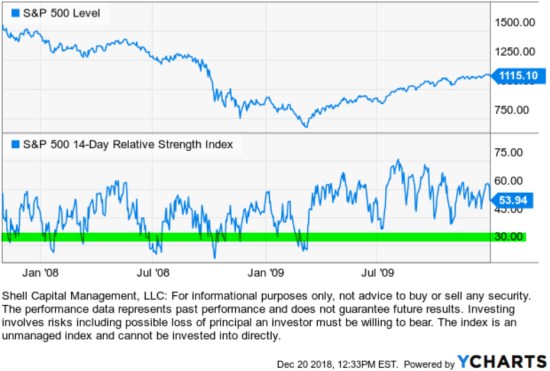
The trouble is, market prices can reach oversold levels and just keep getting more oversold for a while. For example, when the S&P 500 declined -56% from October 9, 2007 to March 9, 2009 it got deeply oversold several times as the price trend cycled up and down. We can visually observe the Relative Strength Index spent more time in the lower range as prices were falling. Then in 2009 as prices finally trended up momentum stayed elevated.
Another indication of an oversold condition I observed today is when we draw bands of ATR around the price trend to measure volatility expansion. ATR is the average true range of the price over the past 14 days, a short-term measure of range and volatility. When the prices spread out, so does the band as it indicates volatility expansion. Today the price of the S&P 500 declined below the band, so the recent price action on the downside is an outlier by this measure. As you can see, the last time the price traded below the volatility band was the February low. What this observation suggests is the price has moved down low enough that it’s a short-term outlier, so it should trend the other way (at least temporarily).

Stock market breadth indicators measure the participation of a stock advance or decline. The percent of stocks above their 200 day moving average tells us how many stocks are still in longer-term uptrends vs. downtrends. After today, only 18% or 89 stocks are above their 200-day trend. It’s now down to the low level reached during the August 2015 to January 2016 lows. After it reached this low in 2016, stocks went on to trend up to a new all-time high.

At this point, the S&P 500 and Dow Jones have declined -15% from their September high. If this is a cyclical “correction” within an ongoing bull market, we should see prices trend up soon and eventually trend to a higher high.
However, even if this is the early stages of a bear market that declines over -20% or a big bear market like 2000-2003 and 2007-2009 that declines -50%, the stock market will still likely swing up and down along the way. As we saw in the above chart that included the last bear market, the stock indexes swing up and down 10% to 20% on their way down just as they do on their way up. Some of these swings can be traded, some not so well. This recent decline since September was probably more challenging for tactical traders. Though the stock market got overbought enough in September to signal reducing exposure near the high, after prices fell to a lower level and signaled a countertrend entry, the price trend has since kept falling. But, at this point, countertrend systems now have a stronger entry signal than before. The challenge with countertrends is a trend can always continue trending farther. That is, oversold can get more oversold until sellers have been exhausted and buyers are attracted by the lower prices. Prices keep trending until the supply and demand shifts direction.
By the way, on September 1st I shared the countertrend signal reduce exposure in The U.S. stock market was strong in August, but… when I concluded:
The bottom line is the broad stock indexes are trending up and led by a few strong sectors, but they’ve reached levels that my countertrend momentum systems suggest the risk of at least a temporary decline is elevated.
Because of this, I reduced my exposure to only 70% long stocks around the September high. However, we still participated in the October rout more than I planned because the 30 % of stocks we held that were former leaders declined the most. I then started adding exposure to stocks at lower prices and so far, they’ve only trended lower. Everything is always probabilistic, never a sure thing.
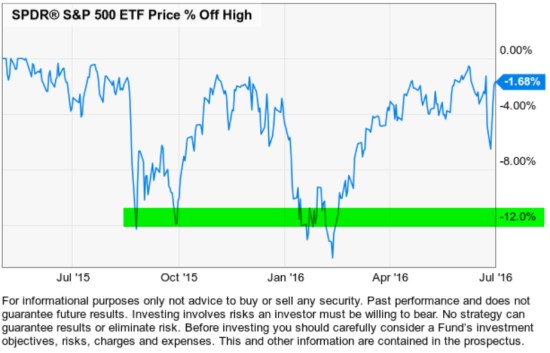
Anytime we see stock prices decline more than -10% the narrative we hear in the media changes from “correction” to speculation of a “bear market”. As I mentioned a few days ago, this is the longest bull market in U.S. history and the second highest valuation. As such, anything can happen. However, at this point, this decline of -15% is around the range of the 2015-16 decline and the 2011 decline.
Here is what the August 2015 to January 2016 declines looked like.
In 2011, the correction was the deepest we’ve seen since this bull market started in March 2009.

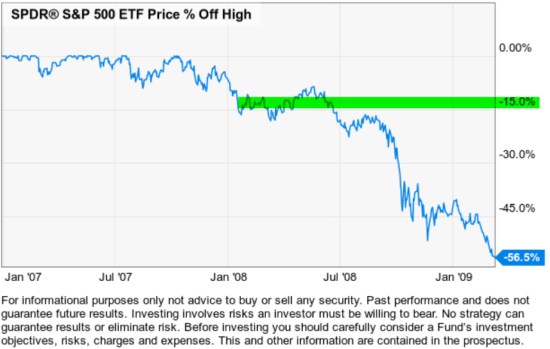
To put it all in context of a major bear market like the last one 2007 to 2009 when the stock index declined -56% over two years and took another four years to return to its 2007 high, I marked -15% green. The stock market was already down -15% from its October 2007 high by January 2008 – two months later. The bear market had many countertrend swings back up giving many who were holding some hope, but it ultimately cycled its way down to cut stock portfolio values in half.
Many say they are “long-term investors.” The long-term investors who buy and hold stocks or the stock indexes have to be willing to hold through an astonishing loss like -50%.
I am not willing to hold on to losing positions near that long or let my losses get that large. But even for a tactical portfolio manager like myself, I have to be willing to expose our capital to risk and endure some drawdowns. I just choose to limit my drawdowns by predefining risk through my exits and/or hedging. I prefer to avoid the price action below the green line in the chart above.
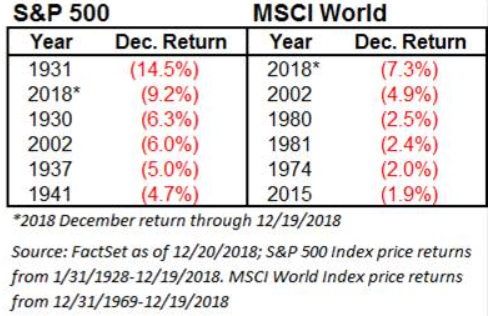
This has been one of the worst ends of the year in history. In fact, as of now, this is the 2nd worst December in S&P 500 history. It is the worst in MSCI World global stock index history.
The only good news I can share is the stock market has reached an oversold level based on short-term momentum and investor sentiment measures are at extreme bearish levels. Both are contrary indicators. These indicators normally signal a reversal back up at some point. Although, if enough investors wish they had sold, they may sell as prices trend up, so the trend could swing around for a while. It means volatility may continue for some time.
Todays AAII Investor Sentiment Survey shows optimism and pessimism remain outside their typical ranges: bullish sentiment is unusually low and bearish is unusually high. Historically, both have been followed by higher-than-median six- and 12-month returns for the S&P 500 index, particularly unusually low optimism. Again, this is a contrary indicator as investors as a crowd tend to feel the wrong feeling at the wrong time at extremes.

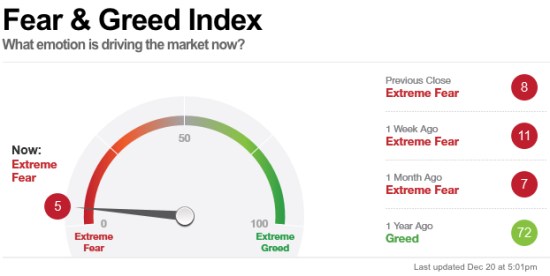
The fear and greed index that measures investor sentiment using multipe indicators is down to five, which is about the most extreme fear level it’s ever been.
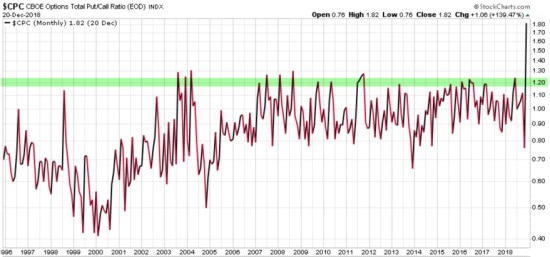
One of the indicators in the Fear and Greed Index is the Put/Call Ratio is used as a contrarian indicator to gauge bullish and bearish extremes. The sentiment is considered excessively bearish when the Put/Call Ratio is trading at relatively high levels. One a normal day, the Put/Call Ratio is less than one since options traders tend to trade calls more than puts. Today the Put/Call Ratio is at 1.82, so options traders are buying many more puts for protection against a market decline or as a directional bet. Put/Call Ratio is at 182% is an extremely high level, the highest ever recorded. The Put/Call Ratio data goes back to 1995 and 1.2 has historically been an extreme high.
The bottom line is, fear of lower prices is driving the stock market, and the bears have been in control. However, sentiment has reached such an extreme we would expect to see a countertrend reversal up at least temporarily. Even if this is the early stage of a lower low and a bear market, it will include many swings up and down along the way. What the trend does once it finally drifts up will be telling of the bigger picture. Bear and bull markets are both a process, not an event. In a bear market, prices trend up down to lower lows and lower highs. The swings along the way result in fear of missing out and the fear of losing more money which leads to overbought and oversold conditions.
I believe risk must be actively managed through increasing and decreasing exposure to the possibility of loss because markets are risky. The stock market can decline -50% or more and take years to trend back up, so I believe drawdown controls are necessary to preserve capital rather than allowing losses to get too large. Once a portfolio declines more than -20%, the losses grow exponentially and become harder to recover.
We’ll see how it all plays out. We’re still waiting to see those investors who are “greedy when others are fearful” overwhelm the sellers enough to change the trend.
Mike Shell is the Founder and Chief Investment Officer of Shell Capital Management, LLC, and the portfolio manager of ASYMMETRY® Global Tactical.
The observations shared on this website are for general information only and are not specific advice, research, or buy or sell recommendations for any individual. Investing involves risk including the potential loss of principal an investor must be willing to bear. Past performance is no guarantee of future results. The presence of this website on the Internet shall in no direct or indirect way raise an implication that Shell Capital Management, LLC is offering to sell or soliciting to sell advisory services to residents of any state in which the firm is not registered as an investment advisor. Use of this website is subject to its terms and conditions.

Pingback: To Know Where You’re Going, Look at Where You’ve Been: The 2018 Year in Review « ASYMMETRY® Observations