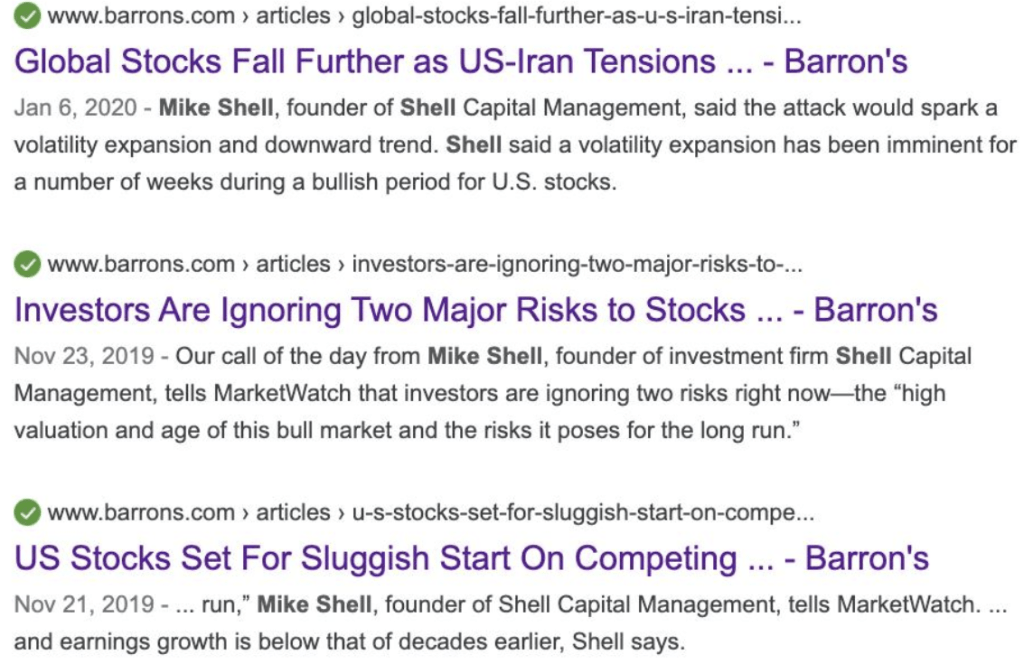
If we want to profit from the madness of crowds, we necessarily need to believe and do different things than the crowd at the extremes.
You may have heard the stock market was down a lot yesterday. I consider yesterday’s price action a black swan event. The -8% one-day decline was the worst day for S&P500 since 2008 and the 19th worst day since 1928.
The popular S&P 500 stock index dropped -7.6%, which was enough to trigger a circuit breaker to halt trading for the first time in 23 years. Circuit breakers are the thresholds when, if reached during a single-day decline in the S&P 500, trading is halted. Circuit breakers halt trading on US stock markets during dramatic price declines and are set at 7%, 13%, and 20% of the closing price for the previous day.
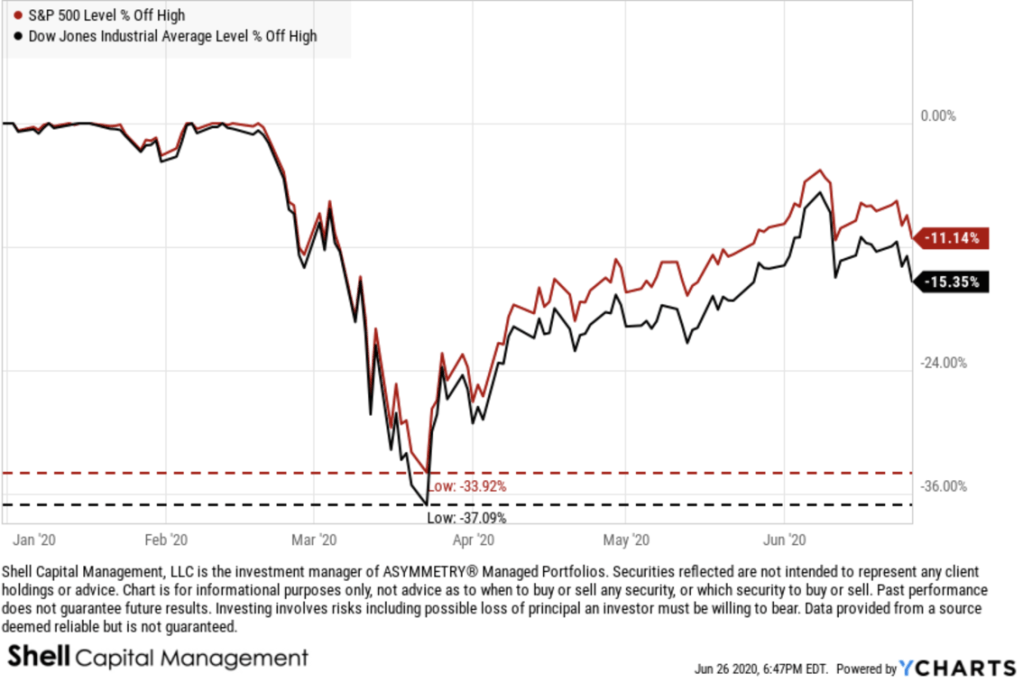
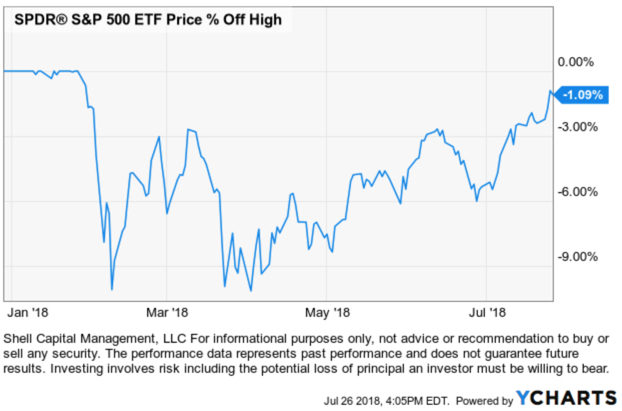
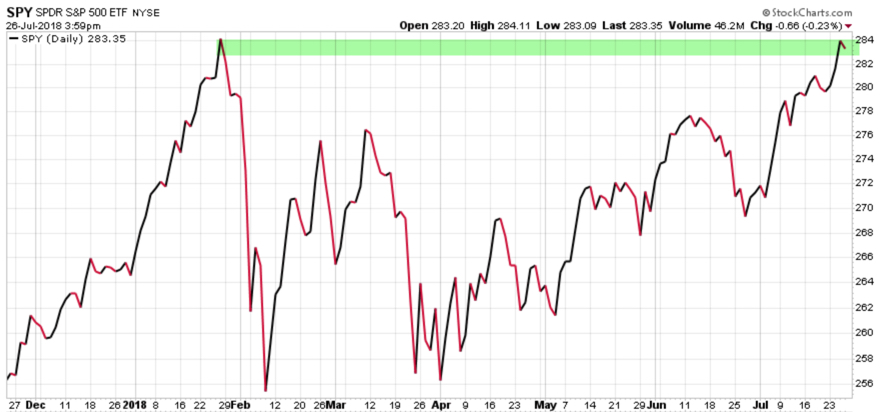
After yesterday’s waterfall decline, the price trend of the S&P 500 lost the 24% gain it had achieved a month ago.
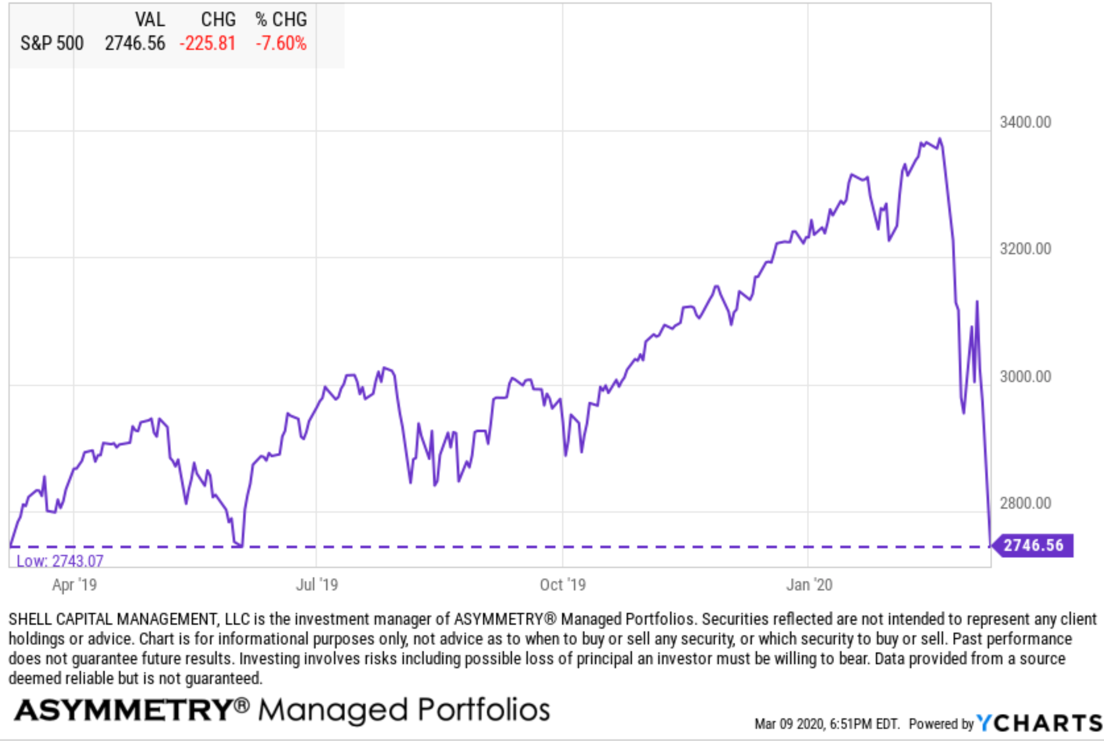
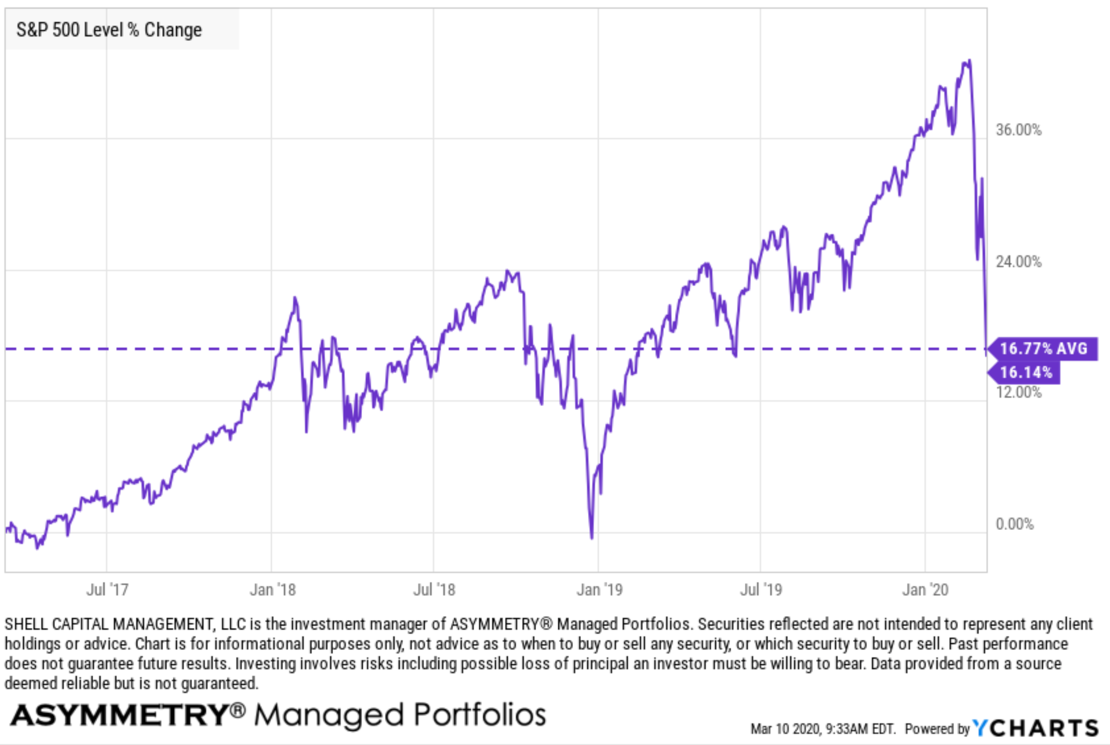
Interestingly, we’re seeing “mean reversion” as the SPX is now all the way back to the same level it reached in January 2018. In investment management, mean reversion is the theory that a stock’s price will tend to move to the average price over time. This time it did.
US equity investors would have been better off believing the market was too overvalued then and shifting to short term Treasuries. But, who would have been able to do that? Who wouldn’t have had the urge to jump back in on some of the enormous up days the past two years? There’s the real challenge: investor behavior. And yes, some may even look back and say they knew then but didn’t do anything. If we believed it then, we can go back and read out notes we made at the time. But, it wouldn’t matter if a belief isn’t acted on. I’m a trigger puller, I pull the trigger and do what I believe I should do in pursuit of asymmetric risk/reward for asymmetry.
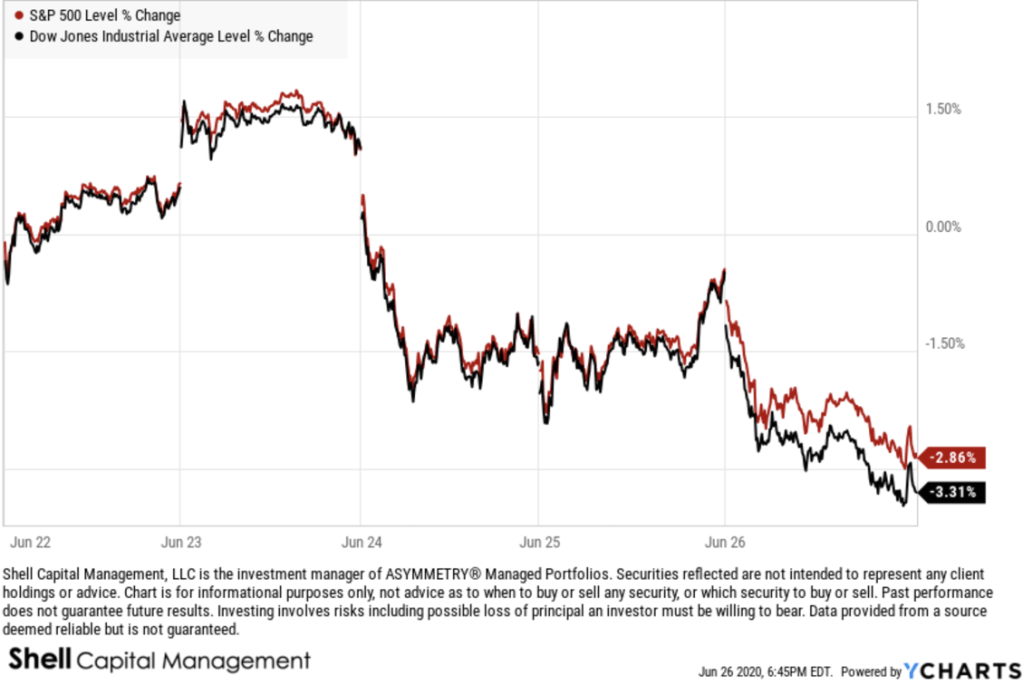
Dow Jones is down -16.4% YTD at this point.
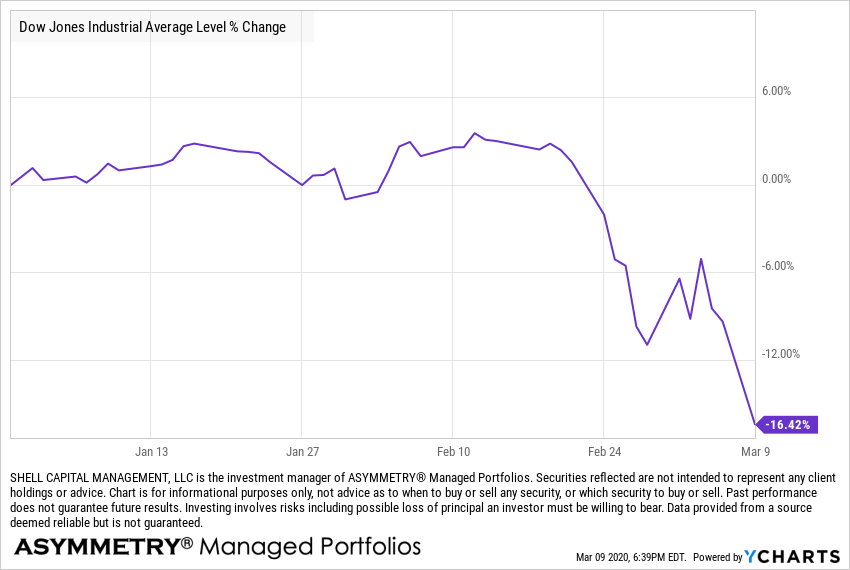
The Dow Jones has also experienced some “mean reversion” over the 3-year time frame.

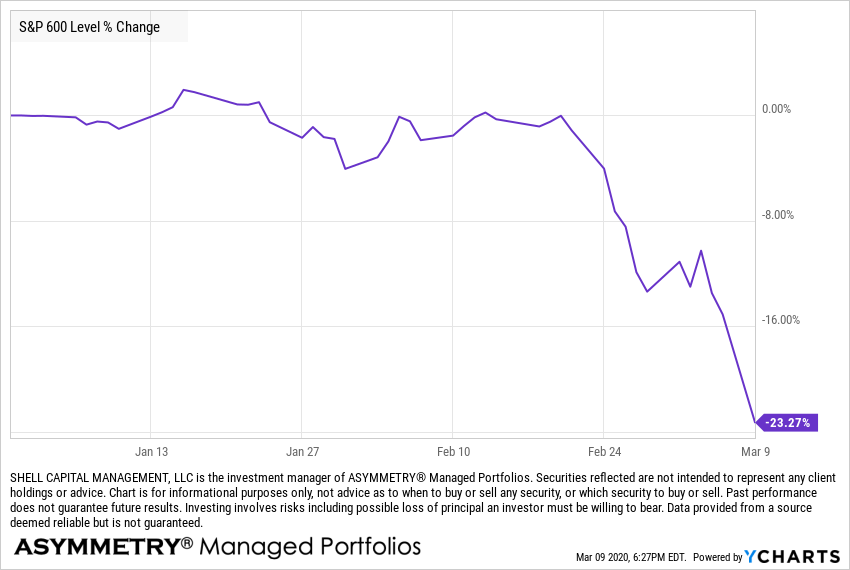
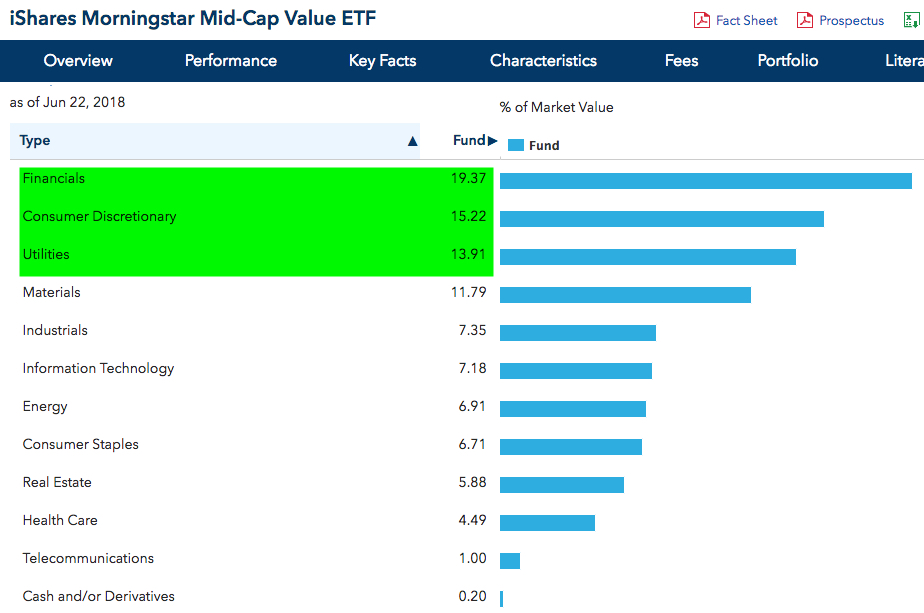
Mid-cap stocks, as measured by the S&P 400, are down, even more, this year, in the bear market territory.

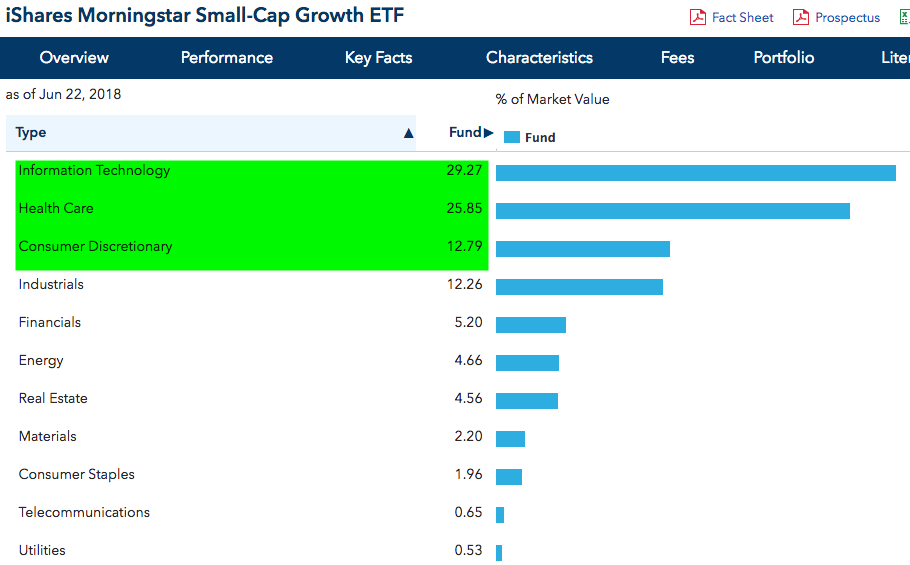
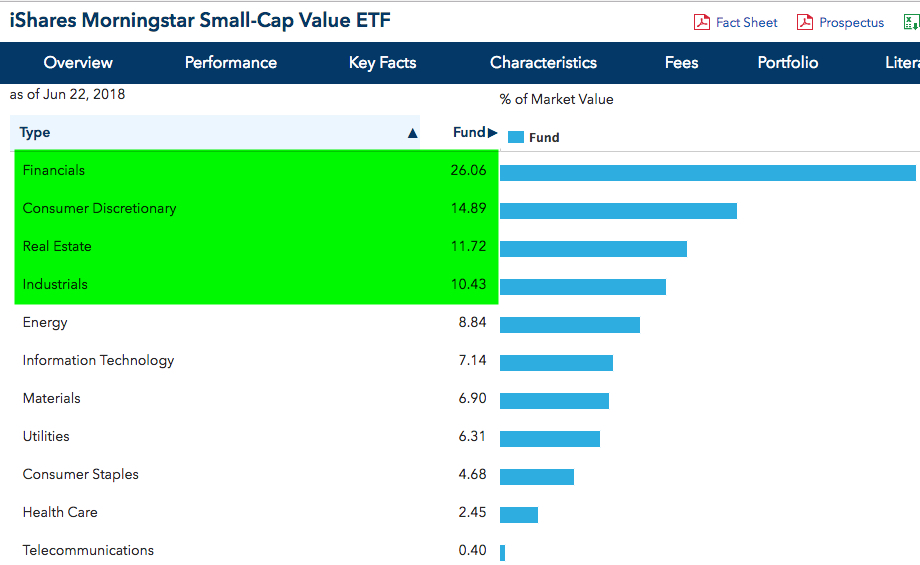
Small-cap stocks, considered even riskier, are now down -23% in 2020.
Clearly, the speed and magnitude of this waterfall decline have been impressive since the February 19th top just three weeks ago. Decreases in these broad stock indexes of -20% are indications of a strong desire to sell and yesterday, panic selling.
So, -20% from peak, the stock market decline has reached bear market territory and is now nearly in-line with the typical market-sell off since 1928 that preceded an upcoming recession.
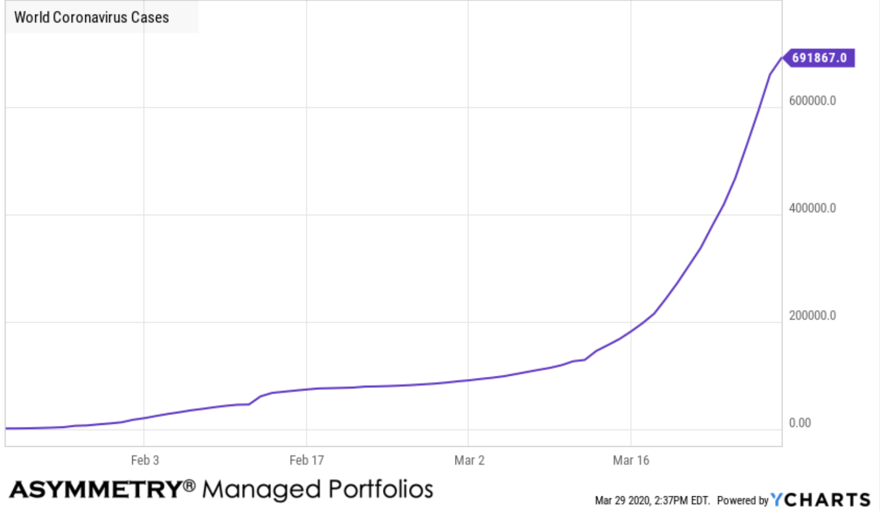
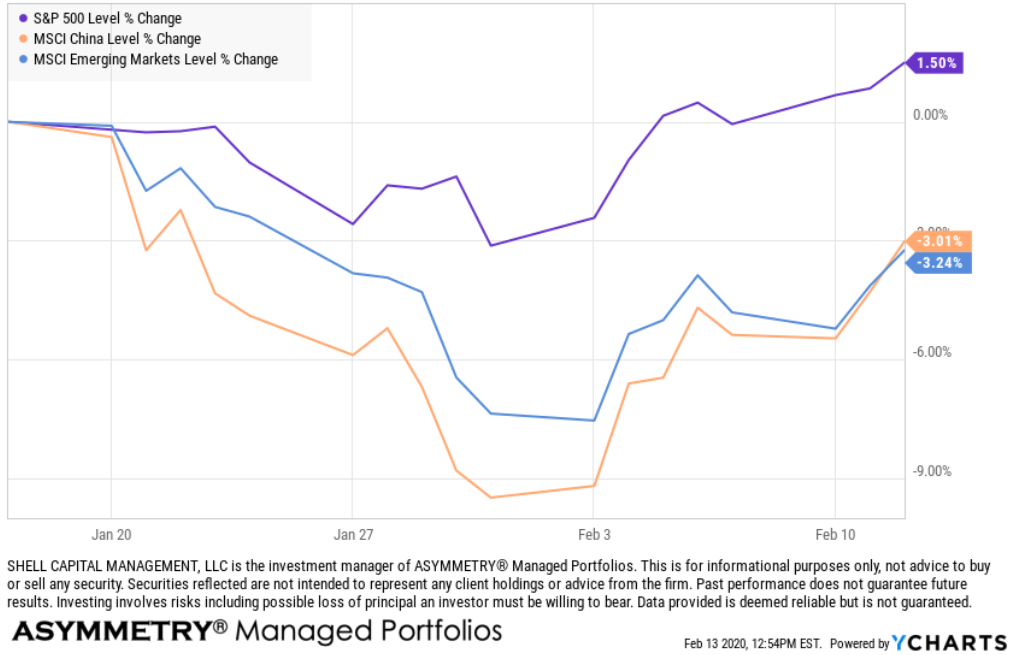
Global Equity Market Decline
And by the way, it wasn’t just US equities, the selling pressure was global with some markets like Russia, Australia, Germany, Italy, and Brazil down much more.

Extreme Investors Fear is Driving the Stock Market
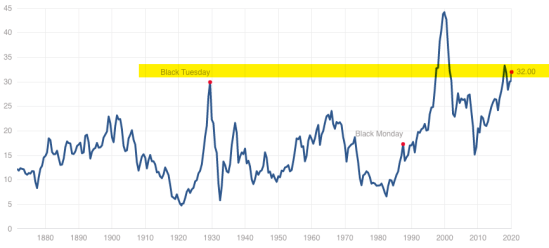
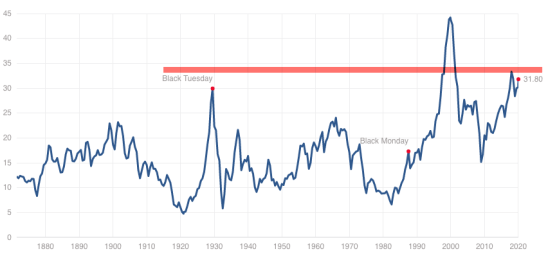
Indeed, after Extreme Fear is driving the stock market according to investor sentiment measures. A simple gauge anyone can use is the Fear & Greed Index, which measures seven different indicators.
As of today, it shows the appetite for risk is dialed back about as close to zero it can get.
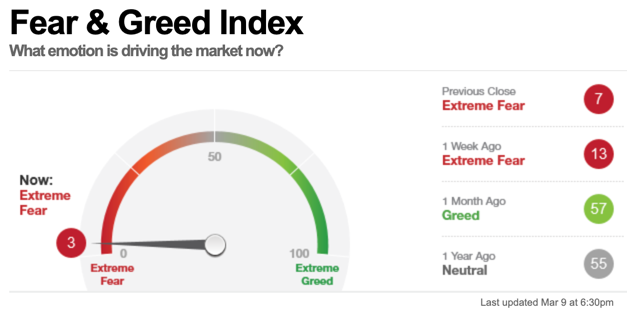
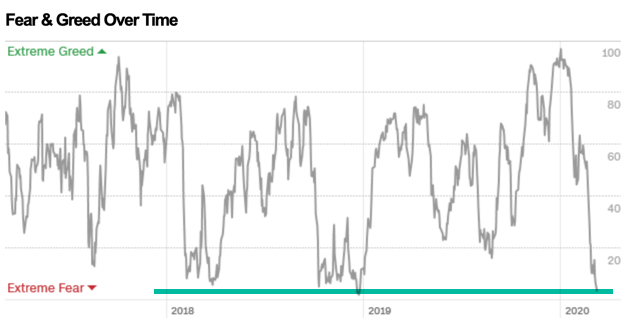
In the next chart, we can observe the relative level of the gauge to see where it is comparable to the past. While this extreme level of fear can stay elevated for some time, it has now reached the lowest levels of 2018. It’s important to note this isn’t a market timing indicator, and it does not always provide a timely signal. As you can see, at prior extreme lows such as this, the fear remained extreme for some time as the indicator oscillated around for a while. It’s a process, not an event. Investor sentiment measures like this tell us investors are about as scared as they get at their extreme level of fear is an indication those who wanted to sell may have sold.
Monitoring Market Conditions
My objective is asymmetric investment returns, so I look to find an asymmetric risk-reward in a new position. An asymmetric return profile is created by a portfolio of asymmetric risk-reward payoffs. For me, these asymmetric payoffs are about low-risk entries created through predefined exits and how I size the positions at the portfolio level. As such, I’ve been entering what I consider to be lower risk points when I believe there is potentila for an asymmetric payoff. Sometimes these positions are entering a trend that is already underway and showing momentum. The market is right most of the time, but they get it wrong at extremes on both ends. I saw that because of my own personal observations for more than two decades of professional money management, which is confirmed, markets and behavior really haven’t changed.
Humphrey B. Neill, the legendary contrarian whose book “The Art of Contrary Thinking,” published in 1954, including the same observations nearly seventy years ago.
“The public is right more of the time than not ” … but “the crowd is right during the trends but wrong at both ends.”
As market trends reverse and develop, we see a lot of indecision about if it will keep falling or reverse back up, which results in volatility as prices spread out wider driven by this indecisiveness. Eventually, the crowd gets settled on once side and drives the price to trend more in one direction as the majority of capital shifts enough demand to overwhelm the other side.
Risk Manager, Risk Taker
At these extremes, I have the flexibility to shift from a trend following strategy to a countertrend contrarian investment strategy. My ability to change along with conditions is why I am considered an “unconstrained” investment manager. I have the flexibility to go anywhere, do anything, within exchange-traded securities. By “go anywhere,” I mean cash, bonds, stocks, commodities, and alternatives like volatility, shorting/inverse, real estate, energy MLPs, etc. I give myself as broad of an opportunity set as possible to find potentially profitable price trends. So, as prices have been falling so sharply to extremes, I was entering new positions aiming for asymmetric risk/reward. I was able to buy at lower prices because I had also reduced exposure at prior higher prices. As trends became oversold as measured by my systems, I started increasing exposure for a potential countertrend.
On ASYMMETRY® Observations, I’m writing for a broad audience. Most of our clients read these observations as do many other investment managers. My objective isn’t to express any detail about my specific buying and selling, but instead overall observations of market conditions to help you see the bigger picture as I do. As long time readers know, I mostly use the S&P 500 stock index for illustration, even though I primarily trade sectors, stocks, countries; an unconstrained list of global markets. I also share my observations on volatility, mostly using the VIX index to demonstrate volatility expansions/contractions. At the extremes, I focus a lot of my observations on extremes in investor sentiment and breadth indicators to get an idea of buying and selling pressure that may be drying up.
Market Risk Measurement
One of my favorite indicators to understand what is going on inside the stock market is breadth. To me, breadth indicators are an overall market risk measurement system. Here on ASYMMETRY® Observations, I try to show these indicators as simple as possible so that anyone can understand.
If we want to profit from the madness of crowds, we necessarily need to believe and do different things than the group at the extremes.
One of my favorite charts to show how the market has de-risked or dialed up risk is the percent of S&P 500 stocks above the moving average. As you see in the chart, I labeled the high range with red to signal a “higher risk” zone and the lower level in green to indicate the “lower risk” zone.

I consider these extremes “risk” levels because it suggests to me after most of the stocks are already in long term uptrends, the buying enthusiasm may be nearing its cycle peak. And yes, it does cycle up and down, as evidenced by the chart. As of yesterday’s close, only 17% of the S&P 500 stocks are trending above their 200-day moving average, so most stocks are in a downtrend. That’s not good until it reaches an extreme level, then it suggests we may be able to profit from the madness of crowds as they tend to overreact at extremes. The percent of S&P 500 stocks above the longer-term moving average has now declined into the green zone seen in late 2018, the 2015-16 period, 2011, but not as radical as 2008 into 2009. If this is the early stage of a big bear market, we can expect to see it look more like the 2008-09 period.
We can’t expect to ever know if equities will enter a bear market in advance. If you base your trading and investment decisions on the need to predict what’s going to happen next, you already have a failed system. You are never going to know. What I do, instead, is focus on the likelihood. More importantly, I predefined the amount of risk I’m willing to take and let it rip when the odds seem in my favor. After that, I let it all unfold. I know I’ll exit if it falls to X, and my dynamic risk management system updates this exit as the price moves up to eventually take profits.
Zooming in to the shorter trend, the percent of stocks above their 50 day moving average has fallen all the way down to only 5% in an uptrend. This means 95% of the S&P 500 stocks are in shorter-term downtrends. We can interpret is as nearly everyone who wants to sell in the short term may have already sold.
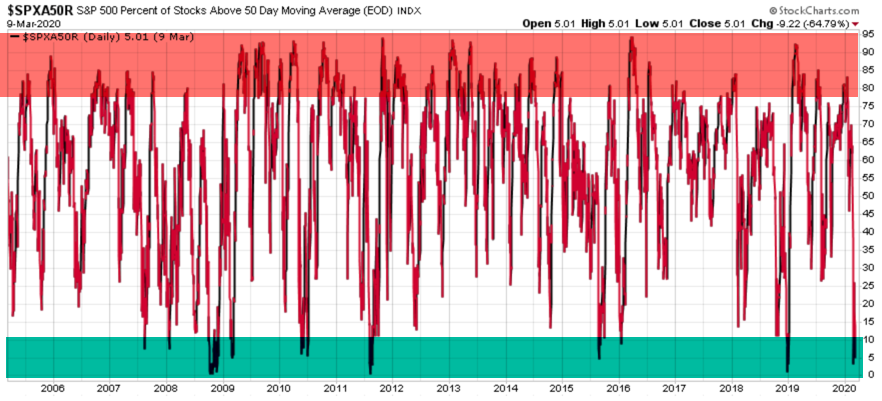
I can always get worse. There is no magical barrier at this extreme level that prevents it from going to zero stocks in an uptrend and staying there a long time as prices fall much more. But, as you see in the charts, market breadth cycles up and down as prices trend up and down.
If we are in the early stage of a big bear market, I expect there will be countertrends along the way if history is a guide. I’ve tactically traded through bear markets before, and the highlight of my career was my performance through the 2007-09 period. I didn’t just exit the stock market and sit there, I traded the short term price trends up and down. If someone just exited the stock market and sit there, that may have been luck. If we entered and exited 8 or 10 different times throughout the period with a positive asymmetry of more significant profits than losses, it may have required more skill. I like my managed portfolio to be in synch with the current risk/reward characteristics of the market. If that is what we are achieving, we may have less (or hedged) exposure at the peak and more exposure after prices fall. I believe we should always be aware of the potential risk/reward the market itself is providing, and our investment strategy should dynamically adapt to meet these conditions.
If we want to profit from the madness of crowds, it means we have some cash or the equivalent near trend highs and reenter after prices fall. It may also be achieved by hedging near highs and using profits from the hedge to increase exposure after prices have dropped. It sounds like a contrarian investor. To be a contrarian investor at extremes to profit from a countertrend, we study crowd behavior in the stock market and aim to benefit from conditions where other investors/traders act on their emotions. These extremes of fear and greed are seen at major market turning points, presenting the disciplined contrarian with opportunities to both enter and exit the market.
This crowd psychology has been observed for many decades, and unfortunately, investors and traders are excellent lab rates to study the behavior.
Believe it or not, 179 years ago, in 1841, Charles Mackay published his book “Extraordinary Popular Delusions and the Madness of Crowds” in which discussing the South Sea Bubble and Dutch Tulip Mania as examples of this mass investment hysteria. People haven’t changed. As a crowd, we the people still underreact to initial information and then overreact at the extremes.
As Mackay observed nearly two centuries ago:
“Men, it has been well said, think in herds; it will be seen that they go mad in herds, while they only recover their senses slowly, and one by one.”
Once people begin to go with the crowd, their thinking can become irrational and driven by the emotional impulses of the crowd rather than on their own individual situation.
According to studies like DALBAR’s Quantitative Analysis of Investor Behavior (QAIB), individual investors have poor results over the long haul. QAIB has measured the effects of investor decisions to buy, sell and switch into and out of mutual funds over short and long-term timeframes since 1994 and finds people tend to do the wrong things at the wrong time. If we want to create different results from the majority, we must necessarily believe and do things differently.
At this point, we’ve seen fund flows from stocks to bonds reach extreme levels across multiple time frames as panic selling set in. I’m glad to say, while imperfect as to timing, I have done the opposite by shifting to short term US Treasuries at the prior high stock prices and then started rebuying stocks last week. Of course, I have predetermined points I’ll exit them if they fall, so I remain flexible and may change direction quickly, at any time.
I’m seeing a lot of studies showing that history suggests single-day waterfall declines like yesterday were followed by gains over the next few weeks. Rather than hoping past performance like that simply repeats, I prefer to measure the current risk level and factor in existing conditions.
It’s important to understand, as. I have pointed out many times before, that the US stock market has been in a very aged bull market that has been running 11 years now. And the longest on record. The US is also in the longest economic expansion in history, so we should be aware these trends will eventually change. But, when it comes to the stock market, longer trends are a process, not an event. Longer trends unfold as many smaller swings up and down along the way that may offer the potential for flexible tactical traders to find some asymmetry from the asymmetric risk/reward payoffs these conditions may create.
It’s also important to be aware the volatility expansion and waterfall decline the past three weeks seems to indicate a fragile market structure with a higher range of prices, so we’re likely to observe turbulence for some time. These conditions can result in amplified downtrends and uptrends.
Falling prices create forced selling by systematic investment managers similar to what we saw in the December 2018 market crash. As I’ve seen signals from my own systematic trend following and momentum systems shift, it’s no surprise to see some increased selling pressure that may be helped by more money in these programs.
We are in another period of extremes driven by the “madness of crowds,” and my plan is to apply my skills and experience with the discipline to tactically operate through whatever unfolds.
Mike Shell is the Founder and Chief Investment Officer of Shell Capital Management, LLC, and the portfolio manager of ASYMMETRY® Global Tactical. Mike Shell and Shell Capital Management, LLC is a registered investment advisor in Florida, Tennessee, and Texas. Shell Capital is focused on asymmetric risk-reward and absolute return strategies and provides investment advice and portfolio management only to clients with a signed and executed investment management agreement. The observations shared on this website are for general information only and should not be construed as advice to buy or sell any security. Securities reflected are not intended to represent any client holdings or any recommendations made by the firm. I observe the charts and graphs to visually see what is going on with price trends and volatility, it is not intended to be used in making any determination as to when to buy or sell any security, or which security to buy or sell. Instead, these are observations of the data as a visual representation of what is going on with the trend and its volatility for situational awareness. I do not necessarily make any buy or sell decisions based on it. Any opinions expressed may change as subsequent conditions change. Do not make any investment decisions based on such information as it is subject to change. Investing involves risk, including the potential loss of principal an investor must be willing to bear. Past performance is no guarantee of future results. All information and data are deemed reliable but is not guaranteed and should be independently verified. The presence of this website on the Internet shall in no direct or indirect way raise an implication that Shell Capital Management, LLC is offering to sell or soliciting to sell advisory services to residents of any state in which the firm is not registered as an investment advisor. The views and opinions expressed in ASYMMETRY® Observations are those of the authors and do not necessarily reflect a position of Shell Capital Management, LLC. The use of this website is subject to its terms and conditions.


You must be logged in to post a comment.