Nothing drives investor sentiment like a strong price trend.
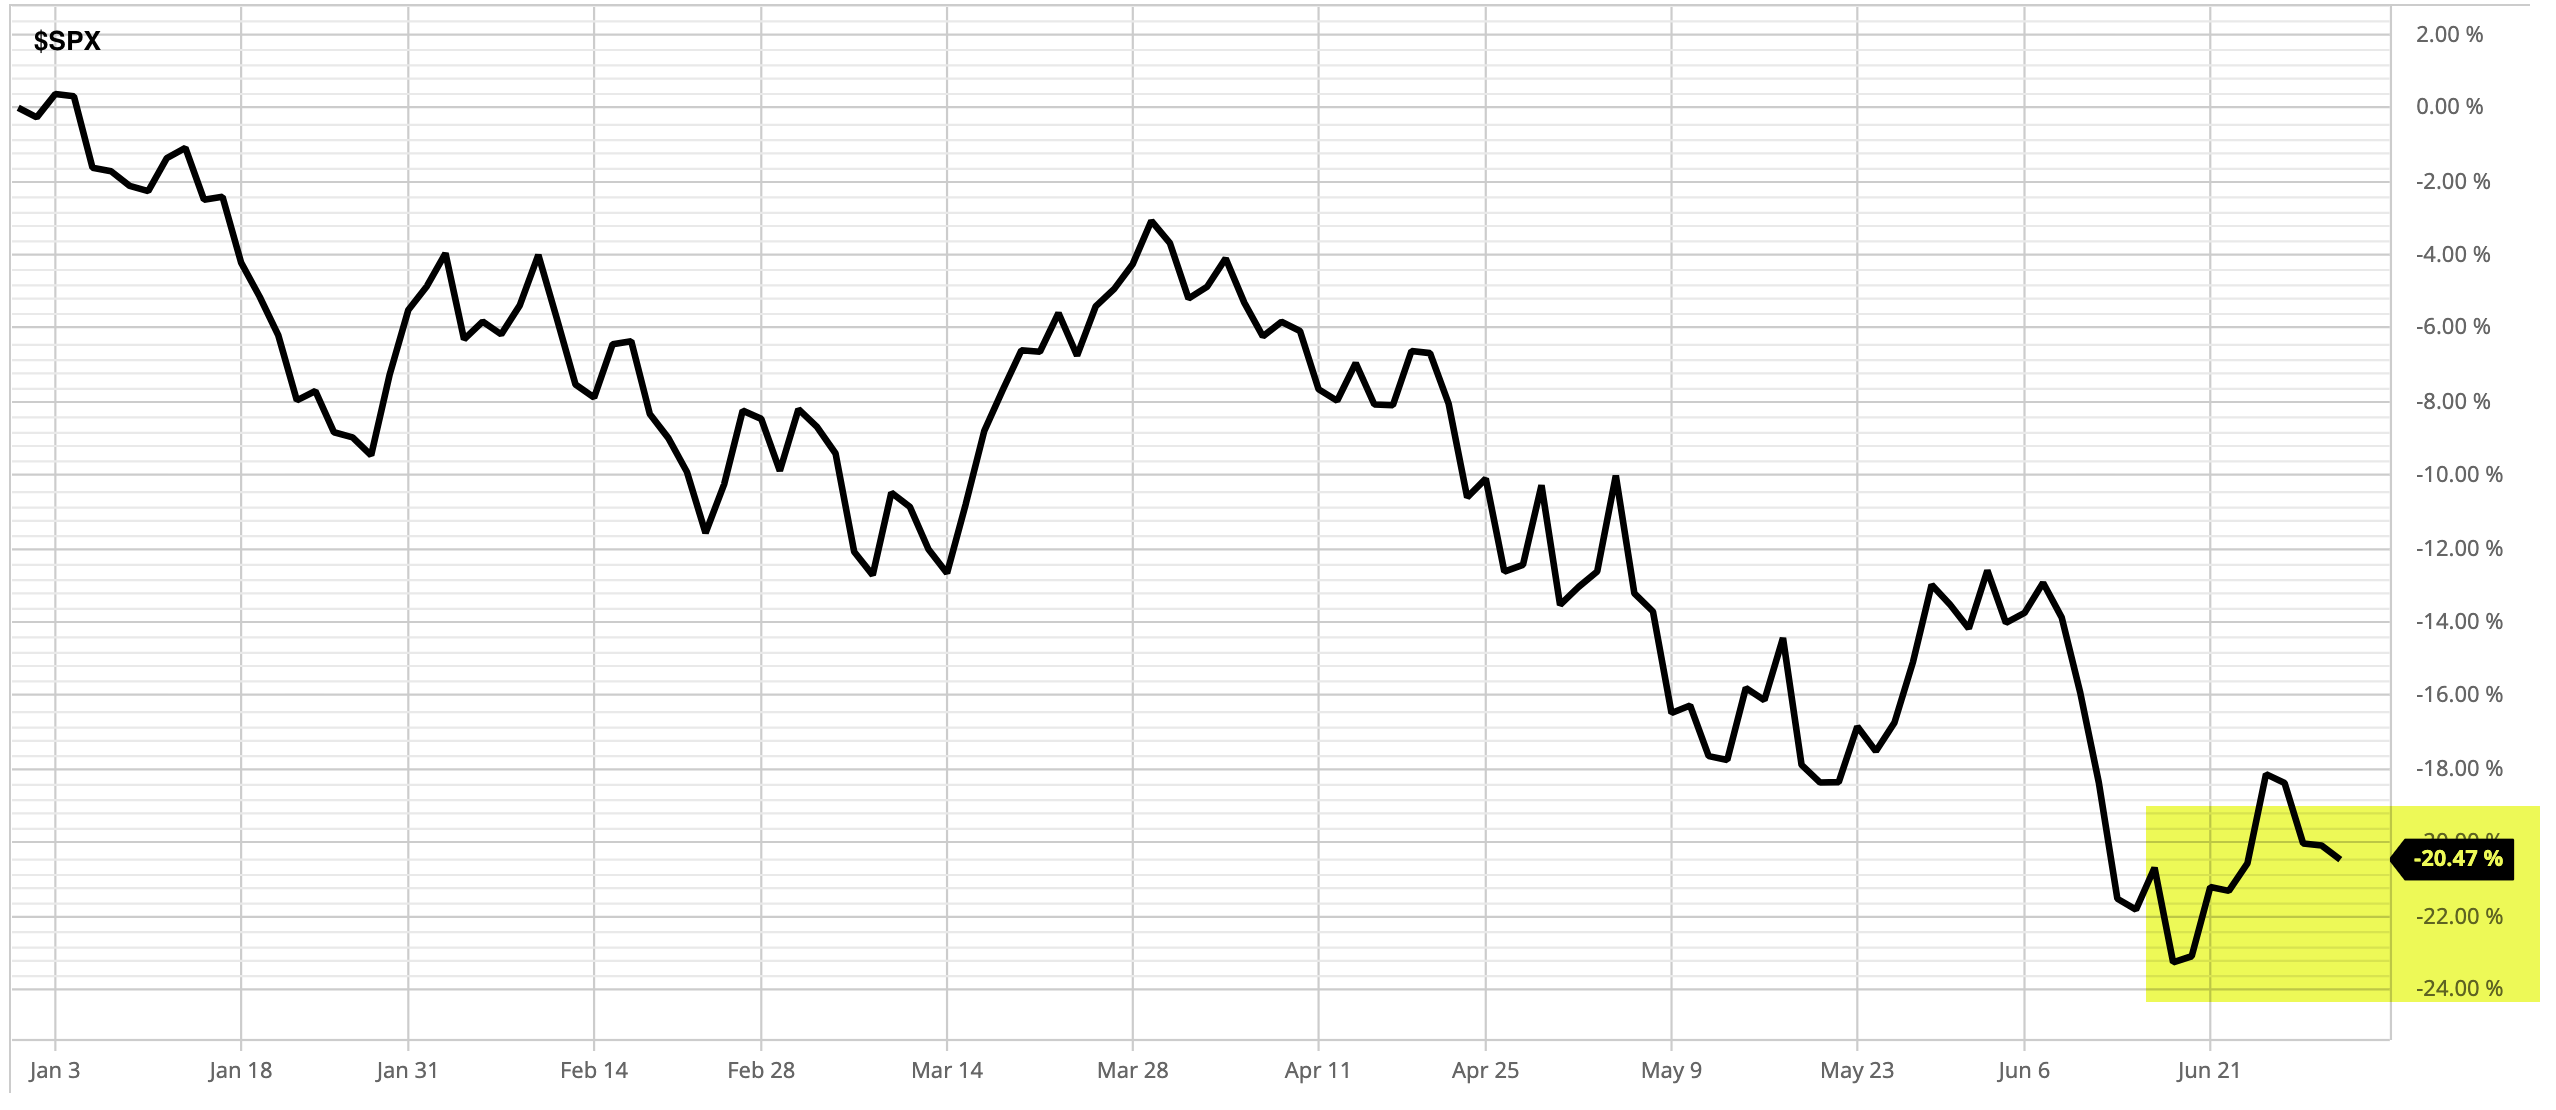
The S&P 500 stock index is down over -20% this year, and it was down -24% YTD just two weeks ago.
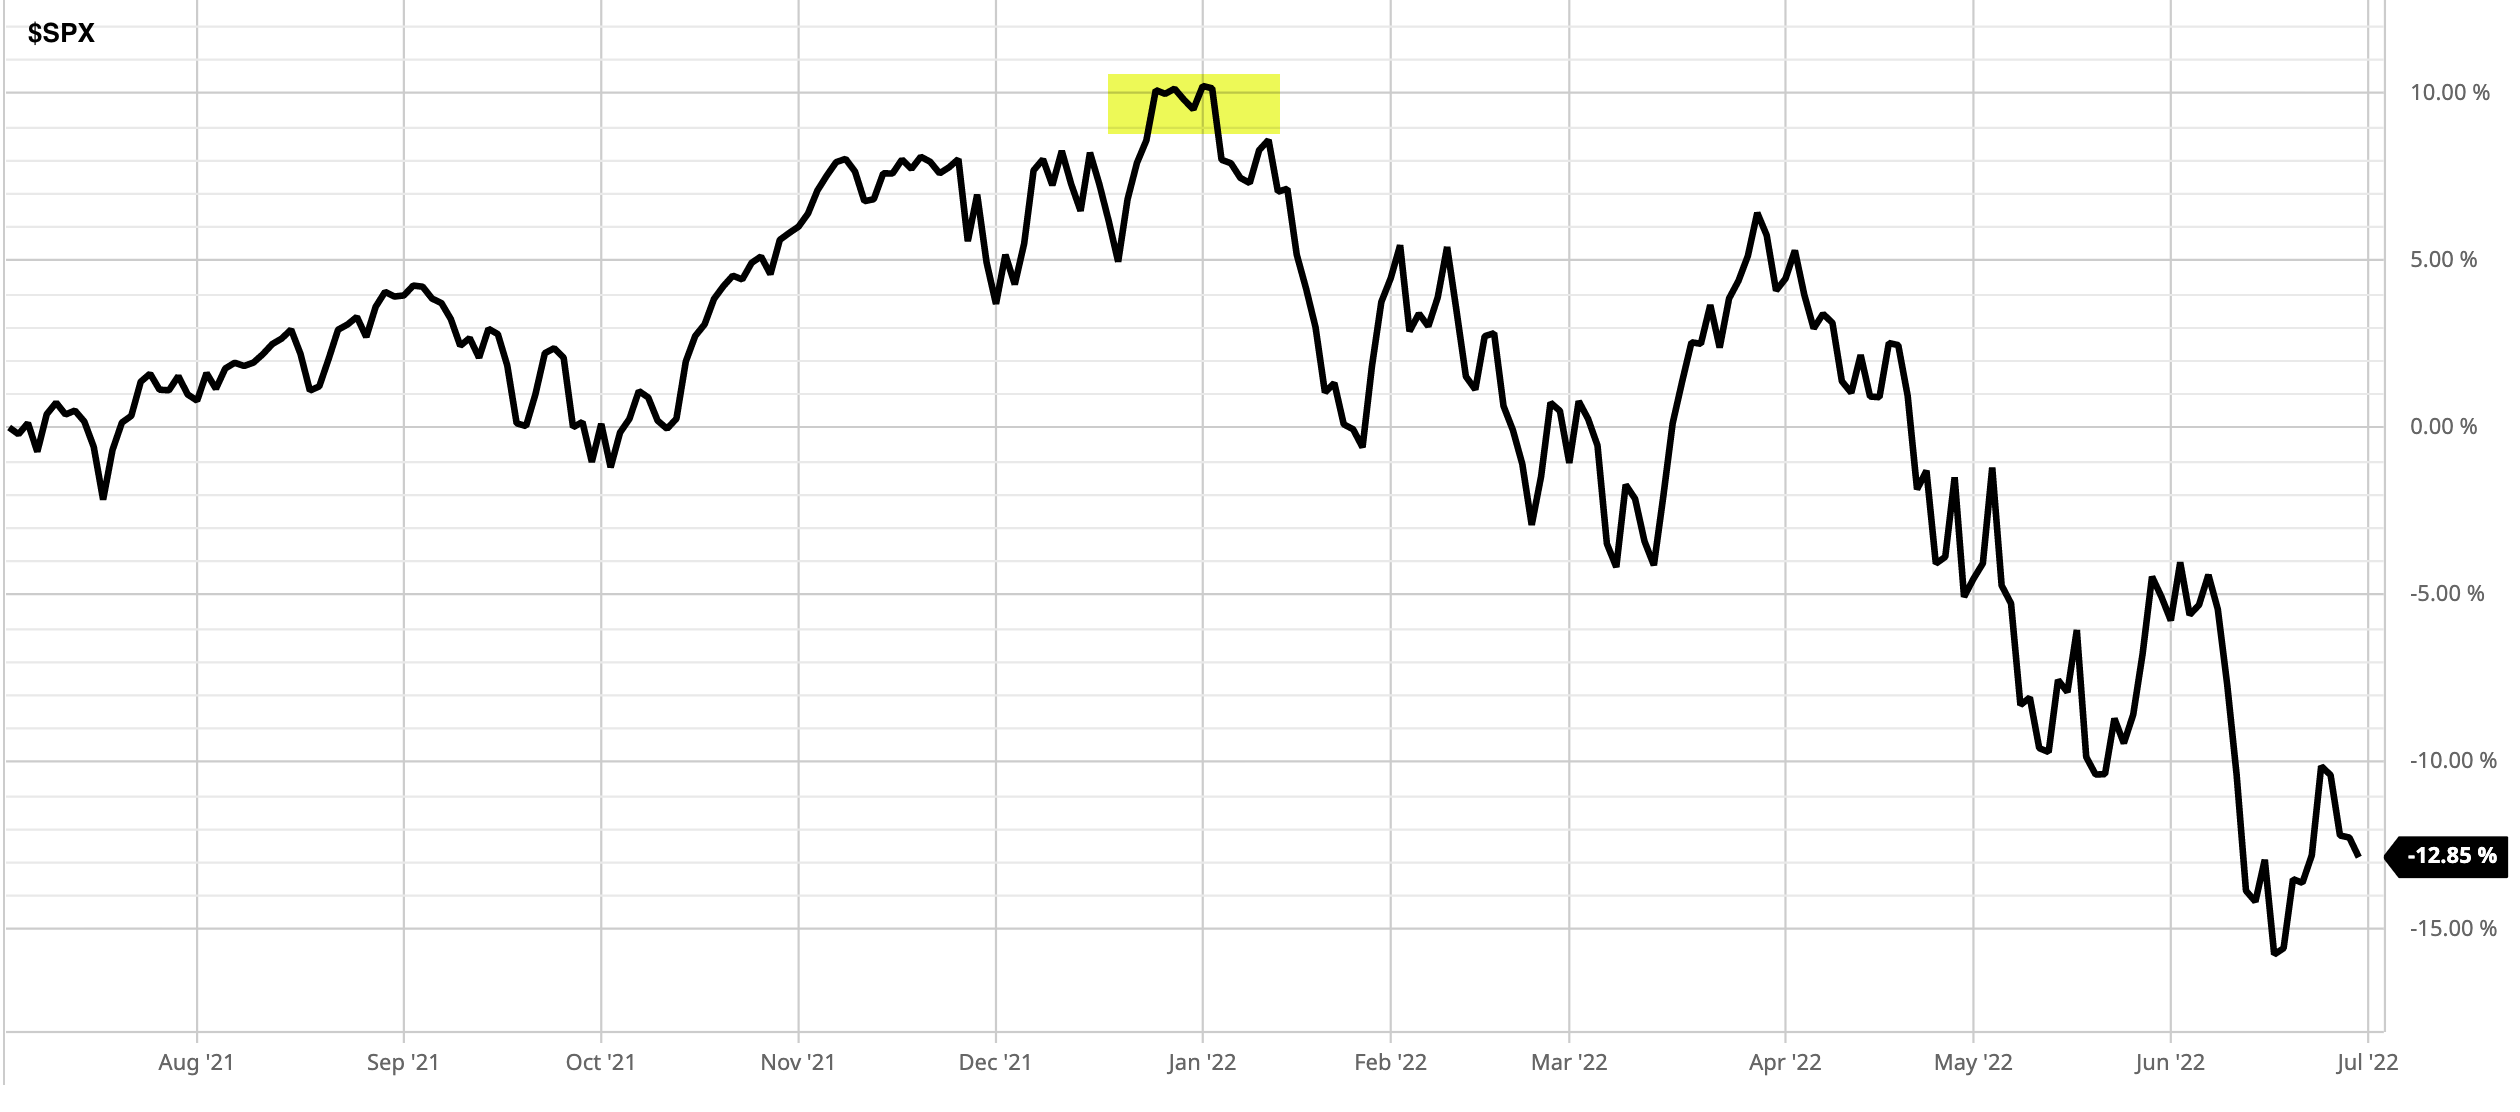
The stock index peaked at the end of last year and is down about -13% over the past 12 months.
But that’s not all.
This time it’s different.
I’ve been warning here for years all the Fed intervention would eventually have to stop, and it would also drive down bond prices, too.
The ICE US Treasury 20+ Year Index is down -23% this year, so long-term U.S. Treasury bonds are down even more than the stock index.

The ICE US Treasury 20+ Year Index peaked July 27, 2020, and has since declined by -32%, far more than stocks.

As warned, bonds are no longer a crutch for declining stocks.
Bonds have been worse.
The Federal Reserve FOMC and U.S. Treasury are no longer accommodating higher stock and bond prices, or applying the “Fed Put” as we call it.
Since 2008, the Feds have stepped in to support the economy and the markets by providing unpreceded liquidity, which has eased selling pressure in waterfall declines and made the market more optimistic.
Fed intervention has resulted in a windfall for stock and bond investors since.
You can no longer rely on the Fed to step in to support market prices.
The challenge today is we’ve never seen the Fed provide such support for stocks and bonds as it has post-2008, so the windfall stock/bond investors have received has now come due.
I had been warning of it:
It’s eventually going to be payback time for the windfall stock market investors have received over the last decade – if you don’t actively manage risk for drawdown control.

Stocks had reached the second-highest most expensive valuation in 140 years, and as you can see in the above chart, and stayed there for the last decade.
High valuations could previously be justified by low inflation, but clearly, that’s no longer the case.
Nothing drives investor sentiment like a strong price trend.
As prices are trending up, investors and traders get more and more bullish, optimistic, and confident.
As prices fall into downtrends, investors and traders get more and more bearish, pessimistic, unsure, doubtful, and outright scared.
Although we tilt more optimistic or pessimistic as a personality trait, by and large investor behavior changes more in downtrends than uptrends.
The prospect theory says that investors value gains and losses differently, placing more weight on perceived gains versus perceived losses.
Prospect theory is also known as the loss-aversion theory.
With Prospect Theory, the work for which Daniel Kahneman won the Nobel Prize, he proposed a change to the way we think about decisions when facing risk, especially financial. Alongside Tversky, they found that people aren’t first and the optimal utility maximizes, but instead react to changes in terms of gains and losses.

In short, Prospect Theory suggests investors are loss-averse, so our risk reward preferences are asymmetric.
We prefer asymmetric investment returns; we want more of the upside, and less of the downside.
Clearly, want can’t receive asymmetric investment returns from just buying and holding risky markets, bonds included.
I believe asymmetric investment returns are pursued by our focus on asymmetric payoffs and positive mathematical expectation over many trades.
ASYMMETRY® is about more upside than downside, an average, over a period of many buys and sells.
ASYMMETRY® is about producing higher average gains than losses, or a positive expectancy.
Back to investor sentiment.
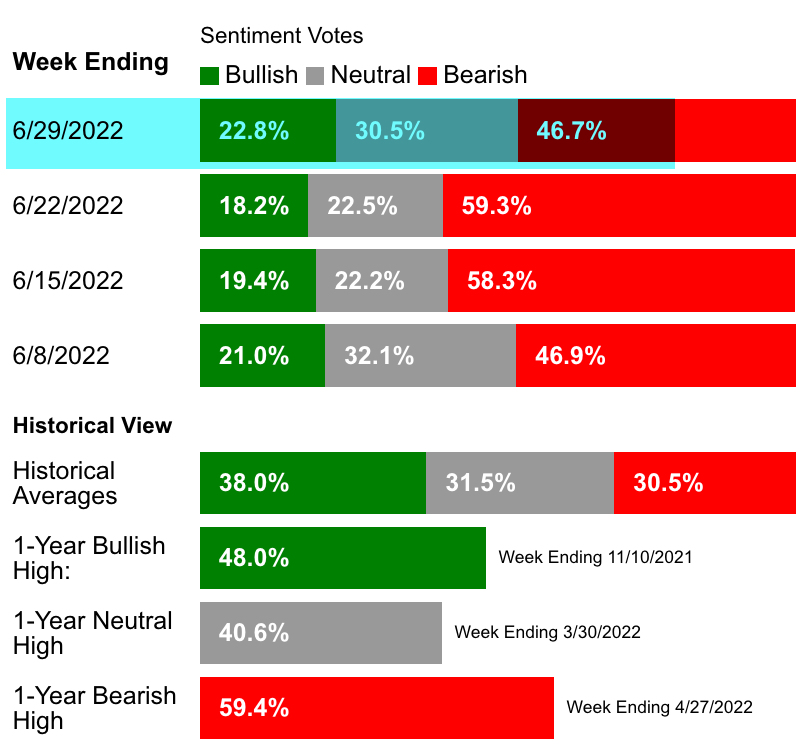
AAII Investor Sentiment remains very asymmetric, though it has shifted more neutral, it remains BEARISH.
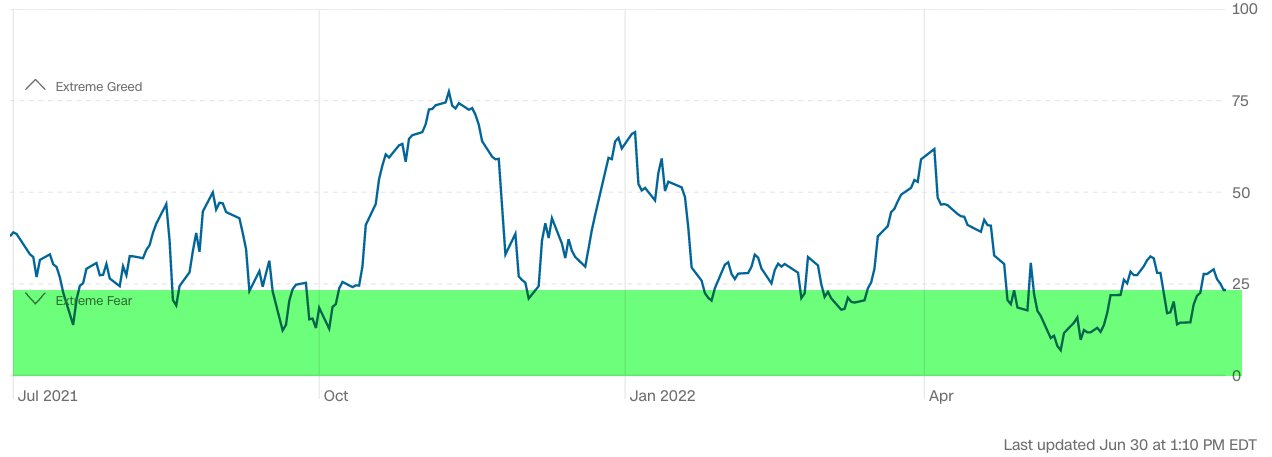
The Fear & Greed IndexFear & Greed Index, which is driven by 7 market indicators instead of a sentiment survey, remains in the EXTREME FEAR zone.
EXTREME levels of FEAR or GREED are usually a contrary indicator, but in a prolonged bear market, bearish sentiment is like a pressure cooker.
Investors who hold their losses too long get caught in a LOSS TRAP.
A loss trap is like the Chinese Finger Pull game.

The harder you pull, the tighter the loss trap.
It’s why I predefined my risk in advance, to cut losses short rather than allow losses to grow large and larger.
The LOSS TRAP is not fun, and can be very costly.
Don’t let smaller losses become larger and larger losses, or you’ll be caught in the trap, and the harder you resist, the tighter it gets.
The Fear & Greed Index peaked on November 9th and has since printed lower highs and lower lows; a downtrend.
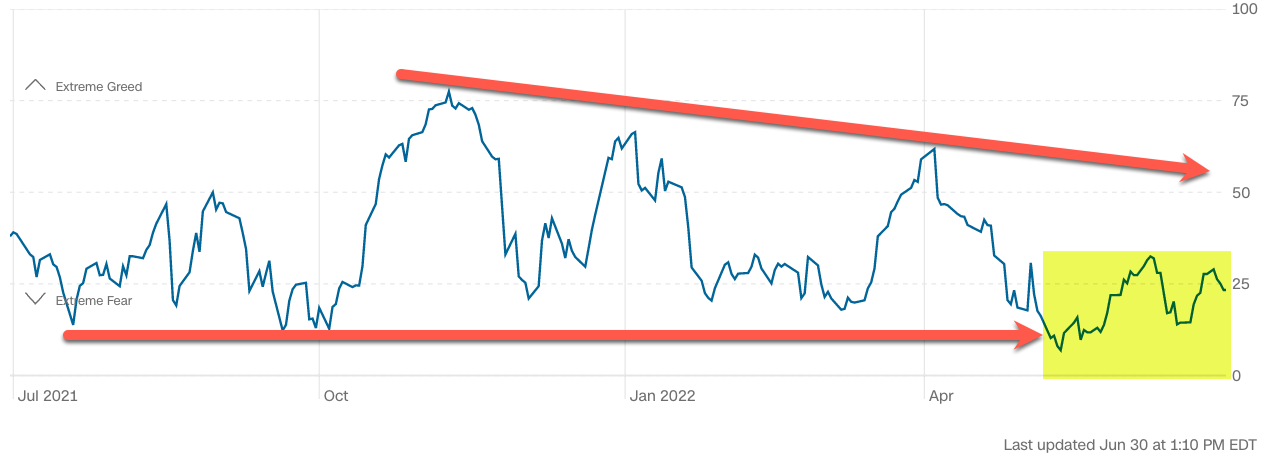
At this point, the prolonged trend in investor fear suggests this may be the early stages of a prolonged bear market, so govern yourself accordingly.
It’s why I tactically trade market trends.
It’s why I actively manage my risk in each position and across the entire portfolio for drawdown control.
The windfall buy-and-hold passive investors have received from the U.S. stock market from Fed action is due for payback.
Our ASYMMETRY Managed Portfolio has been positive for the year.
Though past performance is never a guarantee of future results, this is when I’ve historically revealed an edge.
When the wind is blowing, we can cast the sail ride and enjoy the ride.
But when the wind stops blowing, we have to get out the oars or risk sinking.
At Shell Capital, we row, not sail.
We are here to help if you need it, contact us.
We are a fiduciary money manager fully committed to guiding our clients.
Mike Shell is the Founder and Chief Investment Officer of Shell Capital Management, LLC, and the portfolio manager of ASYMMETRY® Managed Portfolios. Mike Shell and Shell Capital Management, LLC is a registered investment advisor focused on asymmetric risk-reward and absolute return strategies and provides investment advice and portfolio management only to clients with a signed and executed investment management agreement. The observations shared on this website are for general information only and should not be construed as investment advice to buy or sell any security. This information does not suggest in any way that any graph, chart, or formula offered can solely guide an investor as to which securities to buy or sell, or when to buy or sell them. Securities reflected are not intended to represent any client holdings or recommendations made by the firm. In the event any past specific recommendations are referred to inadvertently, a list of all recommendations made by the company within at least the prior one-year period may be furnished upon request. It should not be assumed that recommendations made in the future will be profitable or will equal the performance of the securities on the list. Any opinions expressed may change as subsequent conditions change. Please do not make any investment decisions based on such information, as it is not advice and is subject to change without notice. Investing involves risk, including the potential loss of principal an investor must be willing to bear. Past performance is no guarantee of future results. All information and data are deemed reliable but are not guaranteed and should be independently verified. The presence of this website on the Internet shall in no direct or indirect way raise an implication that Shell Capital Management, LLC is offering to sell or soliciting to sell advisory services to residents of any state in which the firm is not registered as an investment advisor. The views and opinions expressed in ASYMMETRY® Observations are those of the authors and do not necessarily reflect the position of Shell Capital Management, LLC. The use of this website is subject to its terms and conditions.

You must be logged in to post a comment.