I focus most of my attention on my own positions or those on my lists for portfolio management.
Nothing is more telling than what the stocks on my lists that meet certain fundamental earnings growth and technical criteria are doing.
Nothing is more important than the trend, momentum, and volatility of our actual positions.
However, it doesn’t mean we don’t also observe all the other stocks, bonds, commodities, and currencies for signs of strength or weakness.
Even though it may not impact my exposures or drive any change in our positions, I still enjoy taking the time to see what “the market” is doing, overall, in the big picture. That’s what I mostly share here, for informational purposes only.
Below is a chart of the percent of U. S. stocks trending about the 50-day moving average, an intermediate-term trend signal.
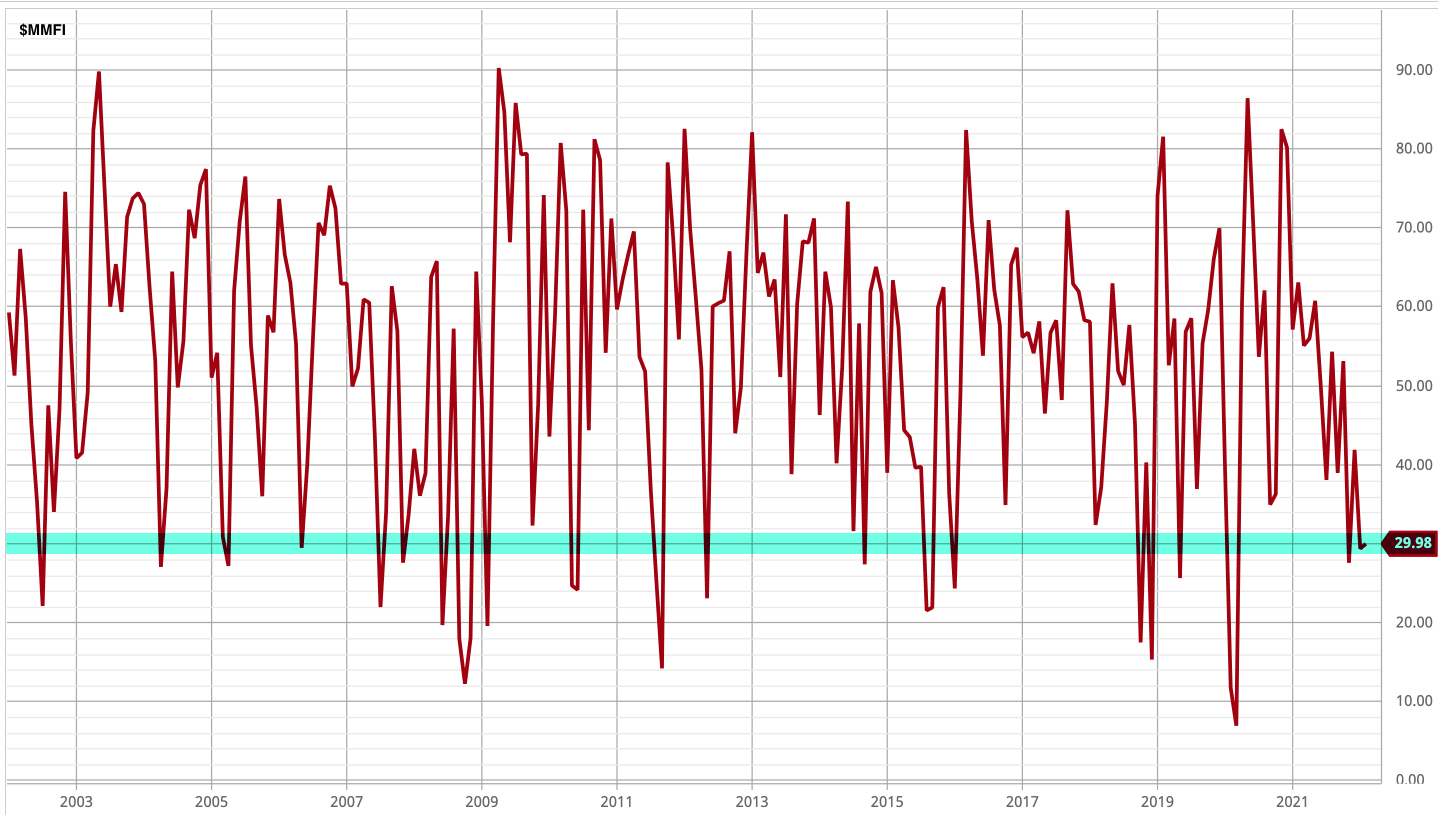
A few observations of asymmetry are:
- Only 30% of stocks are trending above the 50 day moving average.
- As we can see in the charge giong back 20 years, its at the low end of its historical range.
- In signficant stock market declines, it gets much worse. For example, in March 2020, more than 90% of stocks were in downtrends, the worst in two decades, including 2008.
- About 8 times this Market Breadth indicator stopped at this level before trending back up, as stocks trended back up.
- About 13 times this Market Breadth indicator didn’t stop here at this level, but instead kept trending loweer as stocks trended lower.
Overall, my observation from this asymmetry (imbalance) is many stocks have already entered downtrends.
Overall, stock market participation started showing weakness after the May 2020 advance, then improved into late 2010 before reaching a peak, and it’s been trending down since.
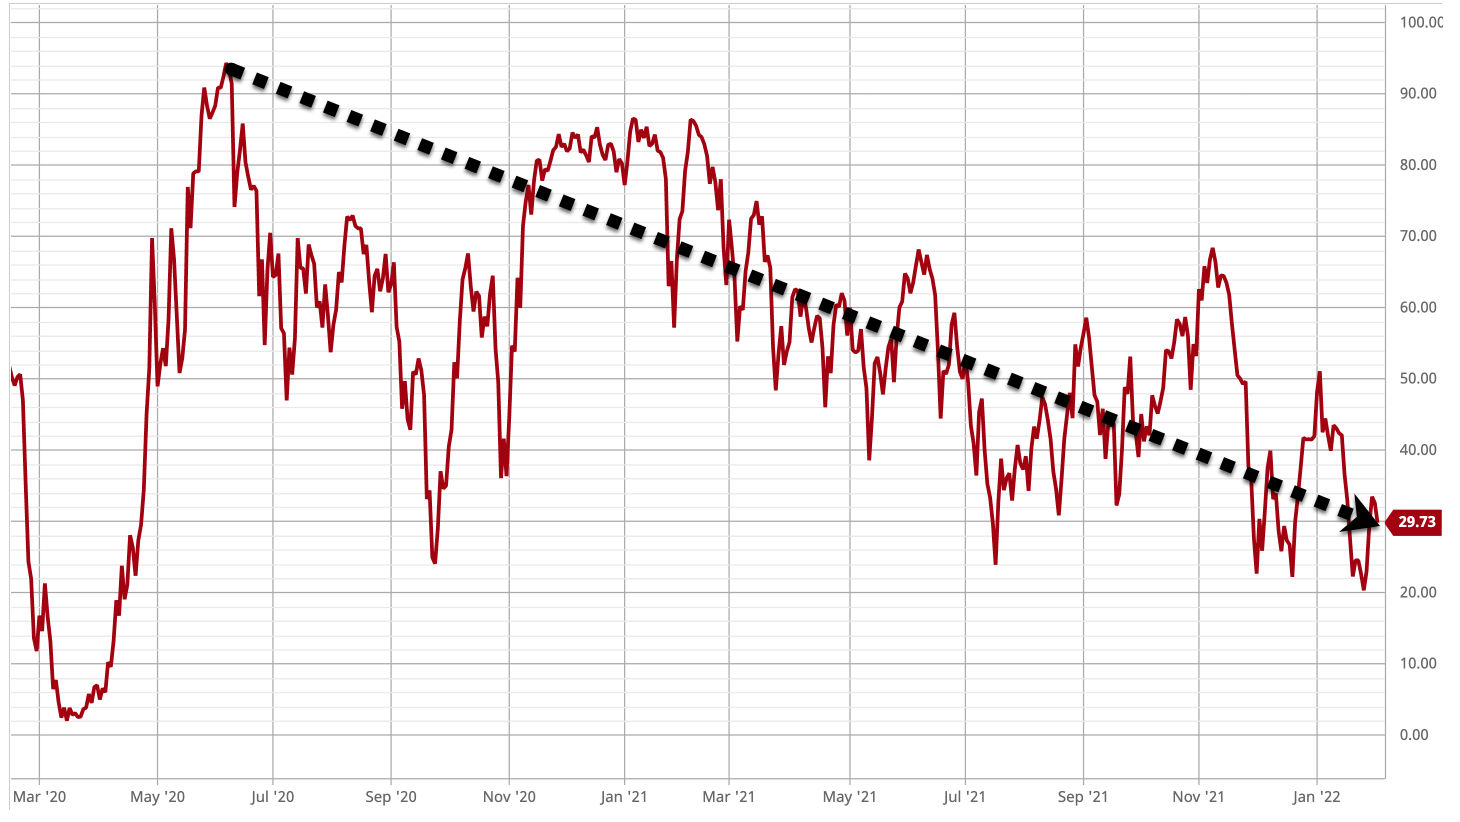
We may start to hear some call it a “Stealth Bear Market,” a phrase used to describe stock market conditions when the overall indexes are by and large trending higher, but many stocks are trending lower.
A “Stealth Bear Market” may define a trend like this because the S&P 500 stock index has been trending up, as the percent of stocks participating in the uptrend has declined.
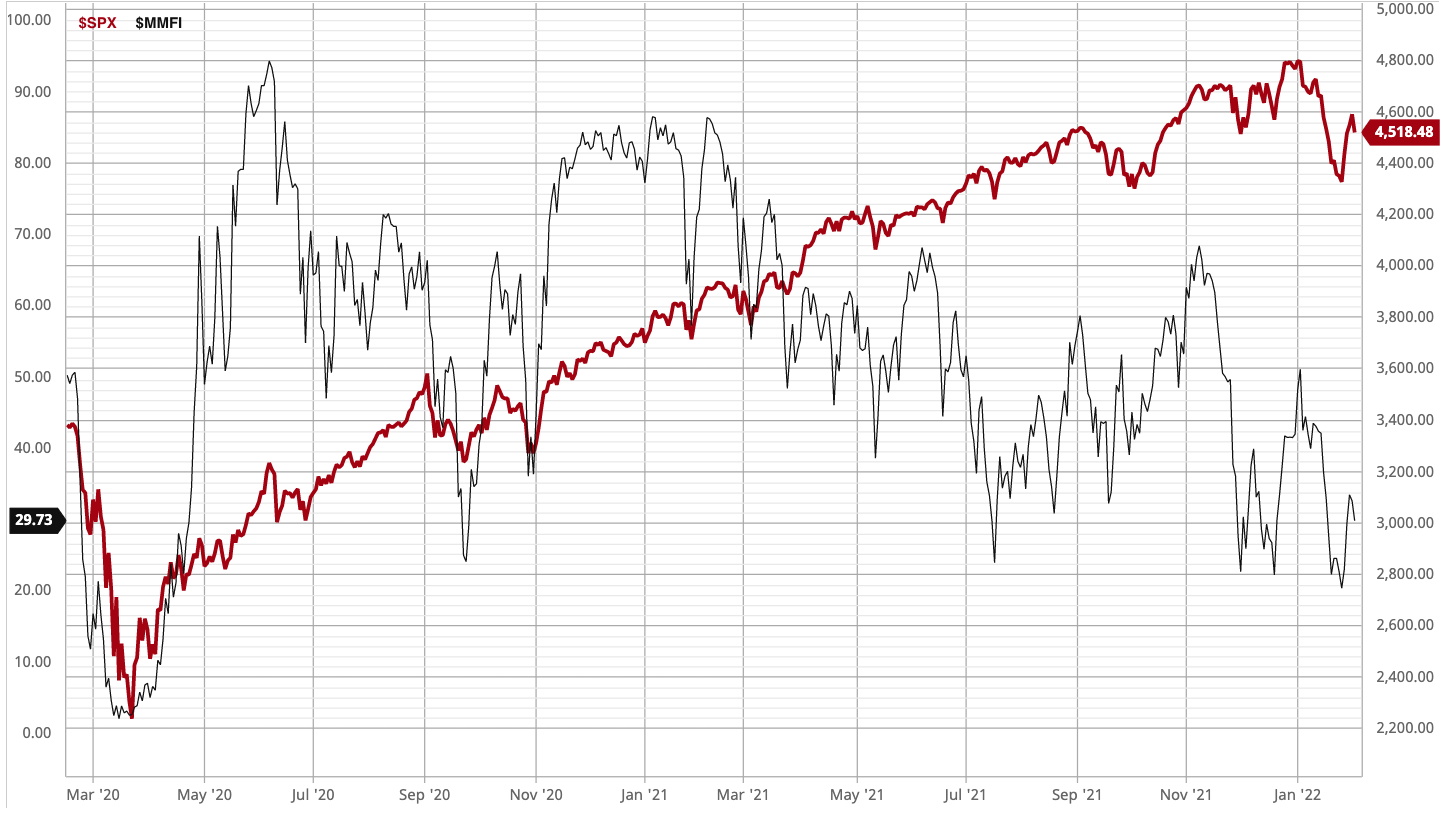
Regardless of what we call it, the bottom line is most stocks are already in downtrends, so we’ve been stalking to see when they start trending back up again.
I think it’s essential to actively manage risk and adapt to changing market trends. If you need help, contact us. We manage accounts titled in your own name at an independent custodian of Goldman Sachs.
Mike Shell is the Founder and Chief Investment Officer of Shell Capital Management, LLC, and the portfolio manager of ASYMMETRY® Global Tactical. Mike Shell and Shell Capital Management, LLC is a registered investment advisor focused on asymmetric risk-reward and absolute return strategies and provides investment advice and portfolio management only to clients with a signed and executed investment management agreement. The observations shared on this website are for general information only and should not be construed as advice to buy or sell any security. Securities reflected are not intended to represent any client holdings or any recommendations made by the firm. Any opinions expressed may change as subsequent conditions change. Do not make any investment decisions based on such information, as it is subject to change. Investing involves risk, including the potential loss of principal an investor must be willing to bear. Past performance is no guarantee of future results. All information and data are deemed reliable but are not guaranteed and should be independently verified. The presence of this website on the Internet shall in no direct or indirect way raise an implication that Shell Capital Management, LLC is offering to sell or soliciting to sell advisory services to residents of any state in which the firm is not registered as an investment advisor. The views and opinions expressed in ASYMMETRY® Observations are those of the authors and do not necessarily reflect a position of Shell Capital Management, LLC. The use of this website is subject to its terms and conditions.

You must be logged in to post a comment.