Volatility measures the frequency and magnitude of changes, both up and down, that we experience over a certain period of time.
When we speak of volatility in the financial markets, we necessarily mean the magnitude of price movements, both up and down, over time.
So, volatility is how quickly and how far a price trend spreads out.
The more dramatic the price swings, the higher the level of volatility.
Volatility can be measured using actual historical price changes (realized volatility) or it can be a measure of expected future volatility that is implied by option prices.
The VIX Index is a measure of expected future volatility.
The VIX index is a calculation designed to produce a measure of constant, 30-day expected volatility of the U.S. stock market, derived from real-time, mid-quote prices of S&P 500® Index (SPX) call and put options.
When the VIX is low, a lower level of volaltity is implied, or priced in, to the options. When the VIX is high, expected volaltity is high.
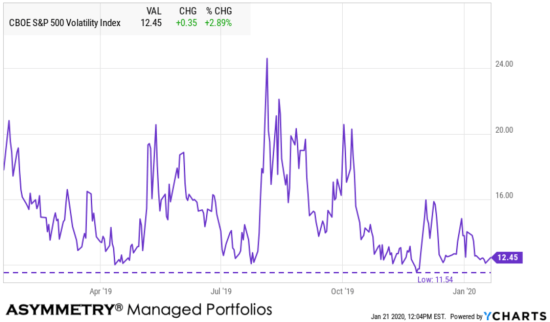
Recently, the implied volatility index VIX has been very low at times. As seen below, I added the low of the past year to the chart, which was 11.54, which is lower than today.
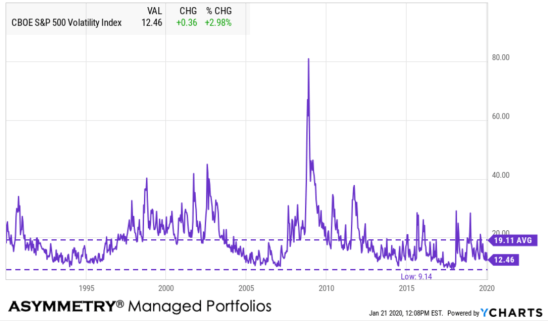
But, the long term average VIX level is 19 and the lowest level the VIX has reached since its inception was 9.14 reached late 2018.
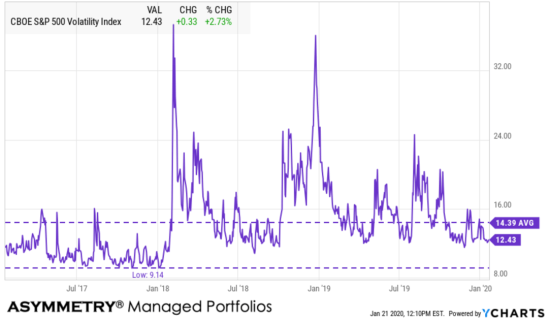
To put the 9.14 level into perspective, here is the past three years and how low the VIX was in 2018 as complacency set in.
Can stocks keep trending up and implied volatility drift lower?
Absolutely.
But, what happened after it did?
Mike Shell is the Founder and Chief Investment Officer of Shell Capital Management, LLC, and the portfolio manager of ASYMMETRY® Global Tactical. Mike Shell and Shell Capital Management, LLC is a registered investment advisor in Florida, Tennessee, and Texas focused on asymmetric risk-reward and absolute return strategies and provides investment advice and portfolio management only to clients with a signed and executed investment management agreement. The observations shared on this website are for general information only and should not be construed as advice to buy or sell any security. Securities reflected are not intended to represent any client holdings or any recommendations made by the firm. Any opinions expressed may change as subsequent conditions change. Do not make any investment decisions based on such information as it is subject to change. Investing involves risk, including the potential loss of principal an investor must be willing to bear. Past performance is no guarantee of future results. All information and data are deemed reliable but is not guaranteed and should be independently verified. The presence of this website on the Internet shall in no direct or indirect way raise an implication that Shell Capital Management, LLC is offering to sell or soliciting to sell advisory services to residents of any state in which the firm is not registered as an investment advisor. The views and opinions expressed in ASYMMETRY® Observations are those of the authors and do not necessarily reflect a position of Shell Capital Management, LLC. The use of this website is subject to its terms and conditions.

You must be logged in to post a comment.