Is this correction and volatility normal?

With perfect hindsight, we now all know that January 26th was the recent price peak in the U.S. stock market. Since then, the S&P 500 has declined about -10% and the Dow Jones Industrial Average about -12%. For simplicity, I’m going to focus on U.S. stock market here.

I wasn’t surprised to see the decline and am not surprised to see “more volatility,” because it would be getting back to “normal.”

But I see recent price action has sure gotten the attention of many on social media. Some even seem dazed and confused.

I’m not surprised about that, either.

On January 11, before stock market declined prices started swinging up and down (volatility), I shared an observation with my friends on Twitter and a warning:

On January 24th, I again warned of complacency. The message was clear:

At this point, this is a normal and expected “correction” of what was an upside overreaction in the prior months. The stock index has declined about -10%, regained some of the loss in March and more recently retested the February 8th low. As long as the lows hold, I consider this a normal correction.
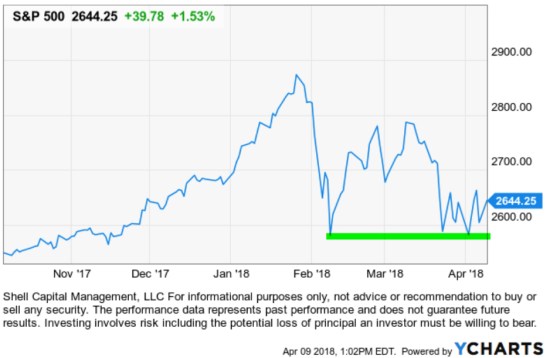
stock market spx

Sure, the decline was sharp and fast, but that’s no surprise for me after such an upside move. I said it was “expected” because, as I pointed out above, 2017 was very abnormal because it lacked the typical -5% to -10% declines we normally see over most 12 month periods in the stock indexes.

Another way I define a “normal correction” is a simple trend line drawn under the price over the past 12 months. Without adding a lot of complicated looking indicators to express it, below we see the stock index has just “reverted to its trend.” The peak in December and January was an abnormal overreaction on the upside, which I pointed out as it was happening. The recent -10% decline has simply put the trend back in a more normal range.

stock market normal correction trend

What is normal, typical, or expected? 

I’m observing a lot of commentaries as if this correction and volatility isn’t normal.  The fact is, many people often include their emotions and feelings along with price action.

Investors perceive what they believe is driving a price trend and what they believe is always true for them.

The February decline was commonly blamed on “the machines,” which got a little silly.

This time, it’s geopolitics.

I believe it’s just the market, doing what it does, and there are so many drivers at the same time I don’t bother to attempt such a narrative. My narrative is simple; the force of sellers took control and outweighed the enthusiasm of buyers.  It is just the market, doing what it does.

I’ve been seeing and experiencing these trends so closely for so long and I remember the regime shifts. I want to share with you my observations of what have been “normal” corrections in terms of drawdowns. A drawdown is the % decline from a prior price high to its low. I show only the period of the past 9 years, which is one of the longest bull markets in history (without a -20% decline).
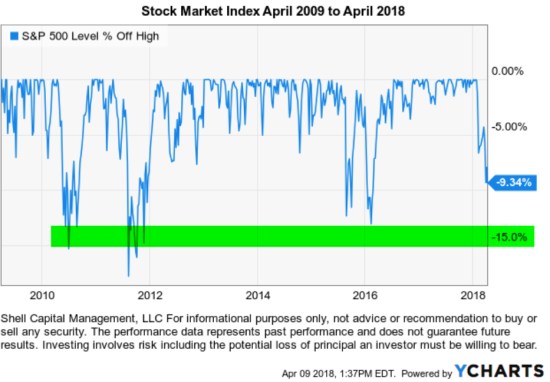
stock market historical bear market length drawdowns

As you can see, since April 2009, we’ve seen four declines of -15% or more and it took them several months to recover.

These declines of -15% or more are why many people have been unable to hold on to the stock market since the March 2009 low with any meaningful allocation to stocks. When prices fall -10%, investor sentiment shifts from greed to extreme fear. Some of them may even begin to tap out by selling their stock holdings for fear of more losses.

To be sure, here is an investor sentiment indicator at the February 8, 2018 low.

Investor sentiment Februrary 8 2018

In fact, investment managers like me who have dynamic risk management systems may even sell to reduce exposure to loss as an intentional drawdown control. But this time, as I pointed out, the stock market was already at risk of a reversal before this decline. So, a robust risk management system may have reduced exposure before the decline, not after.

We find that declines over -10% get more attention, especially when they get down to -15%. Those can also be more hostile conditions for trend systems, too, as risk management systems cause us to exit and later re-enter.

The point is, over the past 9 years a -15% decline has been a “normal” occurrence and there are many -5% (or more) declines too.

It is only at a -10%, so far, and that’s not unusual.

I intentionally used the last 9 years. Not to show an arbitrary 9 year period, but instead to intentionally leave off March 2009. I did that because the first three months of 2009 was a -24% decline, a continuation of the 2008 waterfall decline. The stock market was still in the bear market that began October 2007. So, this wouldn’t be complete without a reminder of what that period looked like before I go on to show the pre-2008 period.

All bear markets do necessarily begin with declines of  -10%, -15%, -20% . They are actually made of many swings up and down along the way. We often hear people speak of the last bear market as “2008” as though the only loss was the -37% decline in the S&P 500 in 2008.

That is far from reality.

The decline was -56%.
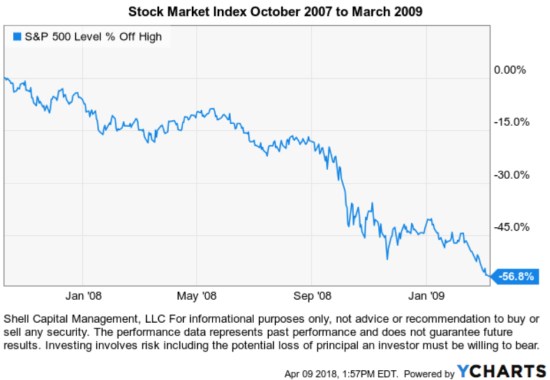
2008 stock market drawdown length of bear market

The drawdowns we’ve seen since 2008 are more than twice what we saw in the bull market from 2003 to 2008 after the “tech wreck.” Below we see the typical decline then was closer to -5% with only a few getting into the -7% or more range. 2004 to 2008 bull market low volatility

Clearly, it was a lot easier to hold a larger allocation of stocks, then.

What is normal and what has changed?

The last 9 years has been more hostile for passive asset allocation investors to hold on to their stock positions because the declines were -15% or so and take months to recover. It’s also been more challenging for active risk managers since a drawdown control system necessarily reduces exposure as prices fall with the intent to control drawdown.

But, to define what is normal today, a -10% to -15% decline is within a normal corrective drawdown.

The recent past matters simply because that’s what investors and traders anchor to. Most people put more emphasis on the recent past. Our experience and how much we’ve studied and observed the trends determine how much we can recall easily. I’ve been an investment manager most of my life, over two decades now. For me, it hasn’t been a hobby or part-time venture, it’s what I do and who I am. So, my memory of these trends and intuitions about what is normal, or not, is what it is.

If you are wondering, here are the drawdowns for the S&P 500 going back about 70 years. I highlighted the -15% declines or more, which obviously gets investors attention.

stock market bear market length and dradowns

Clearly, there are a lot of -15% or greater declines. In fact, there are several -30% and three in the -45% or larger drawdowns.

Knowing this, it’s why I say:

We believe world markets require active risk management to avoid large losses and directional trend systems to position capital in profitable price trends.

And, I also say:

It doesn’t matter how much the return is if the downside risk is so high you tap out before it’s achieved.

But at this point, you can probably see that the current -10% decline is so far within a “normal correction.”

Though, as I shared in The enthusiasm to sell overwhelmed the desire to buy March 19, 2018, I expect to see more swings (volatility) than last year, and that would be “normal” too.

I define this as a non-trending market. When I factor in how the range of price movement has spread out more than double what it was, I call it a non-trending volatile condition.

Markets decline to a low enough point to attract buying demand. Only time will tell how it all plays out from here.

If you enjoyed this, I encourage you to read “What About the Stock Market Has Changed? A Look at Ten Years of Volatility” 

Mike Shell is the Founder and Chief Investment Officer of Shell Capital Management, LLC, and the portfolio manager of ASYMMETRY® Global Tactical.

You can follow ASYMMETRY® Observations by click on on “Get Updates by Email” on the top right or follow us on Twitter.

The observations shared in this material are for general information only and are not intended to provide specific advice or recommendations for any individual. Investing involves risk including the potential loss of principal an investor must be willing to bear. Past performance is no guarantee of future results.


You want to be fearful when others are greedy?

“You want to be greedy when others are fearful. You want to be fearful when others are greedy. It’s that simple.… ” – Warren Buffett

Investors are emotional and we can profit from it.

Though investors are emotional, they can also manage their emotions to feel the right feeling at the right time.

Market trends are both the result of investor behavior and driven by it. Anyone who watches “the market” has had feelings of fear and greed at some point. Those who “watch it closely” feel it often.

  • Fear: I am losing money! Is it ever going to stop?
  • Worried: How much more money will I lose?
  • Defeated: I’ve lost so much money I don’t know what I’m going to do.
  • Hope: I hope I make money this time. I hope it keeps going up!
  • Greed: I’m up X%! Up! this, Up! that. I’m up!
  • Euphoric: I’m going to tell everyone how much I’m UP! Up, up, and away!

All of these feelings and reactions drive directional price trends. Emotions also determine investor’s results. Investor behavior determines investor’s results as much as their investment program or the market.

fear-and-greed-index-explaination-cnn

Investor sentiment just reached “Extreme Greed” again. Investor sentiment tends to swing from “Fear” to “Greed” a few times a year, mostly reacting to the price trend. That is, we don’t see the majority of investors getting fearful when others are greedy. Instead, we see them get fearful after prices have fallen and they’ve lost some value. We don’t see investors getting greedy after prices fall, we instead see them get greedy after prices have already gained and they are “up”.

Being “up” in a position doesn’t mean anything if it’s “down” in the next period.

Being “up” in a position is an open profit until it’s closed.

An open profit is just the markets money until it’s realized by selling it.

A realized gain is a profit that has been taken by selling.

The Fear & Greed Index I used above is one that is simple to follow for anyone who wants to give themselves a reality check.

If you find yourself feeling euphoric and talking about how great “the market” or your investments are “doing”, this measure is likely dialed to the right for “Extreme Greed”.

If you find yourself fearful of more losses after losses you may be taking too much risk, but it could also be near a turning point. One the one hand, you don’t want to reach your uncle point and tap-out. So, you predefine your tolerance for loss and match that with an investment program that includes risk management and drawdown control.

You want to avoid doing the wrong things at the wrong time- as the quote said.

Although the Fear & Greed Index equally weights seven different sentiment indicators, the most prominent of them is the CBOE Volatility Index® (VIX® Index®), which is a key measure of market expectations of near-term volatility conveyed by S&P 500 stock index option prices. When the VIX gets really low like it is now, it suggests that expectations for near-term volatility is very low.  I say “really low” because, as you can see, its current level of 10.74 is about as low as it’s gotten since introduction in 1993. That’s a contrary indicator because it’s at such an extreme. It seems the market is getting complacent and any surprise will shock them.

vix-cboe-volatility-index

What does this mean?

We shouldn’t be surprised to see the recent upward price trend reverse down some, at least temporarily.

And, those who apply the simple-sounding strategy of “You want to be greedy when others are fearful. You want to be fearful when others are greedy.” may start to take some profits and preparing to take advantage of, or avoid, a later decline.

It doesn’t mean it will be a large decline, though it could be. For example, the last time I pointed out “Investor Optimism is Reaching Extreme” was December 9th of last year. As you can see below, the stock index dropped only about -2% over the next two weeks. That’s a small drop. Based on history, we expect to see swings of stock index prices of -5% to -10% two or three times a year. When I see such overbought conditions as I see now, I expect that level of normal decline.

decline-since-fear-and-greed-index

The upward trend in U.S. stocks has mostly been uninterrupted since last November. You can probably see how this just adds to the weight of the evidence that we shouldn’t be surprised to see a “normal” drop at some point. As a tactical trader, I prefer to avoid large declines when I can and take advantage of them.

We’ll see how it unfolds this time…

Mike Shell is the Founder and Chief Investment Officer of Shell Capital Management, LLC, and the portfolio manager of ASYMMETRY® Global Tactical.

Mike Shell and Shell Capital Management, LLC is a registered investment advisor focused on asymmetric risk-reward and absolute return strategies and provides investment advice and portfolio management only to clients with a signed and executed investment management agreement. The observations shared on this website are for general information only and should not be construed as advice to buy or sell any security. Securities reflected are not intended to represent any client holdings or any recommendations made by the firm. Any opinions expressed may change as subsequent conditions change.  Do not make any investment decisions based on such information as it is subject to change. Investing involves risk, including the potential loss of principal an investor must be willing to bear. Past performance is no guarantee of future results. All information and data are deemed reliable but is not guaranteed and should be independently verified. The presence of this website on the Internet shall in no direct or indirect way raise an implication that Shell Capital Management, LLC is offering to sell or soliciting to sell advisory services to residents of any state in which the firm is not registered as an investment advisor. The views and opinions expressed in ASYMMETRY® Observations are those of the authors and do not necessarily reflect a position of  Shell Capital Management, LLC. The use of this website is subject to its terms and conditions.

Investor Optimism is Reaching Extreme

As it often does, the U.S. stock market trended the complete opposite of what market pundits expected after the election.

Clearly, a Presidential election can be the blame for volatility we saw this year before the election. However, instead of crashing down U.S. stocks regained their previous losses quickly. Along with that, investor sentiment shifted from fearful a month ago to much more optimistic as prices trended up. At this point, investors have probably forgotten how volatile markets were the first part of 2016. Once the losses are regained, they eventually forget the stock indexes were down -12% or more in January and February.

Investors tend to get optimistic (or even greedy) after prices have gone up and then fearful after prices go down.

I am not necessarily a contrarian investor. I mainly want to be positioned in the direction of global markets and stay there until they change. But markets sometimes get to an extreme – increasing the probability of a reversal. At this point, a tactical trader can hedge, reduce exposure, realize profits, or wait until an actual reversal to respond.

My purpose of pointing out these extremes in investor sentiment (fear and greed) is to illustrate how investors’ feelings oscillate between the fear of missing out (if global markets have gone up and they aren’t in them) and the fear of losing money (if they are in global markets and they are falling). Fear and greed is a significant driver of price trends. When stock market investor sentiment reaches an extreme, it often reverses trend afterward.

Indicators suggest that investors are pursuing higher risk strategies and that investor optimism has reached a short-term extreme. I like to use the Fear & Greed Index that is a simple snapshot for anyone to see. Below is the reading as of yesterday as it reached “Extreme Greed.”

cnn-fear-greed-index

We shouldn’t be surprised to see the recent upward price trend reverse down, at least temporarily.

Along with that, we could see investor sentiment reverse from “Extreme Greed” to “Fear” as prices fall.

It’s OK to feel and experience your feelings… if you feel the right feeling at the right time.

Indicators like this can help investors observe how they tend to feel the wrong feeling at the wrong time.


To learn more, below are some of my previous observations about sentiment reaching an extreme greed level of optimism.

Investor Optimism Seems Excessive Again

It’s official: extreme greed is driving the stock market

What emotion is driving the market now? Extreme Greed

Extreme Fear is Now Driving Markets

On October 27th I wrote in Fear and Greed is Shifting and Models Don’t Avoid the Feelings that:

The CNN Fear & Greed Index shows investor fear and greed shifted to Extreme Fear a month ago as the popular U.S. stock indexes dropped about -12% or more. Many sectors and other markets were worse. Since then, as prices have been trending back up, Greed is now the driver again. I believe fear and greed both drives market prices but also follows price trends. As prices move lower and lower, investors who are losing money get more and more afraid of losing more. As prices move higher and higher, investors get more and more greedy. If they have reduced exposure to avoid loss, they may fear missing out.

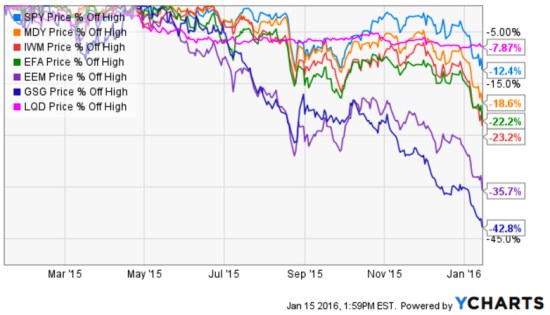
Since global markets declined around August and some markets recovered much of their losses by November, global markets have declined again. Below are charts of U.S. stocks, International stocks, U.S. bonds, and commodities. Even the iShares iBoxx $ Investment Grade Corporate Bond ETF that seeks to track the investment results of an index composed of U.S. investment grade corporate bonds is near -8% from its peak. Small and mid companies U.S. stocks are down more than -20% from their peak. Commodities and emerging countries are down the most.

global markets 2016-01-15_13-59-45.jpg

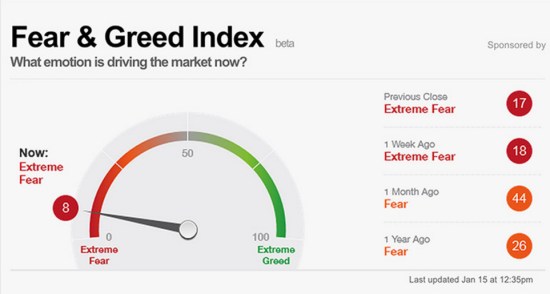
This all started with investors being optimistic in late October as I mentioned in Fear and Greed is Shifting and Models Don’t Avoid the Feelings. So, it is no surprise that today is just the opposite. As markets have declined investors become more and more fearful. As of now, Extreme Fear is the driver of the market.  Below is the current reading of the CNN Fear & Greed Index.

Fear and Greed Index

Source: CNN Fear & Greed Index 

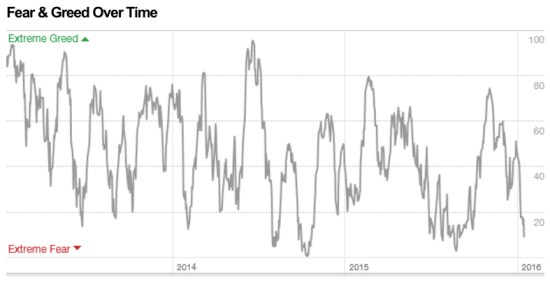
As you see in the chart below, it’s now getting close to the Extreme Fear levels that often signal at least a short-term low.

Fear and Greed Over Time

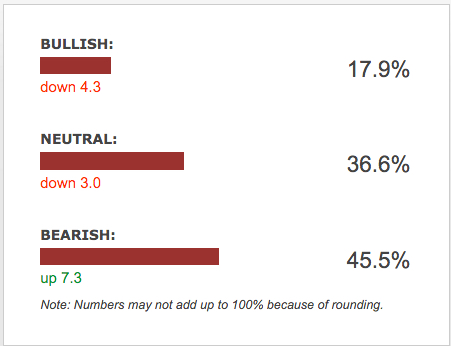
Another publicly available measure of investor sentiment is the AAII Investor Sentiment Survey. The AAII Investor Sentiment Survey measures the percentage of individual investors who are bullish, bearish, and neutral on the stock market for the next six months; individuals are polled from the ranks of the AAII membership on a weekly basis. The most recent weekly survey shows investors are very bearish and again, such pessimism occurs after price declines and at such extremes sometimes precedes a reversal back up.

Survey Results for Week Ending 1/13/2016

AAII Investor Sentiment January 2016

Source: AAII Investor Sentiment Survey

I say again what I said in October: This is the challenge in bear markets. In a bear market, market prices swing up and down along the way. It’s these swings that lead to mistakes. Above was a chart of how the Fear and Greed Index oscillates to high and low points over time. Investors who experience these extremes in emotion have the most trouble and need to modify their behavior so they feel the right feeling at the right time. Or, hire a manager with a real track record who can do it for them and go do something more enjoyable.

Fear and Greed is Shifting and Models Don’t Avoid the Feelings

Investors are driven by fear and greed. That same fear and greed drives market prices. It’s Economics 101 “Supply and Demand”. Greed drives demand, fear drives selling pressure. In fact, investors are driven by the fear of losing more money when their account is falling and fear missing out if they have cash when markets go up. Most investors tend to experience a stronger feeling from losing money than they do missing out. Some of the most emotional investors oscillate between the fear of missing out and the fear of losing money. These investors have to modify their behavior to avoid making mistakes. Quantitive rules-based systematic models don’t remove the emotion.

Amateur portfolio managers who lack experience sometimes claim things like: “our quantitive rules-based systematic models removes the emotion”. That couldn’t be further from the truth. Those who believe that will eventually find themselves experiencing feelings from their signals they’ve never felt before. I believe it’s a sign of high expectations and those expectations often lead to even stronger reactions. It seems it’s the portfolio managers with very little actual performance beyond a backtest that make these statements. They must believe a backtested model will act to medicate their feelings, but it doesn’t actually work that way. I believe these are the very people who over optimize a backtest to make it perfectly fit historical data. We call it “curve-fitting” or “over-fitting”, but it’s always “data mining”. When we backtest systems to see how they would have acted in the past, it’s always mining the data retroactively with perfect hindsight. I’ve never had anyone show me a bad backtest. If someone backtests entry and exit signals intended to be sold as a managed portfolio you can probably see how they may be motivated to show the one that is most optimized to past data. But, what if the future is very different? When it doesn’t work out so perfectly, I think they’ll experience the very feelings they wish to avoid. I thought I would point this out, since many global markets have been swinging up and down. I’m guessing some may be feeling their feelings.

The CNN Fear & Greed Index shows investor fear and greed shifted to Extreme Fear a month ago as the popular U.S. stock indexes dropped about -12% or more. Many sectors and other markets were worse. Since then, as prices have been trending back up, Greed is now the driver again. I believe fear and greed both drives market prices but also follows price trends. As prices move lower and lower, investors who are losing money get more and more afraid of losing more. As prices move higher and higher, investors get more and more greedy. If they have reduced exposure to avoid loss, they may fear missing out.

CNN Fear and Greed IndexSource: http://money.cnn.com/data/fear-and-greed/

This is the challenge in bear markets. In a bear market, market prices swing up and down along the way. It’s these swings that lead to mistakes. Below is a chart of how the Fear and Greed Index oscillates to high and low points over time. Investors who experience these extremes in emotion have the most trouble and need to modify their behavior so they feel the right feeling at the right time. Or, hire a manager with a real track record who can do it for them and go do something more enjoyable.

Fear and Greed Over time investor sentiment

Source: http://money.cnn.com/data/fear-and-greed/

Fear is Driving Stocks Down, or is Declining Stocks Driving Fear?

The last time I pointed out a short-term measure of extreme investor sentiment was August 4, see “Extreme Fear is Now the Return Driver“. At that time, popular stock indexes had declined -3% or more and as prices fell, investor fear measures increased.

As stocks rise, investors get complacent and brag about their profits. After prices fall, investor fear measures start to rise.

Since I pointed out “Extreme Fear is Now the Return Driver”, the Dow Jones Industrial Average went on to trend back up 5% by mid September. Below is a price chart for the Dow year to date. I marked August 4th with a red arrow. You can see how the price trend had declined sharply, driving fear of even lower prices, then it reversed back up. Fear increases after a decline and when fear gets high enough, stocks often reverse back up in the short term. They get complacent and greedy after prices rise to the point there are no buyers left to keep bidding prices up, then prices fall. Investors oscillate between the fear of missing out and the fear of losing money.

dow jones stock index year to date

Source: http://www.stockcharts.com

Since mid September, the price trend has drifted back down over 4% from the peak. As you can see, the Dow has made no gain for the year 2014. It is no surprise that investor sentiment readings are now at “Extreme Fear” levels, as measured by the Fear & Greed Index below.

Fear and Greed Index

Source: Fear & Greed Index CNN Money

So, the last time investor fear levels got this high, stocks reversed back up in the weeks ahead. However, it doesn’t always work out that way. These indicators are best used with other indications of trend direction and strength to understand potential changes or a continuation. For example, we commonly observe 4% to 5% swings in stock prices a few times a year. That is a normal range and should be expected. However, eventually prices will decline and investors will continue to fear even more losses. As prices fall, investors sell just because they’re losing money. Some sell earlier in the decline, some much later. You may know people who sold after they were down -50% in 2008 or 2002.  The trouble with selling out of fear is: when would they ever get back in? That’s why I manage risk with predefined exit points and I know at what point I would reenter.

My point is: fear always has the potential to become panic selling leading to waterfall declines. Panic selling can take weeks or months to drive prices low enough that those who sold earlier (and avoided the large losses and have cash available) are willing to step in to start buying again. Those who stay fully invested all the time don’t have the cash for new buying after prices fall. It’s those buy and hold (or re-balance) investors who also participate fully in the largest market losses.  It’s those of us who exit our losers soon enough, before a large decline, that have the cash required to end the decline in prices.

Selling pressure starts declines, new buying ends them.

We’ll see in the weeks ahead if fear has driven prices to a low enough point that brings in new buying like it has before or if it continues into panic selling. There is a chance we are seeing the early stages of a bear market in global stocks, but they don’t fall straight down. Instead, declines of 20% or more are made up of many cycles of 5 – 10% up and down along the way. So, we shouldn’t be surprised to see stock prices drift up 5% again, maybe even before another -10% decline.

Declining stocks drive fear, but fear also drives stocks down.

Let’s see how it all unfolds…

Trend Following Doesn’t Always Mean Crowd Following

“Trading has taught me not to take the conventional wisdom for granted. What money I made in trading is testimony to the fact that the majority is wrong a lot of the time. The vast majority is wrong even more of the time. I’ve learned that markets, which are often just mad crowds, are often irrational; when emotionally overwrought, they’re almost always wrong.”

Richard Dennis  (Famous Trend Follower)


Richard J. Dennis, a commodities speculator once known as the “Prince of the Pit,”. In the early 1970s, he borrowed $1,600 and reportedly made $200 million in about ten years.


Extreme Fear is Now the Return Driver

A professional investment adviser recently passed along some materials and asked for my opinion about a “tactical model” offered by another money manager. I was surprised that they expect great results from their model when it said something like:

“As investors become more risk-averse, the model becomes more defensive and vice versa.”

Let’s consider that for a moment.

As investors become more risk-averse, the model becomes more defensive. When investors become more risk-seeking, the model becomes more offensive.

That surprises me because investor sentiment is usually used as a countertrend indicator, not as a trend following indicator. Investors often get overly optimistic after prices have trended up and investors get more afraid after prices have trended down.

They went on to say they also use economic indicators as their signal to increase and decrease exposure. I am always concerned when I hear of someone using anything other that the direction of the price trend itself. Other indicators like credit spreads or perceived risk premiums are derivatives of price and it’s the directional movement of the price trend itself we really want. If the price gains 5%, we make money. If the price loses 5%, we lose money. If the price does nothing and the ratio or spread you rely on goes up or down, it did nothing for you. If you use something that is a derivative of the price itself, you have the potential to stray far from the price trend itself.

All blow-ups in history started that way.

Investor sentiment is usually wrong. It isn’t something I’d want to follow. If anything, I’d want to do the opposite of investor sentiment when it reaches an extreme. I occasionally point out my observations when investor sentiment reaches an extreme. When I do, I’ll highlight a simple sentiment gauge that is publicly available on the CNN Money website. Now, that gauge doesn’t actually have a signal that says when it has reached an extreme. It’s just a gauge to swings from one extreme to the other and spends a lot of time in between. It isn’t what is telling me to share my observations – it’s not my signal. I have other systems for actually doing that, but my systems often coincide with extreme readings in the Fear and Greed Index.

investor sentiment fear driving stocks

source: Fear and Greed Index


As of Friday, fear is driving stocks. A few weeks ago I pointed out “It’s official: extreme greed is driving the stock market”. Prices had been rising and investors became more and more optimistic. Stocks have now fallen about 3 – 4% and investor sentiment quickly shifted from “Extreme Greed” a few weeks ago to “Extreme Fear” now. The stock market had gone months without a 1% move, so a -2% down day got their attention.

stock market decline investor fear

source: http://www.stockcharts.com

Investor sentiment isn’t necessarily and indicator I use to increase and decrease exposure, but instead one that is useful to help investors understand problems in their behavior. If you find yourself getting more aggressive after prices have already made a big move, or scared after price declines, you may find it useful to monitor the Fear and Greed Index to help adjust your behavior. That money manager may be one of them.

If anything, you may find increasing and decreasing exposure to risk is best done opposite of sentiment extremes, not along with it. Investor sentiment is usually wrong, not right. Extreme fear occurs at lows, extreme greed at highs.