The stock market declined with heavy selling pressure on a major stock market anniversary that I haven’t heard anyone mention.
October 10, 2018, is the 10-year anniversary of the waterfall decline of 2008.
Below is the S&P 500 stock index from October 9, 2007 to October 10, 2008. I remember it very well. It was the first part of the waterfall decline up to this day 10 years ago.
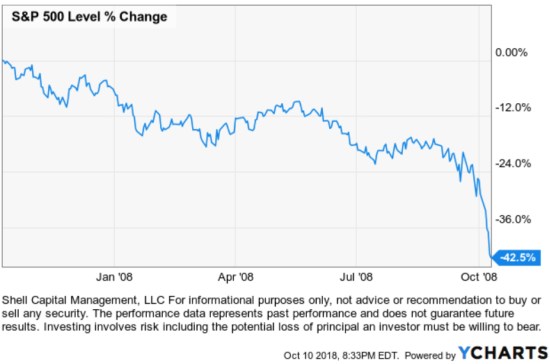
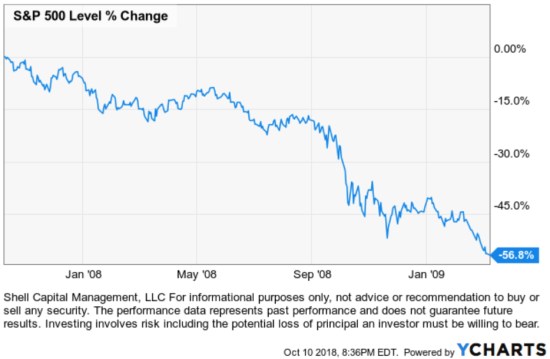
But, as a reminder, while this bear market is often called the “2008 Financial Crisis” and misquoted as being only about the year 2008, it actually continued through March 9, 2009.
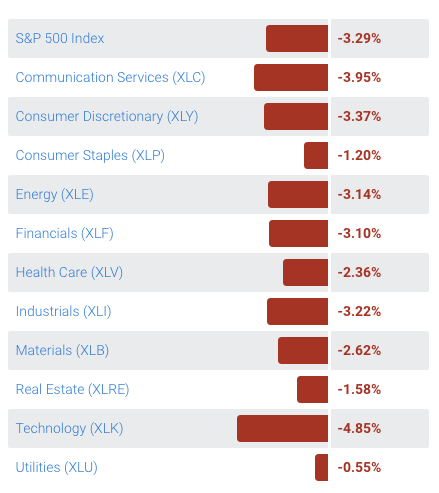
With stock indexes only about -5% or so off their all-time highs, we are far from that today. But, the stock market decline today was impressive in magnitude and broad across all sectors.
The breadth of the decline was unmistakable by the 50% decline in the % of stocks in the S&P 500 trading above their 50 day moving average. The percentage of stocks trading above the moving average is a breadth indicator that measures internal strength or weakness in the stocks in the index and the index itself. We say that breadth is strong when the majority of stocks in an index are trading above their moving average. Since the 50-day moving average is used to measure the short-medium term trend, it reveals that only 24% of the 500 stocks in the S&P 500 index are above their short-term trend.

I colored the top red and the bottom green because the extreme highs and extreme lows can signal overbought and oversold levels.
The indicator is an oscillator that cycles between 0% and 100%.
After most stocks have trended up, we say an uptrend has broad participation, which is positive. However, markets cycle and oscillate up and down, so once most stocks have already been in uptrends at some point they reverse back down.
After most stocks have trended down, we say a downtrend becomes washed out. As selling eventually gets exhausted because those who want to sell have already sold.
Next, we observe the % of stocks in the S&P 500 index that are trending above their 200 day, which a longer term trend signal. 19% of the stocks declined below their 200 day moving average today leaving about half of the stocks still in a longer-term uptrend.

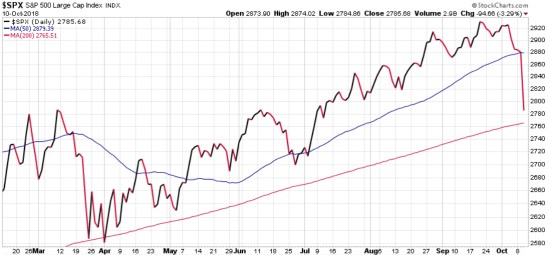
Since we are talking about moving averages and the S&P 500, below is the index itself with the 50 and 200 day moving average. Notice the 50 day moving average has been too tight to contain the uptrend. In other words, entering and exiting it would lead to many buys and sells and whipsaws like in June. The 200 day has better contained the trend since April, but notice if it were used as an exit it would have resulted in selling at the low. This observation is just using these moving averages as a very simple way to define uptrend vs. downtrend, it is not a complete trading system. Such measures are never perfect, and they don’t have to be.
Today’s decline was impressive because the stock indexes declined over -3% in a single day. One day doesn’t make a trend, but it was enough to erase most of the year to date gains for the stock index.
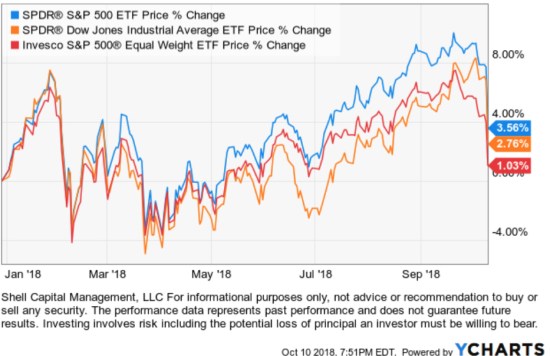
The Dow Jones Industrial Average of 30 of America’s largest companies declined even more than the S&P 500. There was even more weakness in small companies, momentum stocks, and an ETF tracking the top-ranked growth and momentum stocks by Investor’s Business Daily declined nearly -6%. As a proxy for leading growth and momentum stocks, this is an indication the leaders declined the most today.

You can probably see why I believe it’s essential to actively manage risk by knowing in advance when to exit a loser to cut losses short as well as understanding the market risk level. For those of us who weren’t fully exposed to the decline who have the capital to eventually buy at lower prices, we get to take advantage of a falling trend.
Over the past week, I shared observations of volatility expansion as the implied volatility index has been trending up. Below is its year to date trend.

Here it is over the past week since I mentioned it. I included the S&P 500 stock index to illustrate as the stock market declined about -5% the past week, implied volatility expanded 98%.

We’ll see in the days and weeks ahead if this is the beginning of a more significant downtrend that becomes a waterfall decline or if it was enough to exhaust the selling pressure of those who wanted to sell.
Mike Shell is the Founder and Chief Investment Officer of Shell Capital Management, LLC, and the portfolio manager of ASYMMETRY® Global Tactical.
The observations shared on this website are for general information only and are not specific advice, research, or buy or sell recommendations for any individual. Investing involves risk including the potential loss of principal an investor must be willing to bear. Past performance is no guarantee of future results. The presence of this website on the Internet shall in no direct or indirect way raise an implication that Shell Capital Management, LLC is offering to sell or soliciting to sell advisory services to residents of any state in which the firm is not registered as an investment advisor. Use of this website is subject to its terms and conditions.

You must be logged in to post a comment.