Realized volatility has reached an extreme low.
See the implications at Volatility Expansions Eventually Follow Periods of Low Volatility.
Realized volatility has reached an extreme low.
See the implications at Volatility Expansions Eventually Follow Periods of Low Volatility.
Volatility trading may be used for asymmetric risk/reward when the odds are in our favor.
That’s the proposition of:
Expected volatility for the S&P 500 is fading.
A CBOE Volatility Index (VIX) level of 15.78 signals the market expectation for annualized vol over the next 30 days has now declined to 15.78%.

Options speculators and hedgers don’t seem too concerned about the upcoming seasonally weak period, among other risks.
Mike Shell is the Founder and Chief Investment Officer of Shell Capital Management, LLC, and the portfolio manager of ASYMMETRY® Global Tactical. Mike Shell and Shell Capital Management, LLC is a registered investment advisor focused on asymmetric risk-reward and absolute return strategies and provides investment advice and portfolio management only to clients with a signed and executed investment management agreement. The observations shared on this website are for general information only and should not be construed as advice to buy or sell any security. Securities reflected are not intended to represent any client holdings or any recommendations made by the firm. Any opinions expressed may change as subsequent conditions change. Do not make any investment decisions based on such information as it is subject to change. Investing involves risk, including the potential loss of principal an investor must be willing to bear. Past performance is no guarantee of future results. All information and data are deemed reliable but is not guaranteed and should be independently verified. The presence of this website on the Internet shall in no direct or indirect way raise an implication that Shell Capital Management, LLC is offering to sell or soliciting to sell advisory services to residents of any state in which the firm is not registered as an investment advisor. The views and opinions expressed in ASYMMETRY® Observations are those of the authors and do not necessarily reflect a position of Shell Capital Management, LLC. The use of this website is subject to its terms and conditions.
The year 2020 has been quite a ride for most of us.
It started out with the stock indexes trending up, then collapsing over -30% in March. Now, the stock market proxies are reaching new highs.

Clearly, the trend is up recently, and we’re in this trend.
Overall, these volatile conditions has been hostile for both active and passive strategies.
I’m about as active, tactical, as it gets, and even I’m not thrilled with 2020.
I normally enjoy volatility expansions and such, but this one has presented unprecedented risks from the uncertainty of the global pandemic, but also the risk of price shocks as we saw in March.
Oh, and then there was a contentious Presidential Election.
The risk now is a price shock driven by the enormous stimulus because of the uncertainty of how it will all unfold.
It’s all part of it, and I do embrace uncertainty. I enjoy watching how a movie unfolds, and don’t like to know in advance, even if I could.
I just keep doing what I do; adapt, improvise, and overcome.
It is what it is.
Speaking of volatility: the CBOE S&P 500 Volatility Index (VIX) signals expected volatility is evaporating. The VIX has contracted back down to near 20 again, the same range it reached in August. So, the demand for the protection of options is declining. Sometimes it’s a good sign, and the volatility contraction could continue. Notice in January and February the VIX was at 12, today it’s nearly 22, so it’s elevated.

I’m on guard to protect my profits, so I actively monitor risk and sentiment indicators to see when the potential for a price trend reversal is more likely.
I think we’re starting to get there, but we’ve got aggressive stimulus acting as a put option.
It could keep going.
But, the percent of stocks in the S&P 500 above their 200 day moving averages measures the breadth of participation in the uptrend. Right now, 90% of the 500 or so stocks are in longer term uptrends. That means only 10% are not in uptrends. This strong breadth is a positive sign for momentum, but once it reaches such a high level I begin to wonder when the buying enthusiasm may dry up.

After most of the stocks have already been driven up, we have to wonder when the bullish sentiment reverses to selling pressure.
If you want to realize profits, we have to take them at some point.
Unrealized profits are just the markets money, and can fade away quickly, and even become a loss.
That’s all I’ll share for now. I’m just seeing some signs of what may be becoming an inflection point.
I’m usually more early than I am late, so we’ll see how it unfolds from here.
Investors who are inclined to actively manage risk may start considering reducing exposure or hedging off the risk of loss.
Have a Happy Thanksgiving!
Mike Shell is the Founder and Chief Investment Officer of Shell Capital Management, LLC, and the portfolio manager of ASYMMETRY® Global Tactical. Mike Shell and Shell Capital Management, LLC is a registered investment advisor focused on asymmetric risk-reward and absolute return strategies and provides investment advice and portfolio management only to clients with a signed and executed investment management agreement. The observations shared on this website are for general information only and should not be construed as advice to buy or sell any security. Securities reflected are not intended to represent any client holdings or any recommendations made by the firm. Any opinions expressed may change as subsequent conditions change. Do not make any investment decisions based on such information as it is subject to change. Investing involves risk, including the potential loss of principal an investor must be willing to bear. Past performance is no guarantee of future results. All information and data are deemed reliable but is not guaranteed and should be independently verified. The presence of this website on the Internet shall in no direct or indirect way raise an implication that Shell Capital Management, LLC is offering to sell or soliciting to sell advisory services to residents of any state in which the firm is not registered as an investment advisor. The views and opinions expressed in ASYMMETRY® Observations are those of the authors and do not necessarily reflect a position of Shell Capital Management, LLC. The use of this website is subject to its terms and conditions.
I’m hearing a lot of talk about the CBOE Equity Put/Call Ratio tapping an extreme low again. At 0.38, the ratio between equity puts and calls has once again reached its lowest level of the past year.

For a broader perspective, here is the CBOE Equity Put/Call Ratio going back to 2006. Indeed, the current ratio between equity puts and calls is as low as it gets. The lowest level was in 2010, when it reached 0.32, barely lower than the current 0.38 reading. Yes, indeed, the CBOE Equity Put/Call Ratio reaching an extremely low level. In fact, it’s as low as it has ever been going back to 2006.

Normally, we consider such a low level to be an example of extreme complacency and GREED DRIVING THE MARKET. For example, the CBOE Equity Put/Call Ratio is the first of seven indicators used in the Fear & Greed Index.

When the ratio is trending down and at a low level, it’s because equity Call option volume is greater than the equity Put option volume. When there’s more trading volume in equity calls, we assume options traders buying speculative calls, so they are bullish. VERY bullish now.
When the market is so one-sidedly bullish, it’s a contrarian indicator suggesting over-enthusiasm. That is, we assume the calls are mostly speculative positions and puts are defensive, so the demand is on the long side. It’s an imperfect assumption, but I generally agree.
I pointed out a similar extreme read out early June, when Call Volume spiked up to a historically high level. Indeed, the stock market had a -6% down day afterward. This time is a little different, and the chart shows why. Call volume isn’t nearly as high, relatively speaking.

Call volume isn’t as high as it was in June, but put volume is also lower. So, the ratio is at the same low level at 0.38, but the absolute volume is different. It’s still probably an indication of enthusiasm and complacency, but it may not have the delta it had last time.

Keep in mind, even though a call option gives the buyer the right, but not the obligation, to buy a stock at a specified price within a specific time period, call volume also includes sellers of call options. So, the dominant demand could be the selling of call options instead of buying them, but every seller needs a buyer, and the prevailing direction of the trend hints as to the dominant side the market is enthusiastic about.
We can say the same about put option volume. While a put option gives the buyer the right, but not the obligation, to sell a stock at a specified price within a specific time period, put volume also includes sellers of call options. Buying a put option is bearish, but selling a put option is bullish.
Still, the general direction of put/call volume is that equity call volume is assumed to be mostly speculative bets on the stock to rise and put volume is primarily speculative (or hedging) bets on the stock to fall.
So, an observation of put and call volume includes a combination of the options market belief the stocks will trend up, but also less desire to protect against stocks going down.
This time, as seen in the chart, the primary difference in the current Put/Call Ratio is a lower level of put volume, requiring less of an uptrend in call volume to drive the ratio up.
I hope this helps!
Don’t miss out. Get an email of new ASYMMETRY® Observations:
Mike Shell is the Founder and Chief Investment Officer of Shell Capital Management, LLC, and the portfolio manager of ASYMMETRY® Global Tactical. Mike Shell and Shell Capital Management, LLC is a registered investment advisor focused on asymmetric risk-reward and absolute return strategies and provides investment advice and portfolio management only to clients with a signed and executed investment management agreement. The observations shared on this website are for general information only and should not be construed as advice to buy or sell any security. Securities reflected are not intended to represent any client holdings or any recommendations made by the firm. Any opinions expressed may change as subsequent conditions change. Do not make any investment decisions based on such information as it is subject to change. Investing involves risk, including the potential loss of principal an investor must be willing to bear. Past performance is no guarantee of future results. All information and data are deemed reliable but is not guaranteed and should be independently verified. The presence of this website on the Internet shall in no direct or indirect way raise an implication that Shell Capital Management, LLC is offering to sell or soliciting to sell advisory services to residents of any state in which the firm is not registered as an investment advisor. The views and opinions expressed in ASYMMETRY® Observations are those of the authors and do not necessarily reflect a position of Shell Capital Management, LLC. The use of this website is subject to its terms and conditions.
I see some hedging demand in the options market.
The ratio between Index puts and calls doesn’t get much higher than this. The CBOE Index Put/Call Ratio is elevated at 1.86, indicating probable hedging in the options market.

To be sure, here is the index put volume compared to index call volume.

Total options volume is relatively low for 2020, however.

But, right at its long term average.

The CBOE Equity Put/Call Ratio shows us the relative volume of individual stock puts and calls. Equity call volume was extremely high on June 8th, and has since mean reverted. I considered it to be very speculative, since call options are mostly traded for upside speculation in the underlying stock.

I pointed out before that speculative call volume reached an extreme high level, which was a contrary indicator.

Indeed, the S&P 500 index peaked with the peak in speculative call buying.

The decline in the S&P 500 so far has only been -7%, and it started June 8th. It remains about -6% from its high.

The options market doesn’t see a lot of hedging near the stock market peaks, but it sure does after the market trends down.

The S&P 500 tapped the 200 day moving average last week, but is trying to trend above it. Today was a good start, if it can hold the line.

For those who like the concept of mean reversion, here’s your sign.

This market has impressive resilience, but we never know the next -5% or larger down day is coming.
Well, I may not know for sure, but I know when the odds are stack in our favor as I showed in “If we’re going to see a second leg down, this is where I think it will start.”
For now, expected volatility contracted nearly -9% today, so the options market believes we’ll see less range over the next 30 days.

We’ll see…
Mike Shell is the Founder and Chief Investment Officer of Shell Capital Management, LLC, and the portfolio manager of ASYMMETRY® Global Tactical. Mike Shell and Shell Capital Management, LLC is a registered investment advisor focused on asymmetric risk-reward and absolute return strategies and provides investment advice and portfolio management only to clients with a signed and executed investment management agreement. The observations shared on this website are for general information only and should not be construed as advice to buy or sell any security. Securities reflected are not intended to represent any client holdings or any recommendations made by the firm. Any opinions expressed may change as subsequent conditions change. Do not make any investment decisions based on such information as it is subject to change. Investing involves risk, including the potential loss of principal an investor must be willing to bear. Past performance is no guarantee of future results. All information and data are deemed reliable but is not guaranteed and should be independently verified. The presence of this website on the Internet shall in no direct or indirect way raise an implication that Shell Capital Management, LLC is offering to sell or soliciting to sell advisory services to residents of any state in which the firm is not registered as an investment advisor. The views and opinions expressed in ASYMMETRY® Observations are those of the authors and do not necessarily reflect a position of Shell Capital Management, LLC. The use of this website is subject to its terms and conditions.
Implied volatility, as measured by the CBOE Volatility Index (VIX) has trended up about 50% since the most recent low on June 5th. I’ll call it a moderate volatility expansion. Normally a volatility expansion from 23 to 40 would be considered a material event, but relative to the highest spike we’ve seen in March, it doesn’t seem huge for 2020.

The Bank of America Bull & Bear Indicator is at 0.90 vs. 0.40 last week. It is used as contrarian indicator to identify market extremes in investor sentiment. Currently, their measure of investor sentiment is very bearish, which is bullish for the stock market.

Bank of America Private Client Sentiment shows bearishness, and here is a line chart showing its history.

On the topic of investor sentiment, and the Bank of America Bull & Bear Indicator, here is a chart of its history going back to 2002. As marked on the chart, it was backtested pre-2013.

I share the CNN Fear & Greed Index a lot, because it’s easily assessable, so anyone can view it. The Fear & Greed Index is neutral right now.

Within the Fear & Greed Index are seven different investor sentiment indicators. Unlike the Bank of America Private Client Bull & Bear Indicator, which is a survey of their clients, the Fear & Greed Index is derived from quantitative technical indicators.
Stock price breadth, or how well stocks are participating in the uptrend, is the leading driver on the Greed side. They use the McClellan Volume Summation Index, which measures advancing and declining volume on the NYSE. It shows during the last month, approximately 8.08% more of each day’s volume has traded in advancing issues than in declining issues, pushing this indicator towards the upper end of its range for the last two years, which is extremely bullish.

The only other of the seven indicators showing bullish investor sentiment is safe haven demand. That is, the demand for bonds over stocks. They measure it by the difference between the past 20 day stock and bond returns. Stocks have outperformed bonds by 6.99% during the last 20 trading days. This is close to the strongest performance for stocks relative to bonds in the past two years and indicates investors are rotating into stocks from the relative safety of bonds. Of course, this bullish investor sentiment is a sign that greed is driving the market. Notwithstanding these two extremes, overall, the Fear & Greed Index remains neutral.

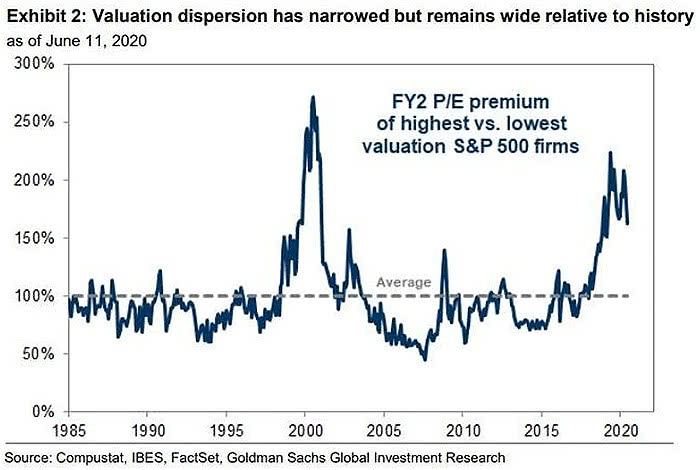
Value is a Value
The dispersion of stock valuation multiples between the lowest and highest valuations has narrowed. But, despite the recent relative strength in value, it is still wide relative to history. So, value stocks remain a relative value.
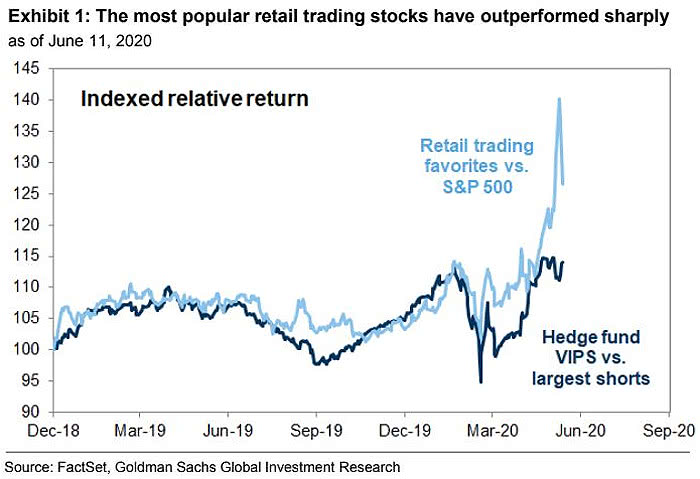
Hot Momentum Stocks are Showing Relative Strength
According to Goldman Sachs, the most popular retail trading stocks have materially outperformed the S&P 500, so far.
Cross-Asset Realized Volatility has been Extreme
Another sign of dispersion is the number of 3 standard deviation prices moves. We’ve already seen more extreme trends across asset classes in 22 years.

Despite the impressive V shaped rally from what is so far the low on March 23rd, I continue to notice the mean reversion year to date and over the past year. Here is year to date, and I marked the high, low, and average percentage.

At the low, the S&P 500 was down about -31% YTD. With the help of a very aggressive Federal Reserve proving liquidity, it has recovered most of the decline in one of the fastest in history.
It ain’t over till it’s over, and this ain’t over.
Asymmetry is about the upside vs. the downside in terms of asymmetric risk/reward. No observation of the price trend is complete without also noting the downside drawdown it took to achieve it. The drawdown for the S&P 500 was an astonishing -34% in just 23 days. It’s a reminder of risk.

I believe risk must be measured, directed, and controlled if we are to compound capital positively.
It doesn’t matter how much the return is if the downside risk is so high you tap out before it’s achieved.
Clearly, in 2020, we’ve surely seen some of the finest examples of risk, divergence, and volatility.
Mike Shell is the Founder and Chief Investment Officer of Shell Capital Management, LLC, and the portfolio manager of ASYMMETRY® Global Tactical. Mike Shell and Shell Capital Management, LLC is a registered investment advisor focused on asymmetric risk-reward and absolute return strategies and provides investment advice and portfolio management only to clients with a signed and executed investment management agreement. The observations shared on this website are for general information only and should not be construed as advice to buy or sell any security. Securities reflected are not intended to represent any client holdings or any recommendations made by the firm. Any opinions expressed may change as subsequent conditions change. Do not make any investment decisions based on such information as it is subject to change. Investing involves risk, including the potential loss of principal an investor must be willing to bear. Past performance is no guarantee of future results. All information and data are deemed reliable but is not guaranteed and should be independently verified. The presence of this website on the Internet shall in no direct or indirect way raise an implication that Shell Capital Management, LLC is offering to sell or soliciting to sell advisory services to residents of any state in which the firm is not registered as an investment advisor. The views and opinions expressed in ASYMMETRY® Observations are those of the authors and do not necessarily reflect a position of Shell Capital Management, LLC. The use of this website is subject to its terms and conditions.
And just like that, we have another volatility expansion.
Yesterday, in Global Macro: Volatility expands and divergence between sectors I suggested “It is likely we’ll see a volatility expansion from here.” Indeed, with the VIX and VVIX (volatility of volatility) both up 10% today, we are entering a volatility expansion.

Implied volatility had settled down gradually since it peaked in March, but it now looks like we may see prices spread out into a wider range.
As of this moment, the S&P 500 is down -2.34% and it is reversing down from the average of its price trend year to date, so I’ll call it “mean reversion.”

In fact, it’s mean reversion from the 1 year price trend, too.

It’s a negative sign that small and mid size stocks are trending down even more, down nearly -4%. They’ve been laggards in this rally from the March low. In the early stage of a new bullish trend, smaller companies should trend up faster. Smaller companies are more nimble than large companies, so we expect to see them recover quicker from declines. When they don’t, we consider it a bearish divergence.

I can’t say I’m surprised. This is likely the early stage of a deeper bear market as I’ve operated through 2000-03 and 2007-09.
But, nothing is ever a sure thing. It’s probabilistic and probably necessarily implies uncertainty.
Managing money though a big bear market isn’t as simple as an ON/OFF switch, whereby we get out near the peak and then reenter near the low. I’ve traded through a lot of nasty market conditions, the nastiest aside from the Great Depression, and that isn’t how it has worked for me. I didn’t just get out and then back in a year or two later. There are opportunities in between for skilled tactical traders who are able to direct and control risk and manage drawdowns.
There’s a good chance this becomes a prolonged bear market similar to what we’ve seen twice over the past two decades I’ve been a professional money manager.
I wrote yesterday;
“It’s probably a good time for individual investors who don’t have tight risk management systems to shift to defense to preserve capital, but it’s not a guarantee, and yes, we’ll see.”
I’ll just leave it at that, today.
Mike Shell is the Founder and Chief Investment Officer of Shell Capital Management, LLC, and the portfolio manager of ASYMMETRY® Global Tactical. Mike Shell and Shell Capital Management, LLC is a registered investment advisor focused on asymmetric risk-reward and absolute return strategies and provides investment advice and portfolio management only to clients with a signed and executed investment management agreement. The observations shared on this website are for general information only and should not be construed as advice to buy or sell any security. Securities reflected are not intended to represent any client holdings or any recommendations made by the firm. Any opinions expressed may change as subsequent conditions change. Do not make any investment decisions based on such information as it is subject to change. Investing involves risk, including the potential loss of principal an investor must be willing to bear. Past performance is no guarantee of future results. All information and data are deemed reliable but is not guaranteed and should be independently verified. The presence of this website on the Internet shall in no direct or indirect way raise an implication that Shell Capital Management, LLC is offering to sell or soliciting to sell advisory services to residents of any state in which the firm is not registered as an investment advisor. The views and opinions expressed in ASYMMETRY® Observations are those of the authors and do not necessarily reflect a position of Shell Capital Management, LLC. The use of this website is subject to its terms and conditions.
Implied volatility is mean revering in some ways. Volatility expands and contracts, so it oscillates between a higher level an a lower range.
I was monitoring various measures of volatility, such as the CBOE Implied Volatility Index as my systems were indicating a potential short term trend change.
Sure enough, at the end of the trading day, VIX expanded 20%.

Over the year to date time frame, VIX has reverted to its mean.
It is likely we’ll see a volatility expansion from here.
The VIX is implied volatility, which is its the expected vol over the next 30 days for the S&P 500 stocks. More specifically, a VIX of 33 implies a 2% range over the next 30 days. That’s less than half what it was in March with the VIX at 80, it implied a 5% range in prices. Still, investors have gotten used to a VIX around 12 or lower in recent years, except for the occasional volatility expansions. Over the past decade, the bull market presented an average VIX of 17.45, which is materially lower than the long term average of 19.36. At a 17 vol, the implied vol is around 1% a month.

The VIX isn’t always right. Implied vol is calculated based on the options prices of the S&P 500 stocks. It’s a forward looking expectation, as opposed to a rear view looking historical actual volatility, such as standard deviation.
The VIX of VIX (VVIX) is a measure of the volatility of the VIX. The CBOE’s VIX measures the short-term volatility of the S&P 500, and the VVIX measures the volatility of the price of the VIX. So, we call it the VIX of VIX, or the vol of vol.
VVIX gained 10% today, too, signaling a vol expansion.

All of this is coming at at time when my systems are showing a declining rate of change over the past month. The initial thrust off the March 23rd low had momentum, but since then the rate of change has been slowing. It’s running out of steam, or velocity.
Don’t fight the Fed
My systems monitor thousands of macroeconomic data and programmed to let me know what has changed. Macroeconomics is an observation of the entire economy, including the growth rate, money and credit, exchange rates, the total amount of goods and services produced, total income earned, the level of employment of productive resources, and the general behavior of prices.
I know, sounds exhausting. It is, unless you have a computerized quantitate systems to do it with perfection.
Looking at global macroeconomics, the Fed balance sheet is a key right now.
The H.4.1 from the Federal Reserve is a weekly report which presents a balance sheet for each Federal Reserve Bank, a consolidated balance sheet for all 12 Reserve Banks, an associated statement that lists the factors affecting reserve balances of depository institutions, and several other tables presenting information on the assets, liabilities, and commitments of the Federal Reserve Banks.
US Total Assets Held by All Federal Reserve Banks is the total value of assets held by all the the Federal Reserve banks. This can include treasuries, mortgage-backed securities, federal agency debt and and so forth. During the Great Recession, having already lowered the target interest rate to 0%, the Federal Reserve further attempted to stimulate the US economy by buying and holding trillions of dollars worth of US treasuries and mortgage-backed securities, a process known as Quantitative Easing or QE.
US Total Assets Held by All Federal Reserve Banks is at a current level of 6.721 TRILLION, up from 6.656 TRILLION last week and up from 3.890 TRILLION one year ago. This is a change of 72.80% a year ago.
The chart shows the last 15 years. I marked the last recession in grey.

It’s really high.
The Fed seems much more concerned this time as they have rolled out a much larger helicopter to drop over the cash.
I’m seeing a lot of divergence between sectors as a smaller number of stocks The chart is year to date. Only Technology is positive, by 1.86%. Otherwise, it’s a relative notable range of divergence.

The sector divergence is more obvious over the past month. Barely half of the sectors are positive, the rest and down.

This is just a simple illustration of what appears to be some weakness. The rate of change is slowing and I’m guessing it’s been driven by the massive Fed action.
Now, America is opening for business, but some research I’ve been doing shows it may be a bigger problem that I thought.
I’ll share that shortly.
I’ve also got an important piece I’m going to share about my experience trading the last two big bear markets.
It seems inevitable we’ll get to flow through another one and this one may be bigger and badder, we’ll see.
I think skill and experience is going to be an edge and make all the difference as it did in the past, we’ll see.
But, nothing is ever a sure thing. It’s probabilistic, but probably necessarily implies uncertainty.
It’s probably a good time for individual investors who don’t have tight risk management systems to shift to defense to preserve capital, but it’s not a guarantee, and yes, we’ll see.
Mike Shell is the Founder and Chief Investment Officer of Shell Capital Management, LLC, and the portfolio manager of ASYMMETRY® Global Tactical. Mike Shell and Shell Capital Management, LLC is a registered investment advisor focused on asymmetric risk-reward and absolute return strategies and provides investment advice and portfolio management only to clients with a signed and executed investment management agreement. The observations shared on this website are for general information only and should not be construed as advice to buy or sell any security. Securities reflected are not intended to represent any client holdings or any recommendations made by the firm. Any opinions expressed may change as subsequent conditions change. Do not make any investment decisions based on such information as it is subject to change. Investing involves risk, including the potential loss of principal an investor must be willing to bear. Past performance is no guarantee of future results. All information and data are deemed reliable but is not guaranteed and should be independently verified. The presence of this website on the Internet shall in no direct or indirect way raise an implication that Shell Capital Management, LLC is offering to sell or soliciting to sell advisory services to residents of any state in which the firm is not registered as an investment advisor. The views and opinions expressed in ASYMMETRY® Observations are those of the authors and do not necessarily reflect a position of Shell Capital Management, LLC. The use of this website is subject to its terms and conditions.
On February 6th, I shared and observation in “19 is the new 20, but is this a new low volatility regime?” the lower level of implied (expected) volatility at the time may be driven by two factors that may have been resulting in less concern for volatility. I wrote:
The current bull market that started in March 2009 is the longest bull market in history. It exceeded the bull market of the 1990s that lasted 113 months in terms of time, though still not as much gain as the 90s.
The U.S. is in its longest economic expansion in history, breaking the record of 120 months of economic growth from March 1991 to March 2001, according to the National Bureau of Economic Research. However, this record-setting run observed GDP growth far slower than previous expansions.
The aged bull market and economic expansion can naturally lead to some level of complacency and expectation for less downside and tighter price trends. When investors are uncertain, their indecision shows up in a wide range of prices. When investors are smugger and confident, they are less indecisive and it’s usually after a smooth uptrend they expect to continue.
Well, so much for that.
Here we are, the bull market was interrupted by a -37% in the Dow Jones. So, any higher highs from here will be labeled a new bull market.

The US is now in a recession. The longest economic expansion is over, interrupted by a -4.8% GDP, as discussed in “The longest economic expansion in U.S. history is over, but…”

What about volatlity?
I shared several observations of volatility and
Back in December, I wrote “A volatility expansion seems imminent” which was a follow up to November 16th, “Periods of low volatility are often followed by volatility expansions”.
Don’t say I didn’t tell so, in advance.
I also wrote:
Is the volatility expansion over? in December.
On January 27th, published “Here comes the volatility expansion, but is the coronavirus outbreak in China to blame?”
January 30th “Global Macro: is the coronavirus outbreak crushing the China ETF and causing the volatility expansion?”
February 26th was “What volatility expansions tell us about expectations for stock market trends”
March 3rd was pretty clear “Expect wider price swings in a volatility expansion”
Then, on March 10th I wrote again about the volatility expansion “
Why I’m not surprised to see such a volatility expansion”
This chart was featured in the Wall Street Journal by one of the few outside research I read; The Daily Shot.

Oh yes, did that chart reverse trend as expected.
Now there’s this. The CBOE Volatility Index (VIX) spiked to 82, the highest level of implied vol on record.

But since then, it is gradually trending down.

The options market is pricing in less expected volatility for the S&P 500 stocks over the next 30 days.
It’s a volatility contraction.
Will it continue?
It will as long as expected vol keeps declining. I know; captain obvious.
VIX is trending down, but it’s still at 31, and still a wider than average range of prices spreading out.
If we see a reversal down in stocks, then we’ll see volatility spike again. But for now, it’s a volatility contraction, so I’ll take it.
The Fear & Greed Index is only dialed half way up.


Only two of the Fear & Greed Index indicators are showing greed. Safe haven demand is the biggest, which is the difference between the 20-day stock and bond returns. Stocks have outperformed bonds by 16.29% the last 20 trading days. This is close to the strongest performance for stocks relative to bonds in the past two years and suggests investors are rotating into stocks from the relative safety of bonds.

The other is the Put/Call Ratio. During the last five trading days, volume in put options has lagged volume in call options by 44.87% as investors make bullish bets in their portfolios. However, this among the lowest levels of put buying seen during the last two years, indicating greed on the part of investors.

By my measures, the stock market is just now entering the overbought range, technically, on a short term basis.
For example, the percent of S&P 500 stocks above their 50 day moving average is now up to 74% after todays close. It’s the higher risk zone.

As a testiment to the internal damage done, I present the percent of S&P 500 stocks above their 200 day moving average, which is only at 30%. It tells us most stocks are still in a longer term downtrend after reaching a low of only 3% of stocks above their trend line on March 20th.

And yes, it was very near the March 23rd low only three days later.
Most stocks are participating in the uptrend, as measured by 70% of them above their average of the past 50 days.
Volatiltiy is contracting.
Investor sentiment is gradually shifting. Nothing drives sentiment like the price trend. The price trend is the leading indicator, investors enthusiasm follows it.
All while we just saw the largest drop in economic growth since 2008.
Mike Shell is the Founder and Chief Investment Officer of Shell Capital Management, LLC, and the portfolio manager of ASYMMETRY® Global Tactical. Mike Shell and Shell Capital Management, LLC is a registered investment advisor focused on asymmetric risk-reward and absolute return strategies and provides investment advice and portfolio management only to clients with a signed and executed investment management agreement. The observations shared on this website are for general information only and should not be construed as advice to buy or sell any security. Securities reflected are not intended to represent any client holdings or any recommendations made by the firm. Any opinions expressed may change as subsequent conditions change. Do not make any investment decisions based on such information as it is subject to change. Investing involves risk, including the potential loss of principal an investor must be willing to bear. Past performance is no guarantee of future results. All information and data are deemed reliable but is not guaranteed and should be independently verified. The presence of this website on the Internet shall in no direct or indirect way raise an implication that Shell Capital Management, LLC is offering to sell or soliciting to sell advisory services to residents of any state in which the firm is not registered as an investment advisor. The views and opinions expressed in ASYMMETRY® Observations are those of the authors and do not necessarily reflect a position of Shell Capital Management, LLC. The use of this website is subject to its terms and conditions.
On November 15, 2019, I published “Periods of low volatility are often followed by volatility expansions” and included the below chart.
The point is just as the title said, when stock prices trend up quietly, they are eventually interrupted by the loud bang of falling prices.

In this case, it took a few months to see it play out.
Below, I updated the chart so it still has the same starting date, but shows us what happened after I posted it. The 11/15/19 day is labeled on the chart. It had a small decline shortly after, but then resumed the uptrend.

In fact, the stock index went on to gain 9% from that point and was interrupted by only two small countertrend declines of 3-4%.
That is, until February 19th.
Since the peak, the stock index has declined -19% and volatility has exploded.
The volatility measure I used in the chart is an average of the true range, which accounts for a full price range of the period. The average true range is also what I used to draw the channels above and below the price trend to define “normal” price action.
The average true range of the price trend has increased by 420% since December, from 17 to 97. I know it shocked most people in the market and while I didn’t expect a -19% waterfall in just three weeks, I expected a volatility expansion and mean reversion. As I exited stocks a little early, we see now it didn’t matter this time as the stock market has given up far more upside than we missed out on over those few weeks.
Next, let’s look at a chart of implied volatility as indicated by the VIX based on how the market is pricing options. Implied vol spiked over 200%. I also included the 30-Day rolling volatility of the S&P 500 ETF. Implied volatility lead realized, historical, volatility to the upside.

So, the condition of the US stock market is volatile one as prices and swinging up and down, and only December 2008 in the middle of the Financial Crisis was it higher.

If the VIX is a fear gauge, it’s signaling a lot of fear.
Again, “Periods of low volatility are often followed by volatility expansions” and that’s what we got. This time it got stretched on the upside so far it has snapped back to very quickly and violently correct it.
The good news is, the opposite is also true; periods of high volaltity are eventually followed by volatility contractions.
But, just as before, as it took time for the volatility contraction to become a volatility expansion, we’ll probably see a continuation of price swings and elevated volatility for a while.
Eventually, this too shall pass.
Mike Shell is the Founder and Chief Investment Officer of Shell Capital Management, LLC, and the portfolio manager of ASYMMETRY® Global Tactical. Mike Shell and Shell Capital Management, LLC is a registered investment advisor in Florida, Tennessee, and Texas. Shell Capital is focused on asymmetric risk-reward and absolute return strategies and provides investment advice and portfolio management only to clients with a signed and executed investment management agreement. The observations shared on this website are for general information only and should not be construed as advice to buy or sell any security. Securities reflected are not intended to represent any client holdings or any recommendations made by the firm. I observe the charts and graphs to visually see what is going on with price trends and volatility, it is not intended to be used in making any determination as to when to buy or sell any security, or which security to buy or sell. Instead, these are observations of the data as a visual representation of what is going on with the trend and its volatility for situational awareness. I do not necessarily make any buy or sell decisions based on it. Any opinions expressed may change as subsequent conditions change. Do not make any investment decisions based on such information as it is subject to change. Investing involves risk, including the potential loss of principal an investor must be willing to bear. Past performance is no guarantee of future results. All information and data are deemed reliable but is not guaranteed and should be independently verified. The presence of this website on the Internet shall in no direct or indirect way raise an implication that Shell Capital Management, LLC is offering to sell or soliciting to sell advisory services to residents of any state in which the firm is not registered as an investment advisor. The views and opinions expressed in ASYMMETRY® Observations are those of the authors and do not necessarily reflect a position of Shell Capital Management, LLC. The use of this website is subject to its terms and conditions.
I know, it sounds obvious, but yeah, expect wider price swings in a volatility expansion.
The CBOE S&P 500 Volatility Index (VIX) is a popular measure of the stock market’s expectation of volatility based on S&P 500 index options. The VIX Index is a calculation designed to produce a measure of a constant, 30-day expected volatility of the US stock market, derived from real-time, mid-quote prices of the S&P 500® Index (SPXSM) call and put options.
The VIX index shows us the 30-day expected volatility increased 200% during the February 2020 volatility expansion. I may have to define this rate of change as a volatility explosion. Expansion is the act or process of expanding to become or make larger or more extensive. An explosion is a rapid increase in volume and release of energy in an extreme manner. This looks explosive.

Viewing it over a wide range of the past 10 years, the 30-day expected volatility is elevated to the second-highest level seen since the 2007-09 stock market crash. In 2011, the VIX spiked to 48.

Putting it into an even broader perspective with the larger sample size of 26 years of historical data, the recent 40 level is about as elevated as 30-day expected volatility gets.

I observe volatility from a perspective of both implied (expected) volatility and historical (realized) volatility. Implied volatility a measured by the VIX Index, is typically priced at a premium since options trading sentiment tends to have more of a hedging tilt. In theory, the VIX at 40 suggested expected 30-day volatility of 40%, which is much higher than the 21.5% realized vol as measured by 30-day Rolling Volatility derived from the actual past 30 days of price action. This is just an idealized, overly simplified example, but the point is both realized and expected vol is elevated.

Asymmetric volatility is what we see when equities fall sharply. The asymmetric volatility phenomenon is the observed tendency of equity market volatility to be higher in declining markets than in rising markets. Volatility tends to decrease after prices have trended up as investors and traders (the market) become more and more complacent, expecting a smooth uptrend will continue. Then, after prices decline, complacent investors and traders are caught off guard and surprised when prices trend down, and the more prices fall, the more they fear losing more money. The fear of losing money, then, is another driver of asymmetric volatility; Investors experience the pain of loss twice as much as the joy of gains. Nobel Prize-winning behavioral research finds that losses loom larger than gains and that people are loss averse. So, after prices have fallen, investors and traders sell simply because prices are falling, to cut their losses, and avoid larger losses. This selling pressure becomes a serial correlation, contagion, and prices keep falling until the desire to sell has dried up. It’s what I believe, at least, after studying and observing price trends in real-time professionally over two decades.
We saw asymmetric volatility expansion after the astonishingly smooth uptrend in 2017. In the chart, I overlay the 30 Day Rolling Volatility to visualize how the realized vol declined as the S&P 500 trended up quietly. But lower and falling volatility periods tend to be followed by periods of rising volatility.

US equities went on to recover two major price shocks and asymmetric volatility expansions in 2018, but here we are in 2020 seeing another smooth uptrend with great momentum interrupted by volatility expansion driven by a waterfall decline in stocks.

Asymmetric volatility is when prices drift (trend) up and then crash down.
When realized and implied volatility is elevated, we should expect to see price swings both up and down. Recovery from a downtrend like this is a process, not an event. We’ll probably see many swings up and down along the way, which is especially true if this unfolds into a bigger bear market level downtrend. Although anything can happen, bear markets don’t just happen all at once. The worst bear markets like 2007 to 2009 unfolded with price swings over many years, not just in 2008.
Only time will tell if this is the early stage of a bigger move, but in the meantime, expect larger price swings as prices spread out and the weight of investors decide which direction to lean.
Mike Shell is the Founder and Chief Investment Officer of Shell Capital Management, LLC, and the portfolio manager of ASYMMETRY® Global Tactical. Mike Shell and Shell Capital Management, LLC is a registered investment advisor in Florida, Tennessee, and Texas. Shell Capital is focused on asymmetric risk-reward and absolute return strategies and provides investment advice and portfolio management only to clients with a signed and executed investment management agreement. The observations shared on this website are for general information only and should not be construed as advice to buy or sell any security. Securities reflected are not intended to represent any client holdings or any recommendations made by the firm. I observe the charts and graphs to visually see what is going on with price trends and volatility, it is not intended to be used in making any determination as to when to buy or sell any security, or which security to buy or sell. Instead, these are observations of the data as a visual representation of what is going on with the trend and its volatility for situational awareness. I do not necessarily make any buy or sell decisions based on it. Any opinions expressed may change as subsequent conditions change. Do not make any investment decisions based on such information as it is subject to change. Investing involves risk, including the potential loss of principal an investor must be willing to bear. Past performance is no guarantee of future results. All information and data are deemed reliable but is not guaranteed and should be independently verified. The presence of this website on the Internet shall in no direct or indirect way raise an implication that Shell Capital Management, LLC is offering to sell or soliciting to sell advisory services to residents of any state in which the firm is not registered as an investment advisor. The views and opinions expressed in ASYMMETRY® Observations are those of the authors and do not necessarily reflect a position of Shell Capital Management, LLC. The use of this website is subject to its terms and conditions.
You must be logged in to post a comment.