For me, and everyone else even if they don’t realize it, the price trend is the final arbiter.
For more than two decades, I’ve focused my efforts on developing systems to identify trends early in their stage to capitalize on trends as they continue and exit a trend if it reverses.
It all started in business school, where I earned a Bachelor of Applied Science degree in advanced accounting. It was “advanced” because I took the extra advanced classes above a typical accounting major required to sit for the CPA exam in Tennessee. It basically results in a master’s in accounting, but not really, but it’s just the same 150 credit hours.
I rarely speak of my formal college simply because I haven’t considered it a source of edge for investment management.
But maybe it has.
In some conversations recently, people have asked about my background and how I got started as an investment manager and founder of an investment firm. After further review, I’ve come to realize the knowledge I have of financial statements, and the vast details and fundamental information that make them up, is what drove me to observe very little of it really drives the market price in an auction market.
That’s something I’ve always believed, but it occurred to me during business school.
To be succinct; I very quickly discovered undervalued stocks are trading at a cheap multiple of earnings for a reason, and that’s more likely to continue than to reverse.
I didn’t have a lot of capital to play with, and it was hard earned capital. I worked as a Sheriffs’ Officer full time through college fully time, so it took me a few extra years to complete. I wasn’t about to lose too much of what I had in the stock market, so I aimed to cut my losses short early on.
I’ve focused on cutting my losses short ever since, so now I have about 25 years experience as a tactical trader with an emphasis on the one thing I believe I can best limit or control; the downside of my losers.
When I focus on limiting the downside of loss, I am left to enjoy the upside of gains.
But we can’t do that with fundamentals and valuation. Risk can only be directed, limited, managed, and controlled, by focusing on the price trend.
The price trend is more likely to continue than to reverse, as evidenced even by vast academic studies of momentum.
Because a price trend is more likely to continue than to reverse, it’s essential to realize if you attempt to buy stocks that are in downtrends, you’ll likely experience more downtrend.
So, buying what you perceive are “undervalued” stocks is like catching a falling knife they say.
I’d rather wait for the knife to fall, stab the ground or someone’s foot, then pick it up safely.
Knives a dangerous, and up close, even more dangerous than a gun, so govern yourself accordingly.
Nevertheless, the valuation of stocks and overall valuation of the market by and large can be useful to observe at the extremes in valuation.
The chart below tells the story based on Morningstar’s fair value estimates for individual stocks.
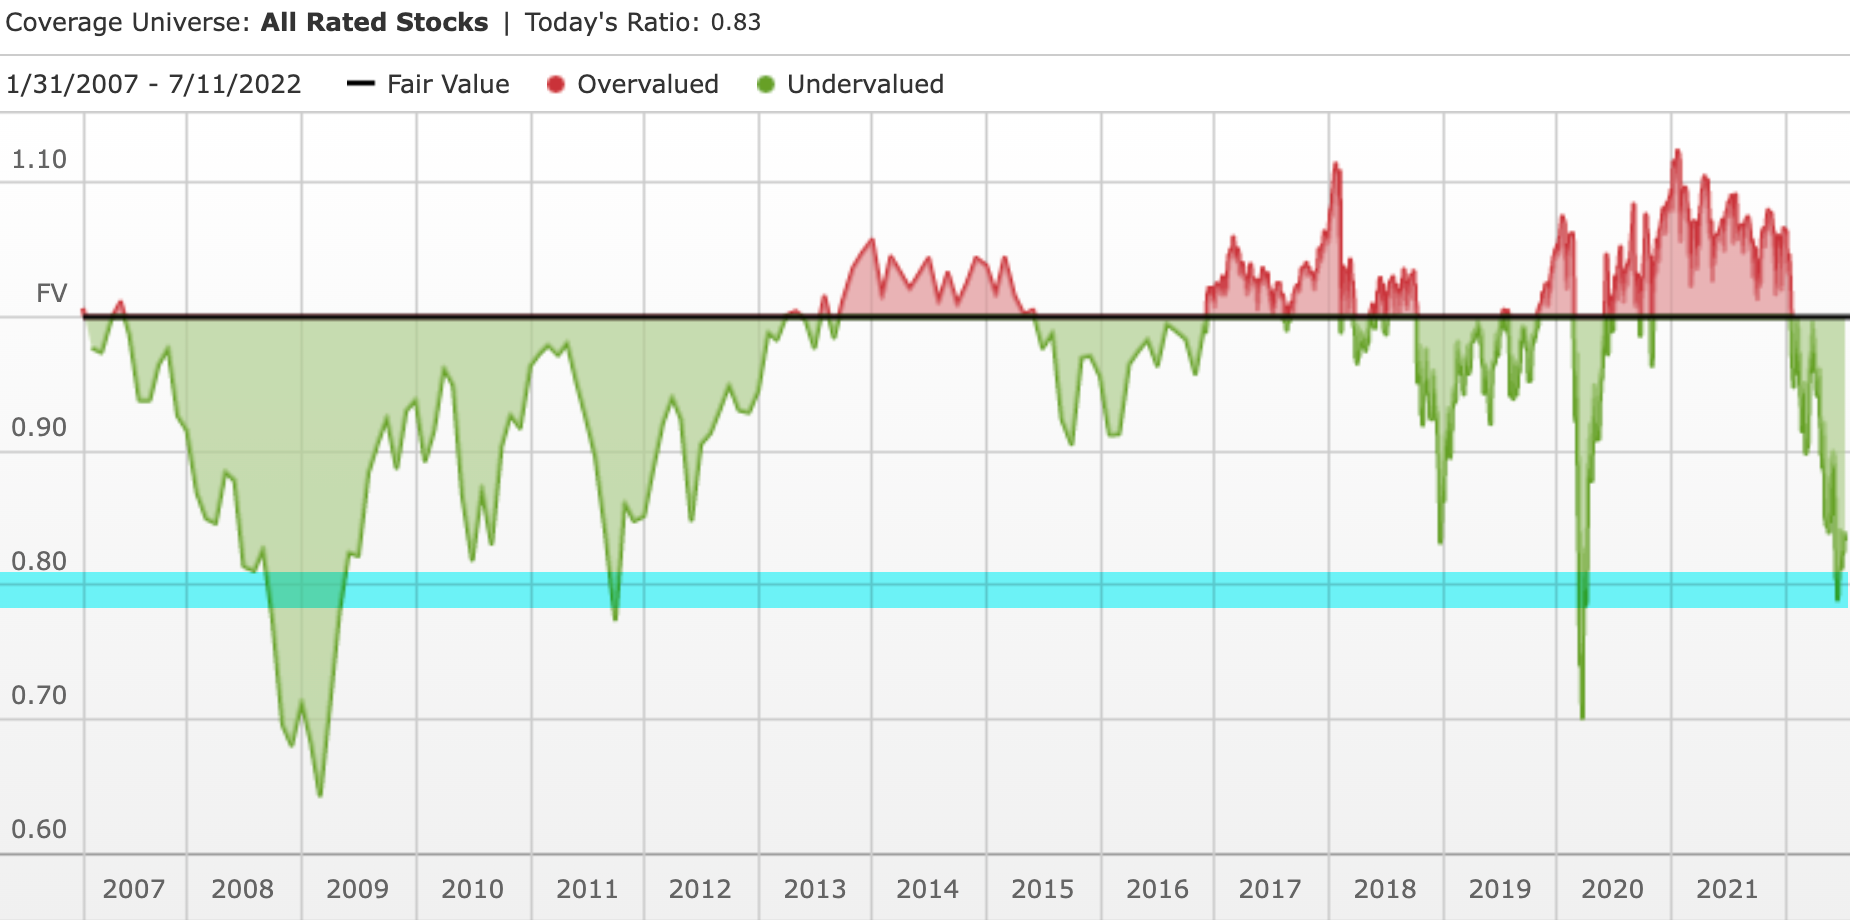
The chart shows the ratio price to fair value for the median stock in Morningstar’s selected coverage universe over time.
- A ratio above 1.00 indicates that the stock’s price is higher than Morningstar’s estimate of its fair value.
- The further the price/fair value ratio rises above 1.00, the more the median stock is overvalued.
- A ratio below 1.00 indicates that the stock’s price is lower than our estimate of its fair value.
- The further it moves below 1.00, the more the median stock is undervalued.
It shows stocks are as undervalued as they were at the low in 2011, nearly as undervalued stocks were March 2020, but not as undervalued as stocks reached in the 2008 stock market crash when the S&P 500 lost -56% from October 2007 to March 2009.
If I were to overall a drawdown chart of the stock index it would mirror the undervalued readings in the chart.
As prices fall, stocks become more undervalued by this measure.
My observation is by and large stocks are relatively undervalued, but they can get much more undervalued if they haven’t yet reached a low enough point to attract institutional buying demand.
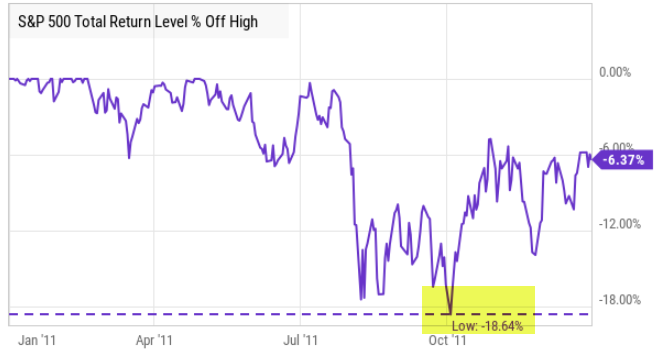
To be sure, in 2011 when stocks were as undervalued as Morningstar suggests they are now, the stock index had declined about -19%, similar to the current drawdown of -23%.
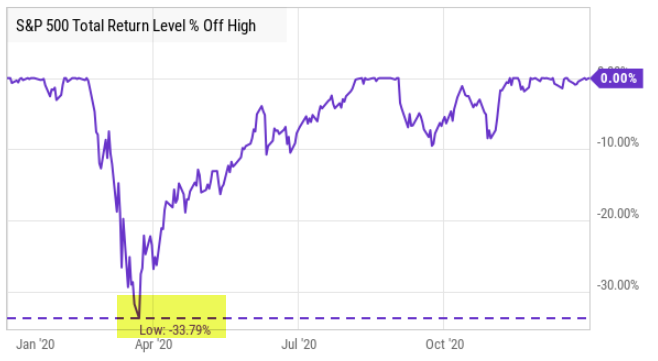
The waterfall decline in stock prices March 2020 was -34%, although it recovered quickly in a v-shaped reversal, so it didn’t get as much attention as the current bear market which is down 10% less, but has lasted for seven months without a quick recovery.
Time allows the losses to sink in for those who are holding their stocks.
This time the average stock is down much more than the stock indexes, too, so if you’re holding the weakest stocks your drawdown is worse than the index.
In that case, you’re probably wondering how low it can go.
If stock prices haven’t yet be driven down to a low enough level to attract big institutional capital to buy these lower prices, stocks can certainly trend down a lot lower from here.
For example, in the 2007 – 2009 bear market known as the 2008 Financial Crisis, one I successfully operated through as a tactical trader and risk manager, the stock index dropped -56% over 16 grueling months.
The infamous 2008 crash included many swings up and down on its way to printing a -56% decline from its high in October 2007.
That’s how bad it could get.
It’s also largely the cause of the situation the U.S. finds itself in today.
Since the 2008 Global Financial Crisis, the U.S. Treasury and Federal Reserve Open Market Committee have provided unprecedented support for the equity market and the bond market.
Passive investors and asset allocators have been provided a windfall from the Fed and Treasury, but it’s time to pay the debt.
For passive investors, they’ve been hammered with large losses this year and risk losing more if stock and bond prices keep trending down.
Stocks are already undervalued, but they can get much more undervalued.
Even worse, as my experience tactically operating through many declines like this since the 1990s reflects, are the paranna bites along with the shark bites.
The shark bite is from a passive asset allocator holding on through a prolonged deep bear market in stock prices as they fall -20%, -30%, -40%, -50% or more.
Because losses are so asymemtric and geometically compound aginast you, these capital losses become harder and harder to recover from.
If you lose -50%, it takes a 100% gain to get it back.
Stock market trends are asymmetric; they trend up much lower than they crash down, so that larger gain needed often takes longer, too.
So your emotional capital is at risk.
When you’re down a lot, you’re thinking and decision-making becomes cloudy and stressed because you[‘re under pressure like a pressure cooker.
You don’t know how low it can go.
If you are a buy and hold asset allocator, your loss is unlimited, as there is not point in which you would exit but zero.
Zero may be unlikely, but -50% or more isn’t, as evidenced by history.
And you’ve not been here before.
You’ve not seen this before.
The Fed has never stretched its open market operations this far before.
We just don’t know what’s going to happen next.
But, I’m prepared to tactically execute through whatever unfolds.
I’m having a great year relatively speaking. I’ve been positive most of the year and haven’t ventured far below our all-time new high.
Times like these are when my skillset is designed to show an edge.
Like many tactical investment managers like trend followers, hedge funds, global macro, I too had a period of relative underperformance of the long-only stock indexes. I held my ground but learned some new tricks during the many swings the past decade, and sharpened my countertrend axe to chip away some of the bad parts we don’t want.
But relative outperformance has never been my objective, especially not against a stock index for stock fund that’s fully invested in stocks all the time.
My objective has always been absolute return, not relative return.
My absolute return objective is what drives me to actively manage risk for drawdown control.
Like a good doctor, I aim to first do no harm… as best I can as a risk taker.
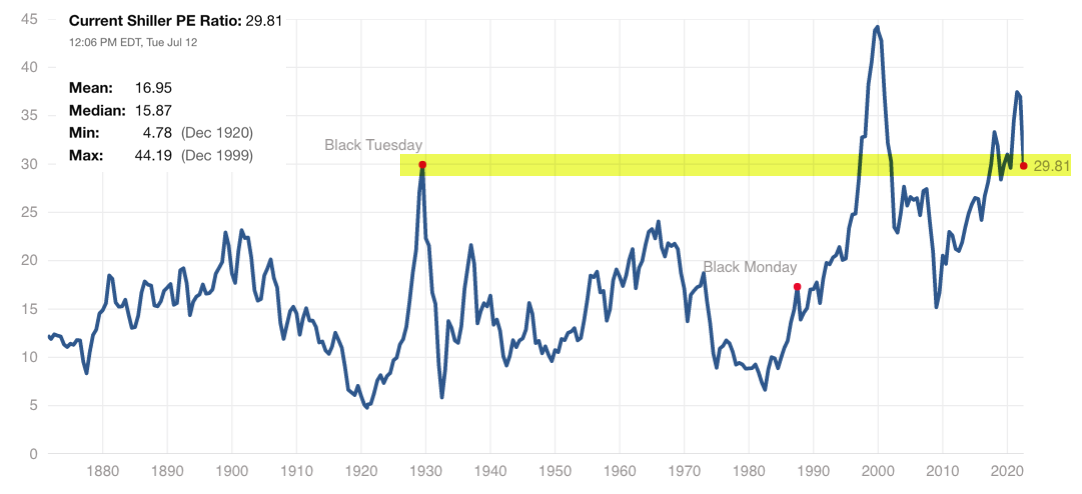
Looking at the Shiller PE ratio for the S&P 500, a long-term observation, the U.S. stock market is still grossly overvalued.
The S&P 500 was the second-highest most expensive valuation in 140 years, and even after the decline this year, the stock index is still twice the valuation of Black Monday in October 1987 and
only down to its extremely overvalued level it was on Black Monday Oct. 19, 1987, when the Dow Jones Industrial Average fell -22% in a single day and just now down to the valuation level the stock index was on Black Tuesday in the 1929 crash.
If you believe in fundamental valuation as a gauge and a guide, anything can happen, so please govern yourself accordingly.
If you need help or have questions, contact us here.
Mike Shell is the Founder and Chief Investment Officer of Shell Capital Management, LLC, and the portfolio manager of ASYMMETRY® Managed Portfolios. Mike Shell and Shell Capital Management, LLC is a registered investment advisor focused on asymmetric risk-reward and absolute return strategies and provides investment advice and portfolio management only to clients with a signed and executed investment management agreement. The observations shared on this website are for general information only and should not be construed as investment advice to buy or sell any security. This information does not suggest in any way that any graph, chart, or formula offered can solely guide an investor as to which securities to buy or sell, or when to buy or sell them. Securities reflected are not intended to represent any client holdings or recommendations made by the firm. In the event any past specific recommendations are referred to inadvertently, a list of all recommendations made by the company within at least the prior one-year period may be furnished upon request. It should not be assumed that recommendations made in the future will be profitable or will equal the performance of the securities on the list. Any opinions expressed may change as subsequent conditions change. Please do not make any investment decisions based on such information, as it is not advice and is subject to change without notice. Investing involves risk, including the potential loss of principal an investor must be willing to bear. Past performance is no guarantee of future results. All information and data are deemed reliable but are not guaranteed and should be independently verified. The presence of this website on the Internet shall in no direct or indirect way raise an implication that Shell Capital Management, LLC is offering to sell or soliciting to sell advisory services to residents of any state in which the firm is not registered as an investment advisor. The views and opinions expressed in ASYMMETRY® Observations are those of the authors and do not necessarily reflect the position of Shell Capital Management, LLC. The use of this website is subject to its terms and conditions.

You must be logged in to post a comment.