
Sometimes the stock market is trending so strongly that the rising tide lifts all boats. No matter what stocks or stock fund you invest in, it goes up. That was the case much of 2017.
Then, there are periods when we see more divergence.
When we observe more divergence, it means stocks, sectors, size, or style has become uncorrelated and are trending apart from each other.
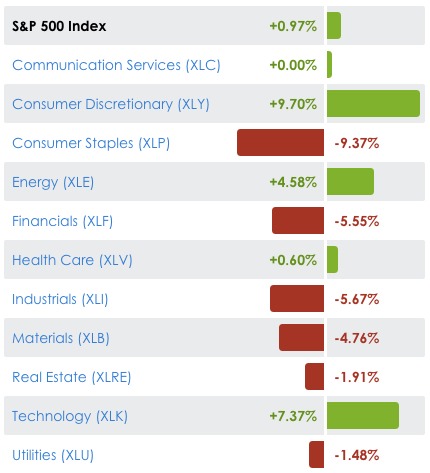
I pointed out in Sector Trends are Driving Equity Returns; there is a notable divergence in sector performance, and that is driving divergence in size and style. Growth stocks have been outperformance value, and it’s driven by strong momentum in Technology and Consumer Discretionary sectors.
When specific sectors are showing stronger relative momentum, we can either focus more on those sectors rather than broad stock index exposure. Or, we can look inside the industry to find the leading individual stocks.
For example, Consumer Discretionary includes industries like automobiles and components, consumer durables, apparel, hotels, restaurants, leisure, media, and retailing are primarily represented in this group. The Index includes Amazon, Home Depot, Walt Disney, and Comcast. Consumer Discretionary is the momentum leader having trended up 9.7% so far this year as the S&P 500 has only gained just under 1%.
If we take a look inside the sector, we see the leaders are diverging farther away from the sector ETF and far beyond the stock market index.
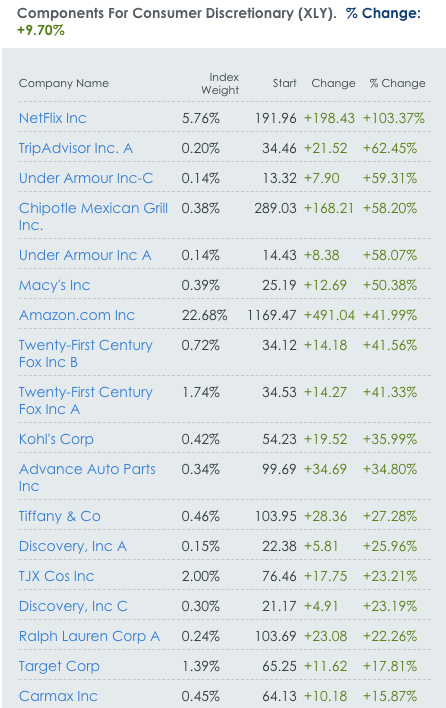
In fact, all the sectors 80 stock holdings are positive in 2018.
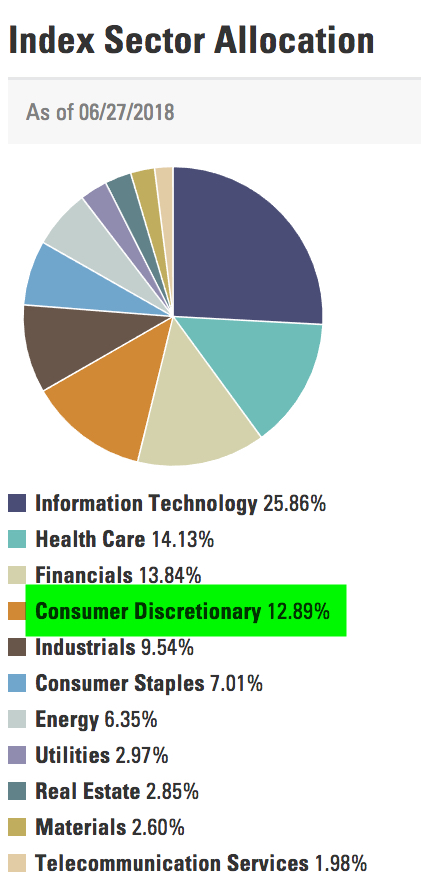
The Consumer Discretionary sector is about 13% of the S&P 500. As you can see, if these top four or five sectors in the S&P 500 aren’t trending up it is a drag on the broad stock index.
So, Is it a stock pickers market?
When we see more divergence, it seems to be a better market for “stock pickers” to separate the winners from the losers.
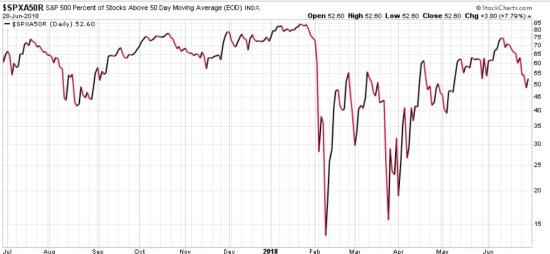
Another way to measure participation in the market is through quantitative breadth indicators. Breadth indicators are a measure of trend direction “participation” of the stocks. For example, the percent of the S&P 500 stocks above or below a moving average is an indication of the momentum of participation.
Below is the percent of stocks above their 50 day moving average tells us how many stocks are trending above their moving average (an uptrend). Right now, the participation is symmetrical; 52% of the stocks in the S&P 500 are in a positive trend as defined by the 50 day moving average. We can also see where that level stands relative to the stock market lows in February and April and the all-time high in January when over 85% of stocks were in an uptrend. By this measure, only half are trending up on a shorter term basis.
The 200-day moving average looks back nearly a year to define the direction of a trend, so it takes a greater move in momentum to get the price above or below it. At this point, the participation is symmetrical; 55% of stocks are above their 200-day moving average and by this time frame, it hasn’t recovered as well from the lows. The percent of stocks above their 200-day moving average is materially below the 85% of stocks that were participating in the uptrend last year. That is, 30% fewer stocks are in longer trend uptrends.
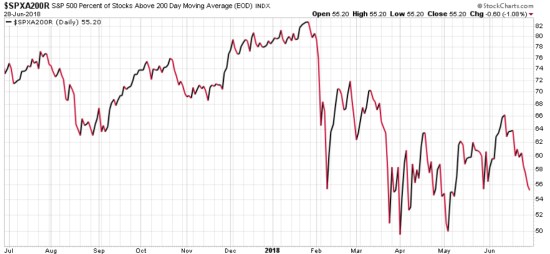
In the above charts, I only showed a one-year look back of the trend. Next, we’ll take a step back to view the current level relative to the past three years.
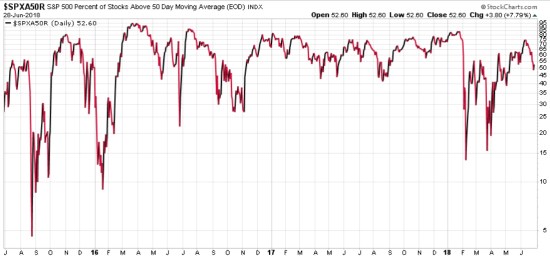
The percent of stocks above their 50 day moving average is still at the upper range of the past three years. The significant stock market declines in August-September 2015 and December-January hammered the stocks down to a very washed out point. During those market declines, the participation was very asymmetric: 90% of the stocks were in downtrends and only about 10% remained in shorter-term uptrends.
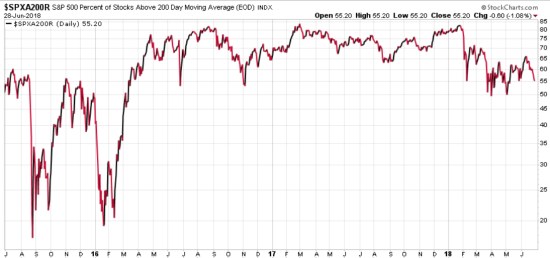
The percent of stocks above their 200 day moving average also shows a much more asymmetrical situation during the declines in 2015 and 2016 when the stock index dropped around -15% or more. Only 20% of stocks remained in a positive trend.
Is it a stock pickers market?
Only about half of the stocks in the index are in uptrends, so the other half isn’t. So, if we avoid the half that are in downtrends and only maintains exposure to stocks in uptrends and the trends continue, we can create alpha.
But, keep in mind, that doesn’t necessarily mean we should have any exposure at all in the S&P 500 stock index because happens to have the highest sector exposure in the leading sectors.
But, for those who want to engage in “stock picking”, the timing has a higher probability now to diverge from the stock index than last year because so fewer stocks are in uptrends and more are in downtrends.
For individual stocks traders willing to look inside the box, this is a good thing.
Mike Shell is the Founder and Chief Investment Officer of Shell Capital Management, LLC, and the portfolio manager of ASYMMETRY® Global Tactical.
You can follow ASYMMETRY® Observations by click on on “Get Updates by Email” on the top right or follow us on Twitter.
The observations shared in this material are for general information only and are not intended to provide specific advice or recommendations for any individual. Investing involves risk including the potential loss of principal an investor must be willing to bear. Past performance is no guarantee of future results.

Pingback: The week in review « ASYMMETRY® Observations