
In late 2017, implied volatility, as measured by the VIX CBOE Volatility Index, was at abnormally low levels. I pointed out many times that vol is mean reverting, so when expected volatility is extremely low we can expect it to eventually reverse. The VIX spiked up over 200% in February and has remained more elevated than before.
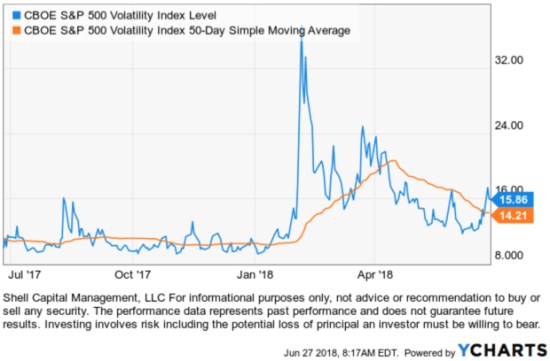
In the chart, I used a 50-day moving average for observation of how the VIX has remained more elevated than pre-February.
Volatility is asymmetric; when the stock market falls, implied volatility tends to spike up.
The VIX long-term average is 20, so the current level of 15-16 still isn’t high by historical measures, but the expected volatility is elevated above where it was.
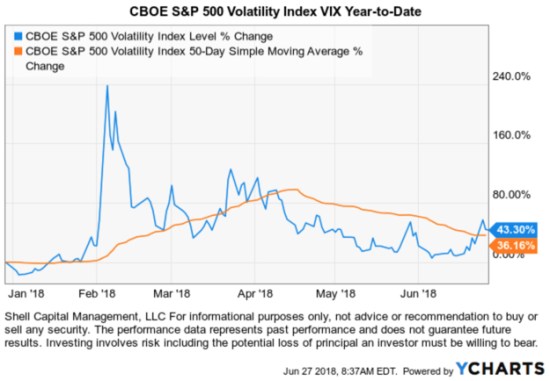
Below is the VIX so far in 2018 in percentage terms. It shows the 200% gain that has since settled down, but it’s remaining higher than before.
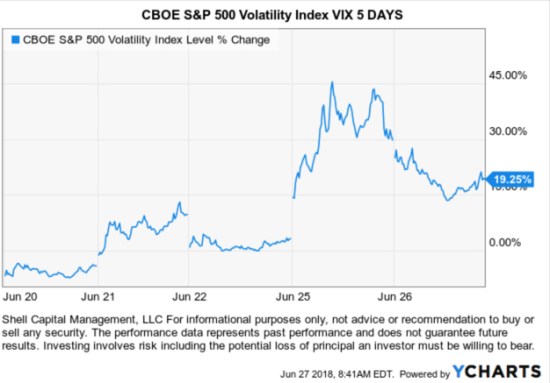
The VIX has spiked up 45% the past 5 days.
As I shared in The enthusiasm to sell overwhelmed the desire to buy March 19, 2018, I expect to see more swings (volatility) than last year, and that would be “normal” too. I said:
I define this as a non-trending market. When I factor in how the range of price movement has spread out more than double what it was, I call it a non-trending volatile condition.
Until we see either a new all-time high indicating a continuing longer-term uptrend or a new low below the February and April low indicating a new downtrend, the above holds true.
It’s a good time for a VIX primer from the CBOE:
What does it mean?
Some consider the VIX the “fear gauge”. When there is a demand for options, their premiums rise. Investor demand for options typically increases when they are concerned about the future, so they use options to hedge or replace their stocks with limited risk options strategies. Rising volatility also drives the VIX, since the VIX Index is a calculation designed to produce a measure of constant, 30-day expected volatility of the U.S. stock market, derived from real-time, mid-quote prices of S&P 500® Index
What is volatility?
Volatility measures the frequency and magnitude of price movements, both up and down, that a financial instrument experiences over a certain period of time. The more dramatic the price swings in that instrument, the higher the level of volatility. Volatility can be measured using actual historical price changes (realized volatility) or it can be a measure of expected future volatility that is implied by option prices. The VIX Index is a measure of expected future volatility.
What is the VIX Index?
Cboe Global Markets revolutionized investing with the creation of the Cboe Volatility Index® (VIX® Index), the first benchmark index to measure the market’s expectation of future volatility. The VIX Index is based on options of the S&P 500® Index, considered the leading indicator of the broad U.S. stock market. The VIX Index is recognized as the world’s premier gauge of U.S. equity market volatility.
How is the VIX Index calculated?
The VIX Index estimates expected volatility by aggregating the weighted prices of S&P 500 Index (SPXSM) puts and calls over a wide range of strike prices. Specifically, the prices used to calculate VIX Index values are midpoints of real-time SPX option bid/ask price quotations.
How is the VIX Index used?
The VIX Index is used as a barometer for market uncertainty, providing market participants and observers with a measure of constant, 30-day expected volatility of the broad U.S. stock market. The VIX Index is not directly tradable, but the VIX methodology provides a script for replicating volatility exposure with a portfolio of SPX options, a key innovation that led to the creation of tradable VIX futures and options.
To learn more about the CBOE, Volatility Index VIX visit their VIX website.
Mike Shell is the Founder and Chief Investment Officer of Shell Capital Management, LLC, and the portfolio manager of ASYMMETRY® Global Tactical.
You can follow ASYMMETRY® Observations by click on on “Get Updates by Email” on the top right or follow us on Twitter.
The observations shared in this material are for general information only and are not intended to provide specific advice or recommendations for any individual. Investing involves risk including the potential loss of principal an investor must be willing to bear. Past performance is no guarantee of future results.

Pingback: The week in review « ASYMMETRY® Observations