
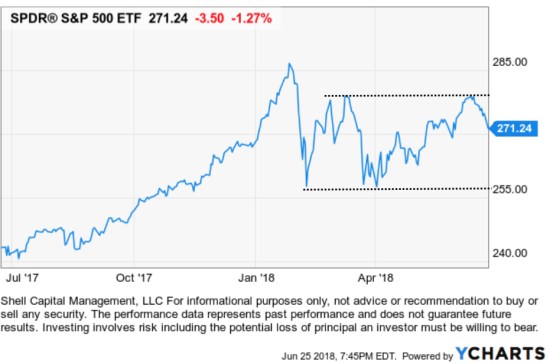
After today’s -1.27% decline, the S&P 500 stock index is only positive about 1.6% for the year.
As we see in the one-year price trend chart below, it continues to be range bound so far in 2018.
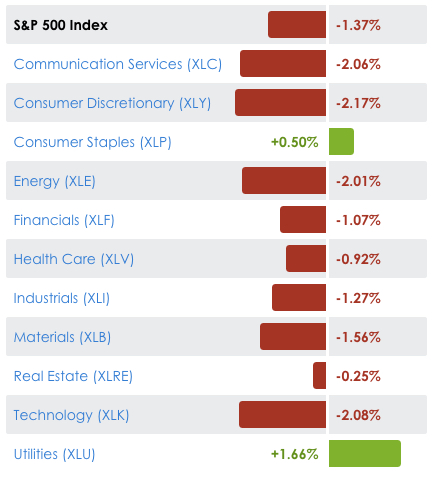
Fortunately, as I pointed out in Sector Trends are Driving Equity Returns, growth stocks in the Information Technology and Consumer Discretionary sectors have been stronger.
However, sometimes what goes up the most may come down the most, and that was the case today. The leading Growth sectors declined the most. It was Interesting to see such a substantial gain in Utilities and Consumer Staples today, defensive sectors during a recession or economic downturn.
At this point, the stock market indexes seem to be having another relatively normal decline within an overall non-trending, more volatile trend so far in 2018.
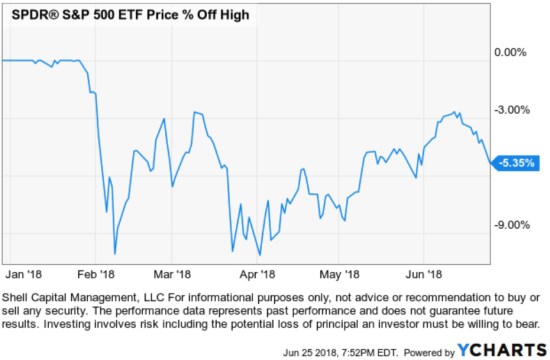
The stock index is over -5% off its January high and remains in a drawdown the past five months.
As I shared in The enthusiasm to sell overwhelmed the desire to buy March 19, 2018, I expect to see more swings (volatility) than last year, and that would be “normal” too. I said:
I define this as a non-trending market. When I factor in how the range of price movement has spread out more than double what it was, I call it a non-trending volatile condition.
Until we see either a new all-time high indicating a continuing longer-term uptrend or a new low below the February and April low indicating a new downtrend, the above holds true.
With that said, this bull market in stocks is now over nine years old. It’s the second longest bull market on record. It’s the second most expensive stock market in history. Everything is impermanent. Nothing lasts forever.
It is essential to have active risk management in place to manage, direct, and control drawdowns to avoid substantial losses that can take many years to recover. Don’t wait until after the fact to make necessary changes.
Mike Shell is the Founder and Chief Investment Officer of Shell Capital Management, LLC, and the portfolio manager of ASYMMETRY® Global Tactical.
You can follow ASYMMETRY® Observations by click on on “Get Updates by Email” on the top right or follow us on Twitter.
The observations shared in this material are for general information only and are not intended to provide specific advice or recommendations for any individual. Investing involves risk including the potential loss of principal an investor must be willing to bear. Past performance is no guarantee of future results.

Pingback: The week in review « ASYMMETRY® Observations