The S&P 500 stock index closed just -1% from its all-time high it reached on January 26, 2018, and hasn’t been that high since. It’s been in a drawdown that was as much as -10% and it has taken six months to get back near its high point to break even.
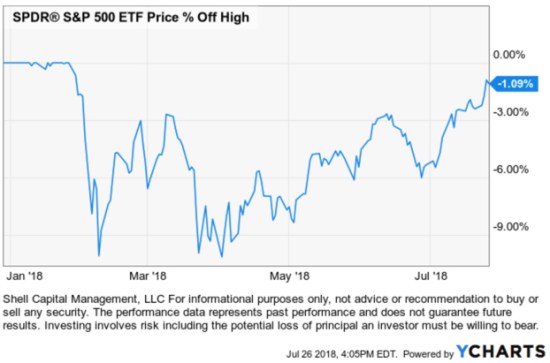
Before the madness begins saying “The S&P 500 is at resistance,” I want to point out an observation of the truth. It is one thing to draw a trend line on an index to indicate its direction, quite another to speak of “support” and “resistance” at those levels.
Is the S&P 500 at resistance?
Depending on which stock charting service or data provider you use, it may appear the S&P 500 ETF (SPY) closed at its prior high. Many market technicians would draw a line like I did below in green and say “the S&P 500 is at resistance.”
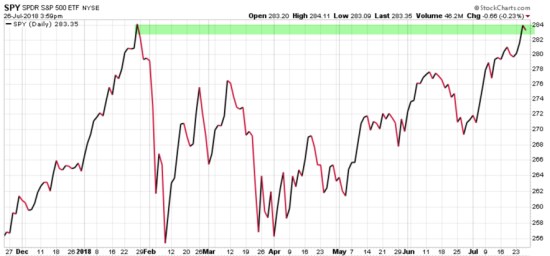
In technical analysis applied to stock market trends, support and resistance is a concept that the movement of the price of a security will tend to stop and reverse at certain predetermined price levels.
Support is when a price trends down and stalls at a prior low. The reasoning is that investors and traders who didn’t buy the low before (or wish they’d bought more) may have buying interest at that prior low price if it reaches it again.
Resistance is when a price trends up and stalls at a prior high. The reasoning is that investors and traders who didn’t sell the high before (or wish they’d sold short to profit from a price decline) may have the desire to sell at that prior high price if it reaches it again.
Whether everyone trades this way or not, enough may that it becomes a self-fulling prophecy. I believe it works this way on stocks and other securities or markets driven by supply and demand, but an index of stocks?
To assume a market or stock will have support or resistance at some price level (or a derivative of price like a moving average) that hasn’t been reached yet is just a predictive assumption. Support and resistance don’t exist unless it is, which is only known after the fact.
One of the most fascinating logical inconsistencies I see by some technical analysts is the assumption that “support” from buying interest and “resistance” from selling pressure “is” there, already exists, before a price is even reached. Like “SPY will have resistance at $292.” We simply don’t know until the price does indeed reverse after that point is reached.
But, it gets worse.
To believe an index of 500 stocks is hindered by selling pressure at a certain price requires one to believe the price trend is controlled by the index instead of the 500 stocks in it.
Think about that for a moment. Let it sink in.
- Do you believe trading the stock index drives the 500 stocks inside the index?
or
- Do you believe the 500 stocks in the index drive the price of the index?
What you believe is true for you. But, to believe an index of 500 stocks is hindered by selling pressure or buying interest at a certain price requires you believe the price trend is controlled by the index instead of the 500 stocks in it. That’s a significant belief.
To complicate it more. If we want to know the truth, we have to look a little closer.
Is the S&P 500 at resistance?
As I said, it depends on which stock charting service or data provider we use and how we calculate the data to draw the chart. Recall in the prior chart, I used the SPDRs S&P 500 ETF (SPY) which shows the ETF closed near its prior high. I used Stockcharts.com as the data provider to draw the chart. I’ve been a subscriber of their charting program for 14 years so I can tell you the chart is based on Total Return as the default. That means it includes dividends. But, when we draw the same chart using the S&P 500 index ($SPX) it’s based on the price trend. Below is what a difference that makes. The index isn’t yet at the prior high, the SPY ETF is because the charting service includes dividends.
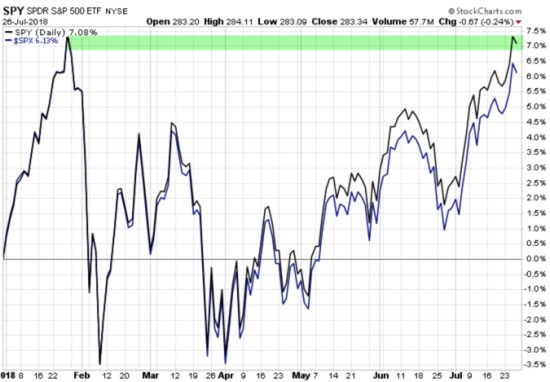
Here is another charting service where I’m showing the S&P 500 ETF (SPY) price return, total return, and the S&P 500 stock index. Only one is at the January high.

So, we don’t know if the S&P 500 is at resistance and we won’t know if there exists any “resistance” there at all unless the price does pause and reverse down. It so happens, it just may pause and reverse at this point. Not because more tactical traders are looking at the total return chart of SPY or because the index or ETF drives the 500 stocks in it, but because momentum measures indicate its potentially reaching an “overbought” level. So, a pause or reversal, at least some, temporarily, would be reasonable.
Some may call this charting, others call it technical analysis, statistical analysis, or quantitative analysis. We could even say there is some behavioral finance included since it involves investor behavior and biases like anchoring. Whatever we choose to call it, it’s a visual representation of supply and demand and like most things, it’s based on what we believe to be true.
I’ve been applying charting, pattern recognition, technical analysis, statistical analysis, and quantitative analysis for over twenty years. Before I started developing computerized programs based on quantitative trend systems that apply evidence-based scientific methods, I was able to trade successfully using visual charts. I believe all of it has its usefulness. I’m neither anti-quant or anti-charting. I use both, but for different reasons. I can argue for and against both because neither is perfect. But, combining the skills together has made all the difference for me.
Is the S&P 500 at resistance?
We’ll see…
Mike Shell is the Founder and Chief Investment Officer of Shell Capital Management, LLC, and the portfolio manager of ASYMMETRY® Global Tactical.
You can follow ASYMMETRY® Observations by click on on “Get Updates by Email” on the top right or follow us on Twitter.
The observations shared in this material are for general information only and are not intended to provide specific advice or recommendations for any individual. Investing involves risk including the potential loss of principal an investor must be willing to bear. Past performance is no guarantee of future results.

Pingback: The week in review shows some shifts « ASYMMETRY® Observations