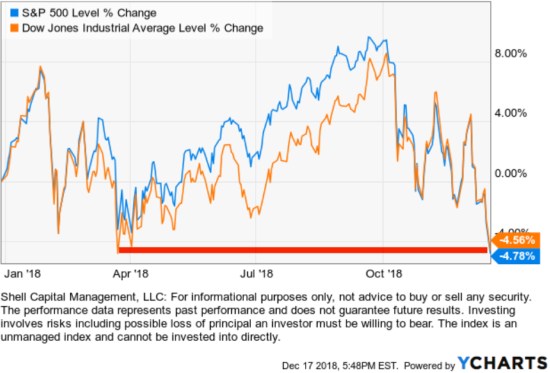
The popular stock indexes are now down about -5% year to date.
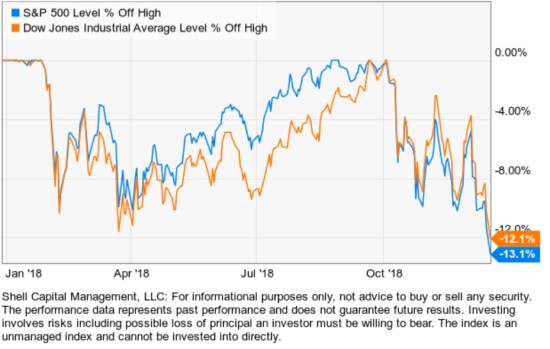
The popular stock indexes are now about -13% off their highs.
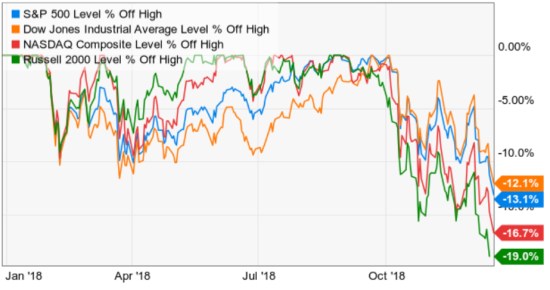
I don’t normally include the NASDAQ since it’s so overweight the Technology sector, but it’s down -17% off its high and the Russell 2000 small-cap index is down -19%. The year started off very strong and is ending with weakness so far.
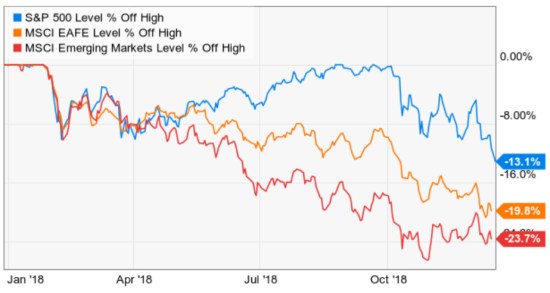
I pointed out earlier this year that Emerging Markets and Developed countries stock markets were already in a bear market if we define it as -20% off highs. Here we see they are down even more than the U.S. stocks year to date.
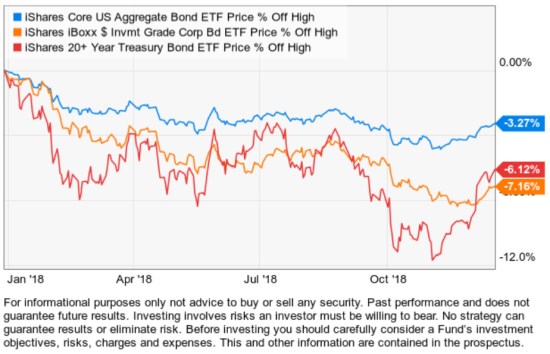
I warned before that with interest rates rising, bonds may not provide the crutch they have in past stock market declines. That has been the case in 2018. Even with the long-term Treasury gaining recently from being down -12%, it’s still down -6% year to date.
Many investors are probably wondering what’s going to happen next. I said a week ago in Stock Market Observations that stocks have fallen far enough that “We would expect to see some potential buying support at these levels again.” For these popular stock indexes, they are now at the point of the February and April lows and reaching an oversold level by my momentum measures.
We are looking for signs that selling pressure is drying up as those who want to sell have been exhausted and new buying demand increases to take over. Some signs of stock prices reaching a low enough point to attract more buying than selling are observed in investor sentiment measures and breadth indicators.
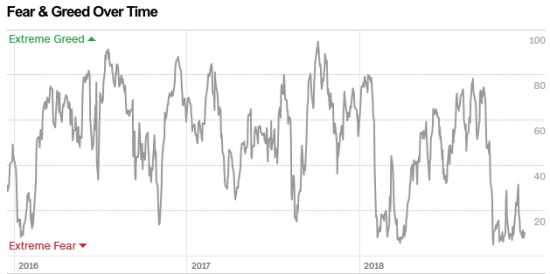
A simple easy to follow gauge of investor sentiment is the Fear & Greed Index, which is a composite of seven Investor sentiment measures. The investor sentiment reached an “Extreme Fear” zone again.
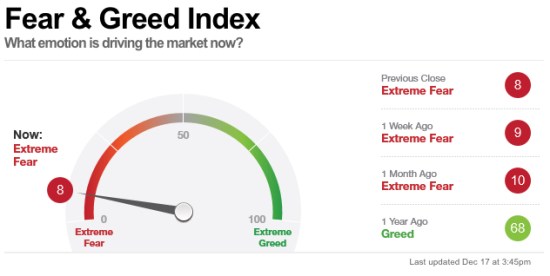
Investor fear by this measure has been high for the past few months. At some point, we would expect to see those who want to sell have sold. However, if this stock trend becomes a bear market we would expect to see this gauge remain low for a long time. Although, the stock indexes will swing up and down along the way.
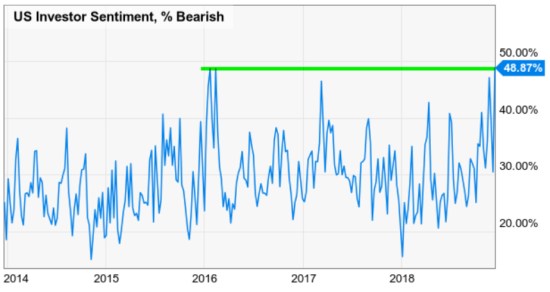
Another observation of investor sentiment reaching an extreme was last week’s AAII Investor Sentiment Survey. Last week pessimism spiked to its highest level since April 2013, while optimism fell to an unusually low level.
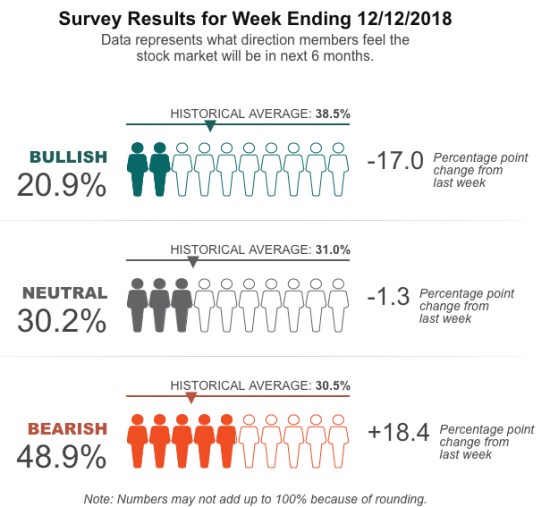
For some historical context, the % of bearish investors has reached the high level it did at the 2016 stock market low. When investor fear reaches such extremes, it’s a contrary indicator.
A bear market is a process, not an event. At -13% it’s hard to say if this will become a bear market, though there are some potential drivers that could cause stocks to fall more over time.
The first warning sign for the big picture is earlier this year the Shiller PE ratio for the S&P 500 reached the second highest level ever, with data going back before 1880.
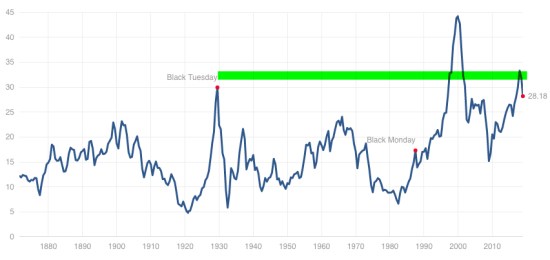
The only two times the Shiller PE ratio for the S&P 500 had reached this “overvalued” level was 1929 and 1999. Of course, 1929 was followed by The Great Depression and 1999 was followed by the Tech Bubble Burst. The only time I pay attention to the PE ratio is for a big picture assessment of valuation when it reaches extreme highs or lows. At such a high level of valuation, we shouldn’t be surprised to see volatility and stocks decline. The unknown is if it keeps declining much more to reach an “undervalued” level at some point. So far, with -13% decline, the Shiller PE ratio for the S&P 500 has declined from 33 at the beginning of the year to 28 now. Twenty or higher is considered high, 10 or less is considered low. It is what it is.
A bear market is a process, not an event, which means the stock market will swing up and down along the way. For example, historical bear markets are made up of swings of -10%, +8%, -14%, +10%, each swing doesn’t make a higher high, but instead prints a lower high and lower lows. The good news is, the swings are potentially tradable. However, for those tactical traders who attempt to trade them, it isn’t easy and it doesn’t always feel good. These kind of periods are volatile, so a skilled tactical trader has to increase and decrease exposure to the possibility of gain and loss. For me, predefining risk is essential, but so is holding the predetermined exposure to give a trend room to play out.
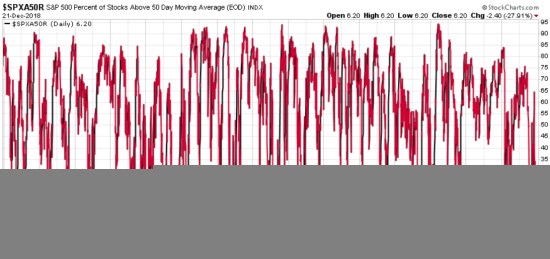
Some potentially positive news is the breadth indicators suggest most stocks are participating in the downtrend. That doesn’t sound positive unless you realize as stocks get washed out on the downside the selling pressure is eventually exhausted, at least temporarily. Below is one indicator we observe to see what is going on inside S&P 500 stock index. It’s the percent of the 500 stocks in the index that are trending above their 50-day moving average. When this indicator is low, it signals stocks may be nearing a level of selling exhaustion as most of them are already in downtrends. However, if this does become an actual bear market of -20% or more, we’ll see this indicator swing up and down along with the price trend. At this point, it’s in the green zone, suggesting the stocks may be near the “washed out” area so we could see some demand take over supply in the days or weeks ahead.
As you can see below, the percent of stocks above their 50 day moving average has now reached the low level it did in February and back in August 2015 and January 2016 that preceded a reversal back up.
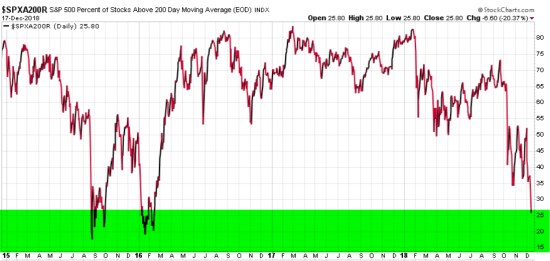
I shared my observations of this breadth indicator back in February when I explained it in more detail if you want to read it Stock Market Analysis of the S&P 500. I also shared it in October when the current downtrend started. In October, the percent of stocks above their 200 day moving average was still high and hadn’t declined much. That isn’t the case now. As you can see, even this longer term breadth indicator is now entering the green zone. As more stocks have already declined, it becomes more and more likely we’ll see selling exhausted and shift to buying demand as prices reach lower more attractive levels for institutional investors.
As you can see below, the percent of stocks above their 200 day moving average has now reached the low level much below February and now down to the levels reached in August 2015 and January 2016 that preceded a reversal back up in stocks.
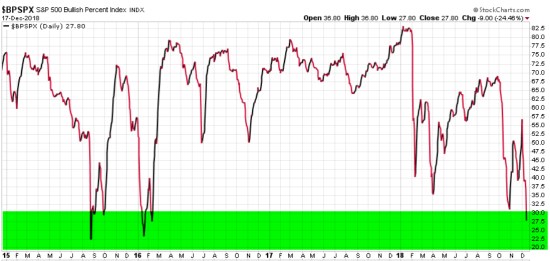
Another indicator that measures the participation in the trend is the S&P 500 Bullish Percent index that I have been observing for over two decades. This is the percent of stocks on a Point & Figure buy signal, which often traces a pattern something similar to the 50 day and 200-day moving averages as it has the past four years. As we see below, this indicator is reaching the low level not seen since August 2015 and January 2016 that preceded a reversal back up.
At this point, we haven’t yet seen enough buying enthusiasm to overwhelm the desire to sell. But, many of these indicators I’ve been monitoring for nearly two decades are reaching a level we should see some shift at some point. If we don’t, the stock market may enter into a more prolonged and deeper bear market. However, historically lower lows are made up of cycle swings along the way, so we should still see at least some shorter-term uptrends.
I’m starting to hear a lot of “bear market” talk in the news and on social media, so I thought I would put the current decline into context. My mission isn’t to take up for the stock market, but instead to present the facts of the trends as they are. I was defensive at the beginning of the year and then added more exposure after prices fell. I predefine my risk by predefining my exits in all of my positions, so any exposure I have has a relatively short leash on how low I’ll allow it to go before I cut my loss short, rather than let the loss get large. I am never a market cheerleader, but because I was already defensive near the peaks, I may have the potential to take advantage of the lower prices. I’m almost always going to be a little too early or a little too late and that is fine. It’s never been perfect but has still achieved the results I want the past two decades.
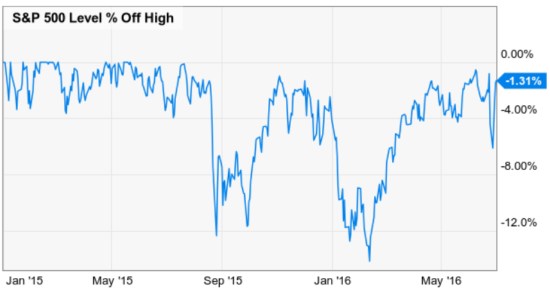
To put the current decline into historical contacts, we can simply compare it to the last decline of -10% or more, which was around August 2015 and January 2016. For nearly two years, the stock index was range bound with no upside breakout.
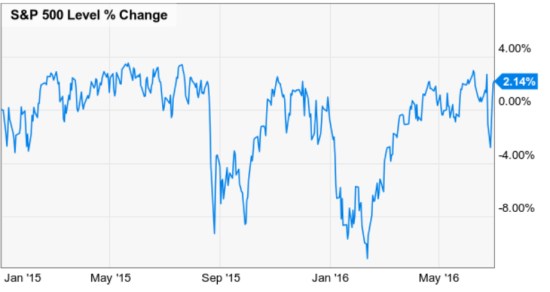
Looking closer at the % off highs, we see the late 2015 decline was -12% and the first few months of 2016 was about -15%.
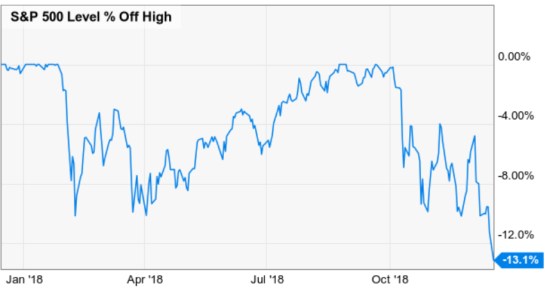
Here is 2018. So far, it isn’t actually as much of a decline.
Another interesting observation I’ll share is the trend in the CBOE S&P 500 Volatility Index (VIX). Below is the 2015 to 2016 period again with the S&P 500 in the top panel and VIX volatility index in the bottom panel. We see the VIX spiked up sharply around August 2015 when the stock market decline. However, when the stock market recovered the loss and then declined again to a lower low, the VIX index didn’t reach the same high level the second time. The volatility expansion wasn’t nearly as high even though the stock index reached an even lower low.
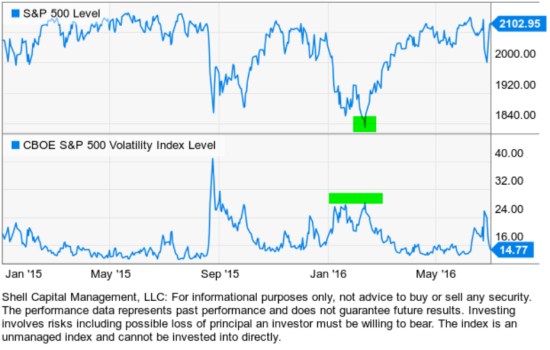
We are observing that same divergence in volatility this year. The VIX spiked over 100% when stocks fell -12% around February this year. The stock market recovered and printed a new high in September, then has since fallen -13% from that high. This time, however, the implied volatility VIX index hasn’t spiked up nearly as high.
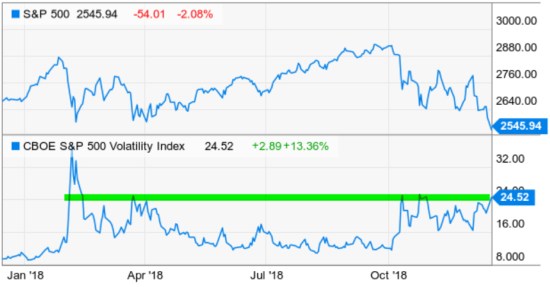
What could it mean? When the VIX increases it is an indication of expected future 30-day volatility implied by the options on the stocks in the S&P 500. When the VIX increases, it means options traders are probably using options to hedge against market declines. I’m guessing it could signal that hedging and possible selling enthusiasm could be drying up. That seems to be what it suggested in 2015 to 2016 when it did the same, then the stock market trended up into 2017.
We’ll see how it all unfolds from here, but the stock market has clearly reached an inflection point. Stocks have trended down to a low enough level we should see some buying demand if it’s there. You can probably see why I believe markets require me to actively manage my risk through predefined exits and hedging to extract from it the asymmetric risk-reward I want.
Mike Shell is the Founder and Chief Investment Officer of Shell Capital Management, LLC, and the portfolio manager of ASYMMETRY® Global Tactical.
The observations shared on this website are for general information only and are not specific advice, research, or buy or sell recommendations for any individual. Investing involves risk including the potential loss of principal an investor must be willing to bear. Past performance is no guarantee of future results. The presence of this website on the Internet shall in no direct or indirect way raise an implication that Shell Capital Management, LLC is offering to sell or soliciting to sell advisory services to residents of any state in which the firm is not registered as an investment advisor. Use of this website is subject to its terms and conditions.

Pingback: To Know Where You’re Going, Look at Where You’ve Been: The 2018 Year in Review « ASYMMETRY® Observations