We’ve observed divergence across global markets since September, so those invested in a static global asset allocation probably notice it the most. I focus my U.S. equity portfolio exposures more granularly into individual stocks and sectors rather than these broad asset classes, but I still monitor them all. I’ll share some recent observations.
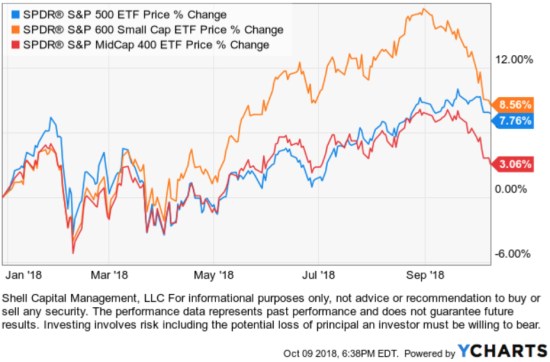
Since the first of September, I observed small cap stocks started to trend down. In the chart below, up until September, we see small cap stocks (orange) had trended up with the best momentum since the drop in February and April. Large and mid-cap stocks trends converged with each other until recently when mid-cap stocks turned down more than the large stocks index. At this point, the small company stock index year to date trend has declined to converge with the popular S&P 500 stock index of mainly large companies.
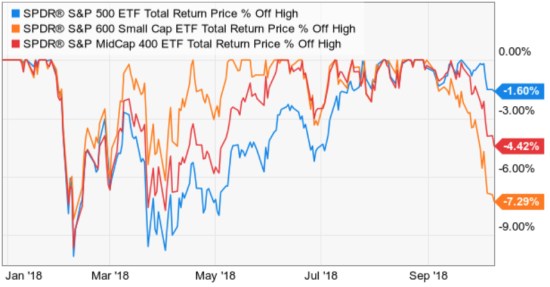
To get a better visual of the recent divergence, I draw a chart of the % off high to see each of their drawdowns. Here we see the S&P 500 has barely declined off its high. The weakness is in mid-cap stocks and even more in small-cap stocks. Investors who have the typical asset allocation portfolio hold some static mix of small, mid, and large. They probably notice unusual strength until September, then those gains faded away.
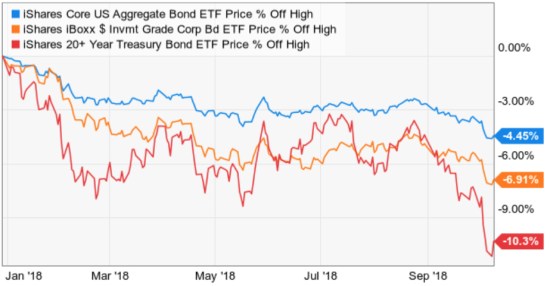
But, the divergence isn’t just in U.S. stocks. In fact, U.S. stocks have been the strongest trends in the world recently. Bonds, for example, have been in a downtrend. Here are three bond index ETFs year to date. The broad U.S. Aggregate Bond index has declined nearly -5%, corporate bonds -7%, and the long-term U. S. Treasury -10% this year alone.
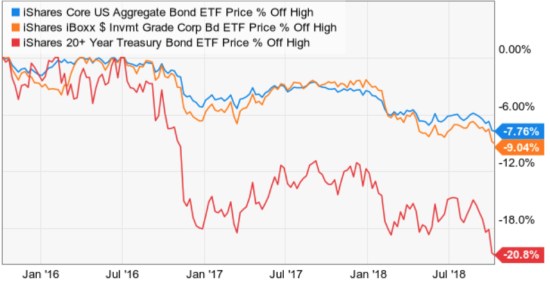
Yes, that is U. S. Treasuries, U.S. government bonds, down over -10% year to date. However, the downtrend in bonds didn’t just start this year. This trend has been going for a while, so here we see the % off high the past three years for a better view of the downside. The long-term U.S. Treasury index is down about -21% from its top three years ago. So, to the extent that static global asset allocation portfolios have a fixed allocation to bonds, you can probably see how they weigh down a portfolio. In fact, to the point of offsetting gains in stocks if their weight is enough.
In May 2015 I warned of this when I shared Allocation to Stocks and Bonds is Unlikely to Give us What We Want and What You Need to Know About Long-Term Bond Trends. I suggested that bonds may not provide a crutch in the next bear market. In fact, in September 2015 I shared that Bonds Aren’t Providing a Crutch for Stock Market Losses.
You can probably see why I prefer to rotate and shift between markets based on trends and tactical decisions rather than a fixed asset allocation to them.
Market trends move in cycles over time. No market price trends up all the time. Even within long-term uptrends, markets cycle up and down along the way with smaller trends within the larger trend. For example, the small-cap divergence at this point is a smaller divergence. Before small stocks declined, they had stronger momentum.
When it comes to bonds or other investments that pay interest or dividend yield, there can be some positive about the price trend falling. As the price trends down, the yield it pays trends up. I discussed this in more detail last spring in When I apply different trend systems to ETFs. But I’ll share an example here.
Since the long-term Treasury is down the most, I’ll use it as an example. First, let’s consider as risk-conscious investors, we should naturally prefer to position our capital in the safest investments possible if we can achieve our return objective with it. In other words, if we can get the capital gains and yield we want from government bonds, we would prefer that over even more risky stocks. All markets and all investments have risks and investors who have held long-term Treasuries (or other bonds) the past few years have certainly experience that even fixed income has risks.
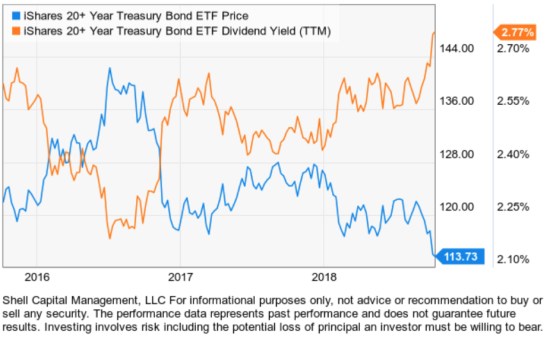
However, for those of who didn’t buy and hold bonds the past few years, their yields are beginning to look more interesting as the price has declined. We can illustrate that very clearly with the chart below showing the declining price trend of the long-term Treasury, but the yield is rising the lower the price falls. Clearly, if we were going to have some exposure to these bonds, we would prefer them now over prior periods because the yield it pays is higher.
So, there is divergence within U.S. stocks and also some divergence within bonds and interest rates. Most investors who have an asset allocation have a global asset allocation, not just U.S. stocks, and bonds. The more “sophisticated” institutional style portfolio like the endowments and pension funds allocate capital to International markets, real estate, and commodities, etc.
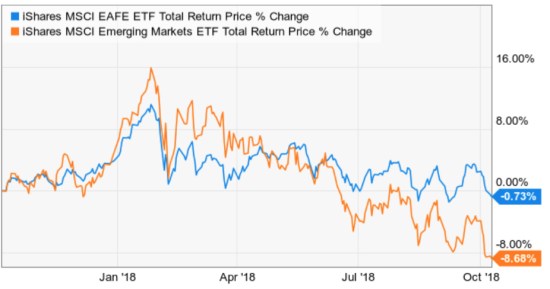
In Emerging Markets Reached a Bear Market Level I shared an observation that the emerging markets index has declined -20%. Below is the total return of the emerging markets and developed international stocks markets.
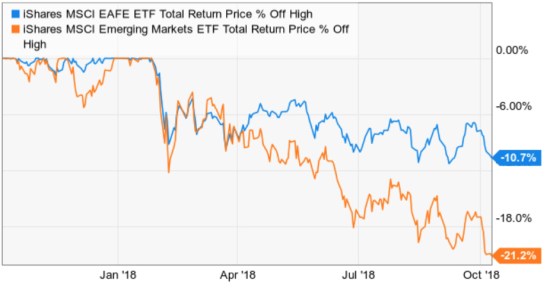
As always, to get the full view of the downside risk we have to observe the drawdown in terms of % off high. Here we see that international developed and emerging markets are still in downtrends. With both of them down between -11% and -21%, you can see how their declines could offset any gains from U.S. stocks in static global asset allocation.
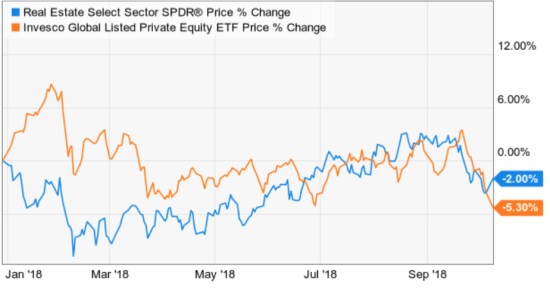
Since our topic is divergence across global markets and we are taking a global macro view for typical global asset allocation, we’ll include real estate (REITs) and private equity. This real estate index ETF seeks to provide precise exposure to companies from real estate management and development and REITs, excluding mortgage REITs. Since private equity, like what some of the pensions and endowments invest in, is actually private companies instead of publically traded company stocks, we’ll use the Global Listed Private Equity index ETF. The Index it tracks includes securities of 40 to 75 private equity companies, including business development companies (BDCs), master limited partnerships (MLPs) and other vehicles whose principal business is to invest in, lend capital to or provide services to privately held companies (collectively, listed private equity companies). Once again, any exposures to these markets aren’t helping global asset allocation in 2018.
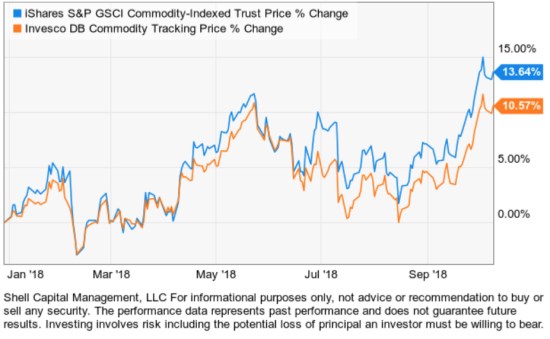
I didn’t want to end on a downtrend, so I saved the commodity indexes for last. For a proxy for commodities, we observe trend price trend of index ETFs like the iShares S&P GSCI Commodity-Indexed Trust. It seeks to track the results of a fully collateralized investment in futures contracts on an index composed of a diversified group of commodities futures. Unlike other markets, the price of “stuff” has trended up lately. Only time will tell if the trend continues, but the rising price of commodities can be considered inflation.
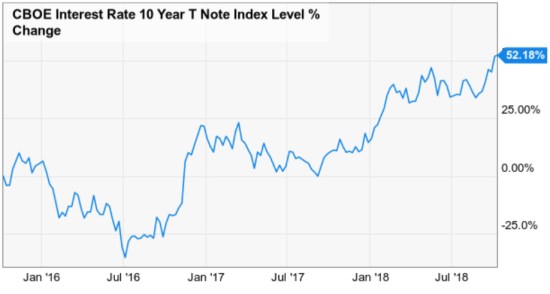
You may be wondering, what is the big global macro driver of most of these trends?
As I shared in the observation in The Trend in Interest Rates and the Impact on the Economy and Stock Market and Rising Interest Rate Impact on Real Estate and Home Construction:
Interest rates are rising for the first time in over a decade.
Some divergence isn’t necessarily a bad thing for those of us who are willing and able to tactically shift between global markets and actively manage risk.
Mike Shell is the Founder and Chief Investment Officer of Shell Capital Management, LLC, and the portfolio manager of ASYMMETRY® Global Tactical.
The observations shared in this material are for general information only and are not intended to provide specific advice or recommendations for any individual. Investing involves risk including the potential loss of principal an investor must be willing to bear. Past performance is no guarantee of future results. The presence of this website on the Internet shall in no direct or indirect way raise an implication that Shell Capital Management, LLC is offering to sell or soliciting to sell advisory services to residents of any state in which the firm is not registered as an investment advisor.

You must be logged in to post a comment.