When Trend Analysis and Options Positioning Collide

This observation was originally published at This is Where Trend Analysis and Options Positioning Gets Interesting

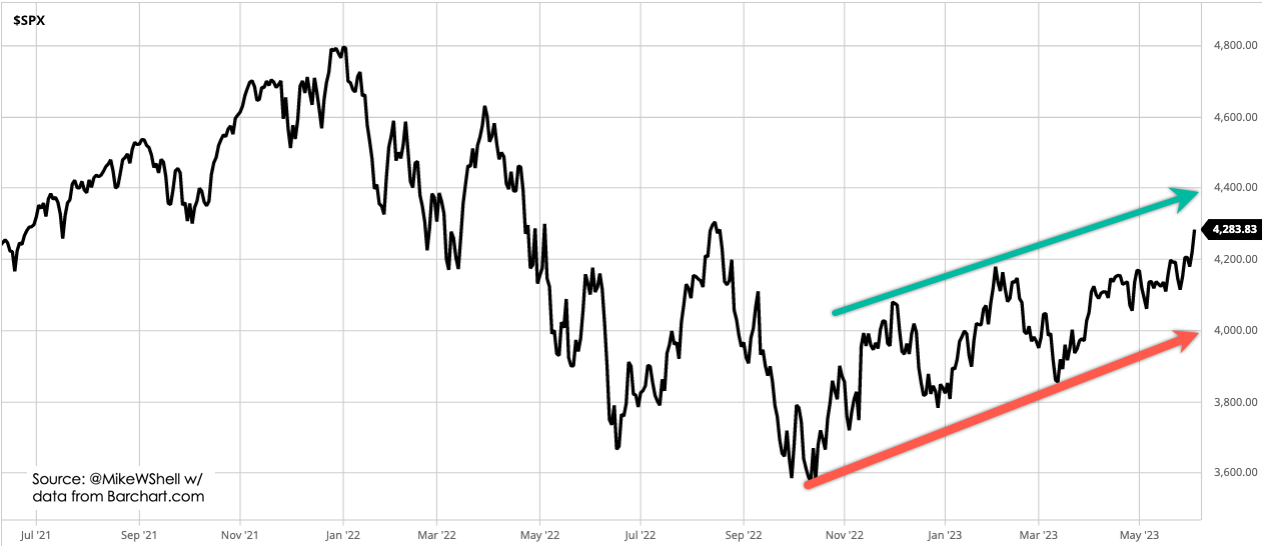
Up until now, the trend S&P 500 index has failed to break above the 4200 level.

I highlighted 4200 in yellow on the chart to point out the SPX has trended around 4200 several times over the last two years, but until this week, these higher levels were met with selling pressure. The selling pressure was enough to provide overhead resistance, selling pressure not allowing the index to move to a higher high.

Such resistance is caused by investors and traders who may have been trapped at lower prices after adding exposure around this level.

Once the index gets back to the level it tapped multiple times, those who wished they’d sold sooner (before the down-trends below 4200) sell to break even.

But that’s just one example of the thinking behind the concept of resistance from selling pressure preventing a new high breakout. 

Another resistance has been a large wall of call options.

A Call Wall is the strike with the largest net call option gamma. Market maker (dealer) positioning can create some of the biggest resistance levels and holds a lot of the time when a Call Wall defines the upper boundary of the probable range.

Below is a recent example. The grey bars are a lot of call options on the SPX. 

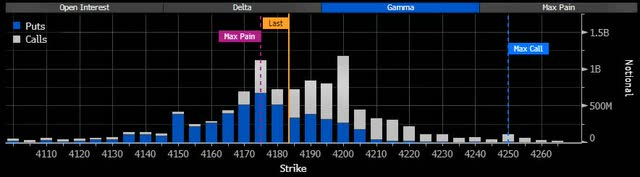
We expect the price to slow down as it reaches the Call Wall level, but it sometimes trends above it, then drifts back below within a few days. So, it takes more than a few days to confirm the wall of calls has increased to a higher level.

No market analysis is ever perfect.

It’s always probabilistic, never a sure thing. 

Call Walls can have a sticky gamma effect, making it difficult for the price to break out. When market makers are long gamma, it accelerates their directional exposure favorably as the size of their positions dynamically increases when they are positioned in the right direction creating an open profit. When these designated market makers have a large profit from being positioned on the correct side of the trend,  they can sell some of the underlying positions (like SPX) to get their directional exposure closer to neutral and realize a profit. That’s why market makers trade in the opposite direction of the underlying (like SPX) when they are positive gamma, and this suppresses volatility and creates a pin. 

So, up until now, the large Call Wall at 4200 was hard to break out of because there are so many calls the dealers were hedging and/or taking profits as the level was reached.

This form of derivatives resistance matched up with the aforementioned technical trend resistance can create a formidable overhead supply of sellers.

The selling pressure has been enough to mute the SPX, for now. 

But, looking at the SPX today, up 1.5% to 4286 as of the time of this writing, the index is pushing up and may be enough to clear out all this overhang. 

What could go wrong? 

There is no shortage of negative macro risks, but that’s beyond the scope of this technical observation. 

Next week, the SPX will see another big test with a large number of calls set to expire

Interestingly, today I noticed a very bullish flow into VIX options betting on a volatility expansion with VIX down to 14.80 for the first time since 2021.

Meanwhile, the VIX term structure is 11% contango between July and June, so ETFs like VXX are rolling from 16.8 to 18.7 (aka selling low, buying high) which is a headwind even if VIX spikes.

So, the stock market index is trending up and trying to print higher highs and higher lows, and implied (expected) volatility is contracting. 

Can the S&P 500 gain enough momentum to keep trending up?

One way to view the directional trend is the price channel the stock index is creating. with higher lows and higher highs.

I see this and wonder if the SPX will reach the 4400 level it’s trending toward. 

To see if it has enough momentum left to move up that far, I look at recent velocity.

Its relative strength suggests it could move up enough to tap the 4300 level before it starts to get overbought, but then it will be overbought.

So, 4400 may be a resistance without a flat base or ~5% correction. 

Only time will tell if the Call Wall, expirations, and long-vol positioning today has more impact or if there’s enough momentum to drive it higher, but we’ll be watching to see how it all unfolds. 

Mike Shell is the founder and Chief Investment Officer of Shell Capital Management, LLC, and the portfolio manager of ASYMMETRY® Managed Portfolios. Mike Shell and Shell Capital Management, LLC is a registered investment advisor focused on asymmetric risk-reward and absolute return strategies and provides investment advice and portfolio management only to clients with a signed and executed investment management agreement. The observations shared on this website are for general information only and should not be construed as investment advice to buy or sell any security. This information does not suggest in any way that any graph, chart, or formula offered can solely guide an investor as to which securities to buy or sell, or when to buy or sell them. Securities reflected are not intended to represent any client holdings or recommendations made by the firm. In the event any past specific recommendations are referred to inadvertently, a list of all recommendations made by the company within at least the prior one-year period may be furnished upon request. It should not be assumed that recommendations made in the future will be profitable or will equal the performance of the securities on the list. Any opinions expressed may change as subsequent conditions change. Please do not make any investment decisions based on such information, as it is not advice and is subject to change without notice. Investing involves risk, including the potential loss of principal an investor must be willing to bear. Past performance is no guarantee of future results. All information and data are deemed reliable but are not guaranteed and should be independently verified. The presence of this website on the Internet shall in no direct or indirect way raise an implication that Shell Capital Management, LLC is offering to sell or soliciting to sell advisory services to residents of any state in which the firm is not registered as an investment advisor. The views and opinions expressed in ASYMMETRY® Observations and Asymmetric Investment Returns are those of the authors and do not necessarily reflect the position of Shell Capital Management, LLC. The use of this website is subject to its terms and conditions.

Systematic Put Protection Hedging Strategies Have Struggled or Failed in this Bear Market

During the waterfall decline in March 2020, the Cboe S&P 500 5% Put Protection IndexSM (PPUT) successfully hedged off stock market beta, but it hasn’t done the same in 2022.

The green highlight shows the Cboe S&P 500 5% Put Protection IndexSM in black and S&P 500 stock index in red. Clearly, the systematic put protection index helped to hedge off downside risk in the SPX during the waterfall decline of March 2020, but that same hedge hasn’t protected long beta portfolios in 2022.

Cboe S&P 500 5% Put Protection IndexSM (PPUT) tracks the value of a hypothetical portfolio of securities (PPUT portfolio) designed to protect an investor from negative S&P 500 returns. The PPUT portfolio is composed of  S&P 500® stocks and of a long position in a one-month 5% out-of-the-money put option on the S&P 500 (SPX put).

Let’s see what happened over these two very different outcomes, and I’ll share my observations of what changed that impacted the outcomes.

Using data from YCharts, we see the full year 2020 in the chart comparing the S&P 500 Total Return Index (SPX) to the Cboe S&P 500 5% Put Protection IndexSM (PPUT) which is long the SPX, but adds one-month 5% out-of-the-money put option on the S&P 500 (SPX puts) options to hedge.

For the systematic put hedge strategy, 2020 was a fine example of risk management resulting in not only drawdown control, but also how avoiding large losses can increase the portfolio return in some conditions.

The S&P 500 declined over -30% around March 2020 as COVID spread, but the 5% SPX put lowered the drawdown to -16.52%.

That’s asymmetry and a key part of creating asymmetric investment returns.

The 5% put hedging strategy limited the downside by 50%, then went on to allow the long-only exposure to the S&P 500 to nearly double the stock index.

This is what I look for in the pursuit of asymmetric payoffs to produce asymmetric returns.

Naturally, the incredible performance of this very simple systematic hedging strategy tracked by PPUT got some attention after it performed so well. But, no method is perfect, and all strategies are fallible.

Fast forward to 2022, and the outcome has been completely different. Investors and traders who relied on a 5% monthly put option have fully participated in the downside of the SPX this year.

This phenomenon has driven many to ask, why such a radically different outcome?

I’ll attempt to explain my observations as succinctly as possible because understanding derivatives like options is the most complex task in the capital markets for most people.

For more than two decades, I’ve focused on alternative trading strategies in pursuit of asymmetric payoffs that lead to asymmetric investment returns.

Asymmetry isn’t just about finding low-risk positions that offer a higher expected payoff, like a 2-to-1 reward to risk.

Instead, asymmetry is even more focused on limiting the downside in hopes to avoid the negative asymmetry of loss.

Losses compound against us exponentially the deeper we allow losses to get.

So, my focus has been actively trading momentum growth stocks, tactically trading more systematically a global universe of ETFs, and volatility trading/hedging, all of which are unconstrained in my primary portfolio.

So, I have a unique perspective on this topic.

The short and sweet answer to why this time was so different than 2020 is a function of these issues.

  1. During the waterfall decline of March 2020, prices spread out (to the downside) very quickly. It was one of the sharpest waterfalls in history. When prices spread out, I call it a volatility expansion, and rising vol increases the premium for options. For the same reason, the VIX spiked to > 80 in March 2020, but it’s been constrained under 40 so far in 2022.
  2. This year, the stock indices have declined over -20%, but it’s been a much slower grind down. SPX is down about -20% over six months instead of down over -30% in three weeks. The speed of prices spreading out is volatility, and volatility is a significant driver of option premiums. Think of it this way: home insurance in Florida is expected to be cheaper before a catastrophic hurricane when people are complacent than after the hurricane does its damage. The good news is, that options pricing allows for better timing of relative value if you have a system for it.
  3. Another difference is the luck of roll and expiration dates for this systematic strategy that executes about every 30 days. My friend Russell Rhoads, who is one of the most well-known VIX experts, pointed out to me that the ability to use a series that expires on days that don’t contribute to the VIX calculation would have been helpful this year. That is, the systematic strategy of buying 30-day SPX put options has the potential to fall on days that aren’t efficient. The roll is a risk.
  4. Finally, we believe most institutional money managers were already hedged. This has been a long drawn-out decline, a lower vol downtrend, so it’s given time for money managers to add protection, so demand for puts hasn’t been a spike, but instead more methodical.

The bottom line is the asymmetric volatility phenomenon has impacted the put option hedging strategy.

The asymmetric volatility phenomenon suggests that prices trend down faster and sharper than they trend up, which can be an advantage of put option hedging, or a disadvantage when it’s calmer like this year.

All of the above has also kept the VIX below 40 this year.

Mike Shell is the Founder and Chief Investment Officer of Shell Capital Management, LLC, and the portfolio manager of ASYMMETRY® Managed PortfoliosMike Shell and Shell Capital Management, LLC is a registered investment advisor focused on asymmetric risk-reward and absolute return strategies and provides investment advice and portfolio management only to clients with a signed and executed investment management agreement. The observations shared on this website are for general information only and should not be construed as investment advice to buy or sell any security. This information does not suggest in any way that any graph, chart, or formula offered can solely guide an investor as to which securities to buy or sell, or when to buy or sell them. Securities reflected are not intended to represent any client holdings or recommendations made by the firm. In the event any past specific recommendations are referred to inadvertently, a list of all recommendations made by the company within at least the prior one-year period may be furnished upon request. It should not be assumed that recommendations made in the future will be profitable or will equal the performance of the securities on the listAny opinions expressed may change as subsequent conditions change. Please do not make any investment decisions based on such information, as it is not advice and is subject to change without notice. Investing involves risk, including the potential loss of principal an investor must be willing to bear. Past performance is no guarantee of future results. All information and data are deemed reliable but are not guaranteed and should be independently verified. The presence of this website on the Internet shall in no direct or indirect way raise an implication that Shell Capital Management, LLC is offering to sell or soliciting to sell advisory services to residents of any state in which the firm is not registered as an investment advisor. The views and opinions expressed in ASYMMETRY® Observations are those of the authors and do not necessarily reflect the position of Shell Capital Management, LLC. The use of this website is subject to its terms and conditions.

Here’s what the equity options put call ratio is telling us, and what it isn’t

I’m hearing a lot of talk about the CBOE Equity Put/Call Ratio tapping an extreme low again. At 0.38, the ratio between equity puts and calls has once again reached its lowest level of the past year.

For a broader perspective, here is the CBOE Equity Put/Call Ratio going back to 2006. Indeed, the current ratio between equity puts and calls is as low as it gets. The lowest level was in 2010, when it reached 0.32, barely lower than the current 0.38 reading. Yes, indeed, the CBOE Equity Put/Call Ratio reaching an extremely low level. In fact, it’s as low as it has ever been going back to 2006.

Normally, we consider such a low level to be an example of extreme complacency and GREED DRIVING THE MARKET. For example, the CBOE Equity Put/Call Ratio is the first of seven indicators used in the Fear & Greed Index.

When the ratio is trending down and at a low level, it’s because equity Call option volume is greater than the equity Put option volume. When there’s more trading volume in equity calls, we assume options traders buying speculative calls, so they are bullish. VERY bullish now.

When the market is so one-sidedly bullish, it’s a contrarian indicator suggesting over-enthusiasm. That is, we assume the calls are mostly speculative positions and puts are defensive, so the demand is on the long side. It’s an imperfect assumption, but I generally agree.

I pointed out a similar extreme read out early June, when Call Volume spiked up to a historically high level. Indeed, the stock market had a -6% down day afterward. This time is a little different, and the chart shows why. Call volume isn’t nearly as high, relatively speaking.

Call volume isn’t as high as it was in June, but put volume is also lower. So, the ratio is at the same low level at 0.38, but the absolute volume is different. It’s still probably an indication of enthusiasm and complacency, but it may not have the delta it had last time.

Keep in mind, even though a call option gives the buyer the right, but not the obligation, to buy a stock at a specified price within a specific time period, call volume also includes sellers of call options. So, the dominant demand could be the selling of call options instead of buying them, but every seller needs a buyer, and the prevailing direction of the trend hints as to the dominant side the market is enthusiastic about.

We can say the same about put option volume. While a put option gives the buyer the right, but not the obligation, to sell a stock at a specified price within a specific time period, put volume also includes sellers of call options. Buying a put option is bearish, but selling a put option is bullish.

Still, the general direction of put/call volume is that equity call volume is assumed to be mostly speculative bets on the stock to rise and put volume is primarily speculative (or hedging) bets on the stock to fall.

So, an observation of put and call volume includes a combination of the options market belief the stocks will trend up, but also less desire to protect against stocks going down.

This time, as seen in the chart, the primary difference in the current Put/Call Ratio is a lower level of put volume, requiring less of an uptrend in call volume to drive the ratio up.

This image has an empty alt attribute; its file name is EdExA_mXsAAINMz.png

I hope this helps!

Don’t miss out. Get an email of new ASYMMETRY® Observations:

Join 39.5K other subscribers

Mike Shell is the Founder and Chief Investment Officer of Shell Capital Management, LLC, and the portfolio manager of ASYMMETRY® Global TacticalMike Shell and Shell Capital Management, LLC is a registered investment advisor focused on asymmetric risk-reward and absolute return strategies and provides investment advice and portfolio management only to clients with a signed and executed investment management agreement. The observations shared on this website are for general information only and should not be construed as advice to buy or sell any security. Securities reflected are not intended to represent any client holdings or any recommendations made by the firm. Any opinions expressed may change as subsequent conditions change.  Do not make any investment decisions based on such information as it is subject to change. Investing involves risk, including the potential loss of principal an investor must be willing to bear. Past performance is no guarantee of future results. All information and data are deemed reliable but is not guaranteed and should be independently verified. The presence of this website on the Internet shall in no direct or indirect way raise an implication that Shell Capital Management, LLC is offering to sell or soliciting to sell advisory services to residents of any state in which the firm is not registered as an investment advisor. The views and opinions expressed in ASYMMETRY® Observations are those of the authors and do not necessarily reflect a position of  Shell Capital Management, LLC. The use of this website is subject to its terms and conditions.