
After a sharp decline in stock prices in February that seemed to shock many investors who had become complacent, the stock market indexes have been trying to recover.
At this point, the popular S&P 500 has gained 1.75% year-to-date and the Dow Jones Industrial Average is down -2.56%. I also included the Total Stock Market ETF, which tracks an index that represents approximately 98% of the investable US equity market. Though it holds over five times more stocks than the 500 in the S&P 500 SPY, it is tracking it closely.
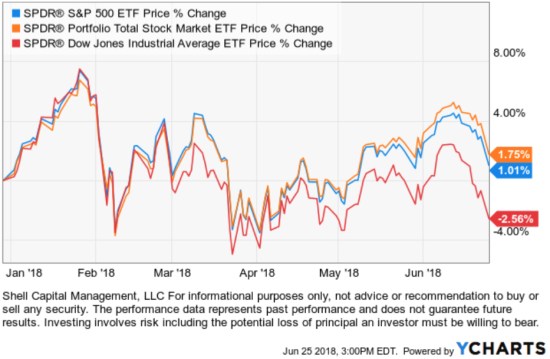
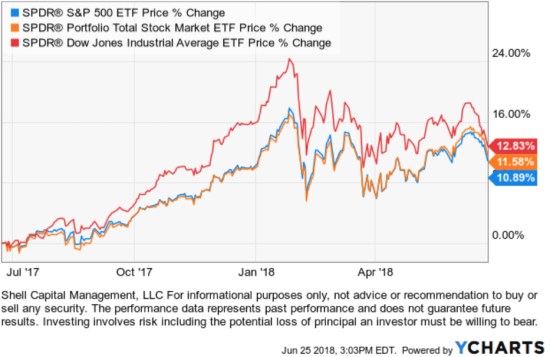
The Dow Jones Industrial Average was the momentum leader last year, but the recent price action has driven it to converge with the other stock indexes. Past performance doesn’t always persist into the future.
What is more interesting, however, is the divergence at the size, style, and sector level.
The research firm Morningstar created the equity “Style Box.” The Morningstar Style Box is a nine-square grid that provides a graphical representation of the “investment style” of stocks and mutual funds. For stocks and stock funds, it classifies securities according to market capitalization (the vertical axis) and growth and value factors (the horizontal axis).
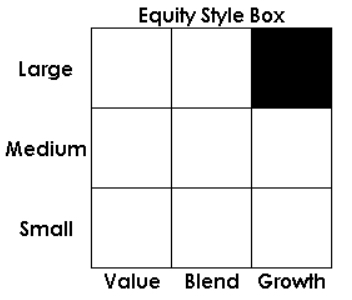
- The vertical axis of the style box graphs market capitalization and is divided into three company-size indicators: large, medium and small.
- The horizontal axis seeks to represent stock funds/indexes by value, growth, and blend which represents a combination of both value and growth.
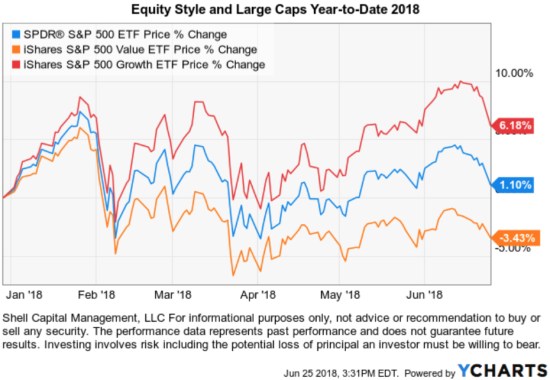
Looking at their distinct trends, we observe a material divergence this year. As we see below, the S&P 500 Growth Index ETF has gained 16.45% % over the past 12 months, which is triple the S&P 500 Value ETF. So, Growth is clearly exhibiting stronger momentum than value over the past year. But, notice that wasn’t the case before the February decline when Growth, Value, and Blend were all tracking close to each other.
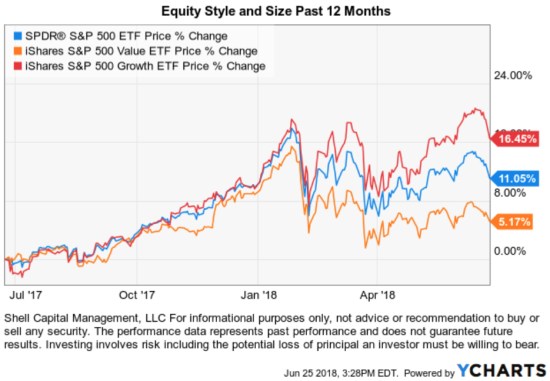
Year to date, the divergence is more clear. Growth is positive, the blended S&P 500 stock index is flat, and Value is negative.
Showing only the price trend change over the period isn’t complete without observing the path it took to get there, so I’ve included the drawdown chart below. Here, we see these indexes declined about -10% to as much as -12% for the Value index.

The Value index declined the most, which requires more of a gain to make up for the decline. The Value ETF hasn’t recovered as well as the others.
To look even closer, we can get more specific into the style and size categories. Below we show the individual Morningstar ETFs that separate the stock market into the Large, Mid, and Small size stocks and then into Growth vs. Value.

All three at the top are Growth. The three at the bottom are Value. So, the divergence this year isn’t so much Large vs. Small cap, it’s Growth vs. Value.
Clearly, Growth stocks are leading the stock market so far in 2018.
Why do we care about such divergence?
When there exists more difference between price trends, it provides more opportunity to capture the positive direction and avoid the negative trend if it continues.
In part 2, we’ll discuss how sector exposure is the primary driver of style/size returns.
Mike Shell is the Founder and Chief Investment Officer of Shell Capital Management, LLC, and the portfolio manager of ASYMMETRY® Global Tactical.
You can follow ASYMMETRY® Observations by click on on “Get Updates by Email” on the top right or follow us on Twitter.
The observations shared in this material are for general information only and are not intended to provide specific advice or recommendations for any individual. Investing involves risk including the potential loss of principal an investor must be willing to bear. Past performance is no guarantee of future results.

Pingback: Sector Trends are Driving Equity Returns « ASYMMETRY® Observations
Pingback: The week in review « ASYMMETRY® Observations
Pingback: 2nd Quarter 2018 Global Investment Markets Review « ASYMMETRY® Observations