Stock Market Resumes Downtrend

The U.S. stock market as measured by the S&P 500 stock index, has trended down from a lower high.

The S&P is not yet oversold, and implied volatility is around 20%, which is the prior lows over the past year.

At the recent high, 60% of the stocks in the index were trending above their 200-day average and about 80% of the stocks were trending above their 50-day average, both of which have now turned down as an increasing number of stocks are trending down.

Trend lines aren’t magic; they’re just a general trend guide.

I’m not seeing heavy selling pressure, so we’ll see.

Mike Shell is the founder and Chief Investment Officer of Shell Capital Management, LLC, and the portfolio manager of ASYMMETRY® Managed Portfolios. Mike Shell and Shell Capital Management, LLC is a registered investment advisor focused on asymmetric risk-reward and absolute return strategies and provides investment advice and portfolio management only to clients with a signed and executed investment management agreement. The observations shared on this website are for general information only and should not be construed as investment advice to buy or sell any security. This information does not suggest in any way that any graph, chart, or formula offered can solely guide an investor as to which securities to buy or sell, or when to buy or sell them. Securities reflected are not intended to represent any client holdings or recommendations made by the firm. In the event any past specific recommendations are referred to inadvertently, a list of all recommendations made by the company within at least the prior one-year period may be furnished upon request. It should not be assumed that recommendations made in the future will be profitable or will equal the performance of the securities on the list. Any opinions expressed may change as subsequent conditions change. Please do not make any investment decisions based on such information, as it is not advice and is subject to change without notice. Investing involves risk, including the potential loss of principal an investor must be willing to bear. Past performance is no guarantee of future results. All information and data are deemed reliable but are not guaranteed and should be independently verified. The presence of this website on the Internet shall in no direct or indirect way raise an implication that Shell Capital Management, LLC is offering to sell or soliciting to sell advisory services to residents of any state in which the firm is not registered as an investment advisor. The views and opinions expressed in ASYMMETRY® Observations are those of the authors and do not necessarily reflect the position of Shell Capital Management, LLC. The use of this website is subject to its terms and conditions.

So far, 2020 has shown us some fine examples of risk, investor sentiment, divergence, and volatility

Implied volatility, as measured by the CBOE Volatility Index (VIX) has trended up about 50% since the most recent low on June 5th. I’ll call it a moderate volatility expansion. Normally a volatility expansion from 23 to 40 would be considered a material event, but relative to the highest spike we’ve seen in March, it doesn’t seem huge for 2020.

The Bank of America Bull & Bear Indicator is at 0.90 vs. 0.40 last week. It is used as contrarian indicator to identify market extremes in investor sentiment. Currently, their measure of investor sentiment is very bearish, which is bullish for the stock market.

BofA Bull & Bear Indicator

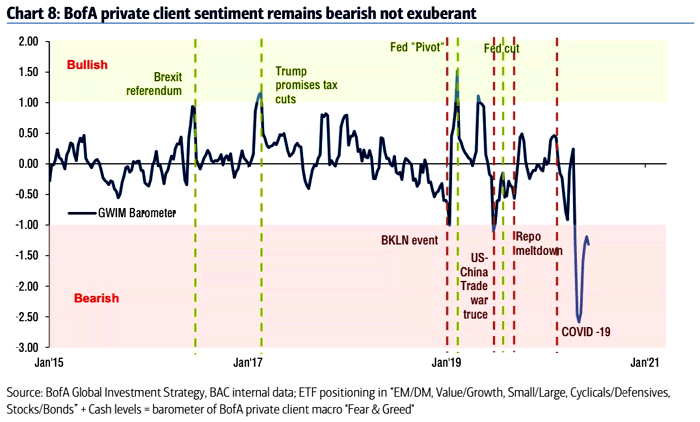
Bank of America Private Client Sentiment shows bearishness, and here is a line chart showing its history.

BofA Private Client Sentiment

On the topic of investor sentiment, and the Bank of America Bull & Bear Indicator, here is a chart of its history going back to 2002. As marked on the chart, it was backtested pre-2013.

BofA Bull & Bear Indicator History

I share the CNN Fear & Greed Index a lot, because it’s easily assessable, so anyone can view it. The Fear & Greed Index is neutral right now.

Within the Fear & Greed Index are seven different investor sentiment indicators. Unlike the Bank of America Private Client Bull & Bear Indicator, which is a survey of their clients, the Fear & Greed Index is derived from quantitative technical indicators.

Stock price breadth, or how well stocks are participating in the uptrend, is the leading driver on the Greed side. They use the McClellan Volume Summation Index, which measures advancing and declining volume on the NYSE. It shows during the last month, approximately 8.08% more of each day’s volume has traded in advancing issues than in declining issues, pushing this indicator towards the upper end of its range for the last two years, which is extremely bullish.

The only other of the seven indicators showing bullish investor sentiment is safe haven demand. That is, the demand for bonds over stocks. They measure it by the difference between the past 20 day stock and bond returns. Stocks have outperformed bonds by 6.99% during the last 20 trading days. This is close to the strongest performance for stocks relative to bonds in the past two years and indicates investors are rotating into stocks from the relative safety of bonds. Of course, this bullish investor sentiment is a sign that greed is driving the market. Notwithstanding these two extremes, overall, the Fear & Greed Index remains neutral.

Value is a Value

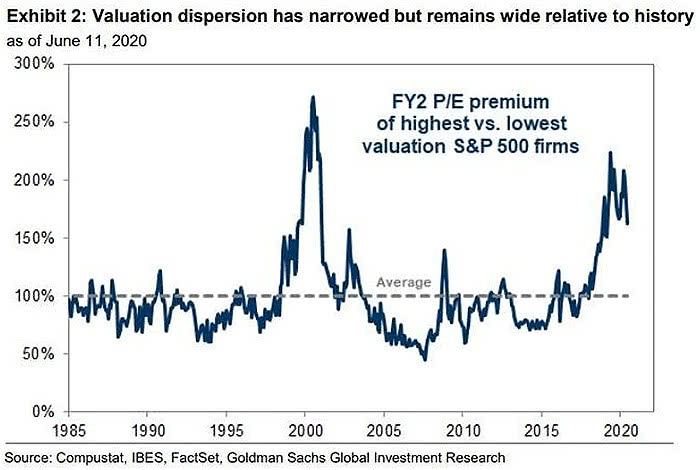
The dispersion of stock valuation multiples between the lowest and highest valuations has narrowed. But, despite the recent relative strength in value, it is still wide relative to history. So, value stocks remain a relative value.

Image

Hot Momentum Stocks are Showing Relative Strength

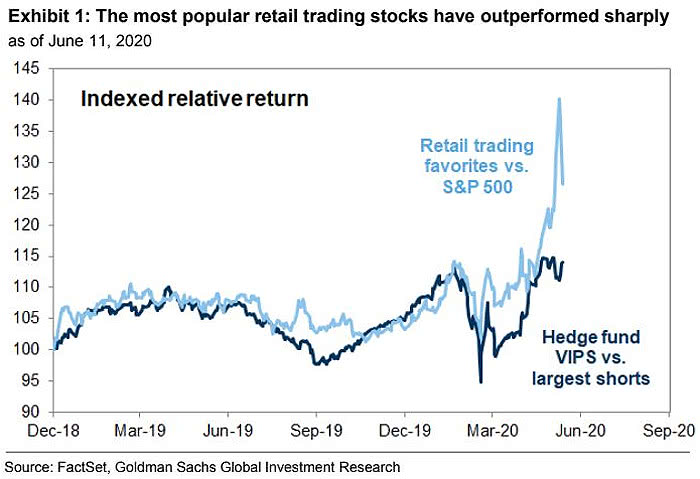
According to Goldman Sachs, the most popular retail trading stocks have materially outperformed the S&P 500, so far.

Image

Cross-Asset Realized Volatility has been Extreme

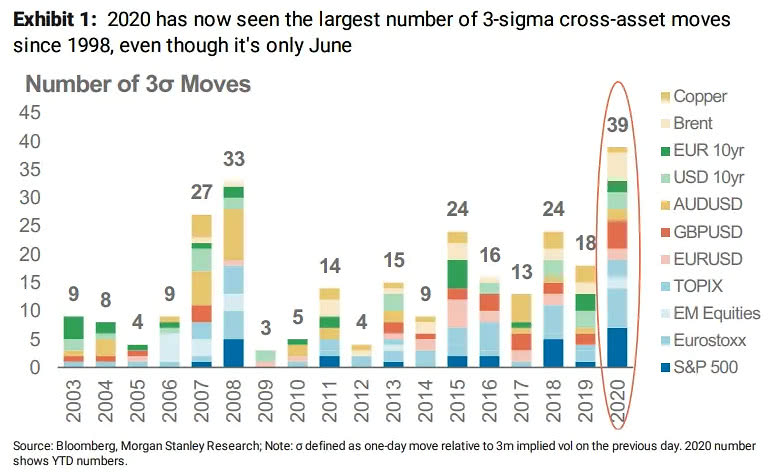
Another sign of dispersion is the number of 3 standard deviation prices moves. We’ve already seen more extreme trends across asset classes in 22 years.

Volatility and Number of 3-Sigma Moves

Despite the impressive V shaped rally from what is so far the low on March 23rd, I continue to notice the mean reversion year to date and over the past year. Here is year to date, and I marked the high, low, and average percentage.

At the low, the S&P 500 was down about -31% YTD. With the help of a very aggressive Federal Reserve proving liquidity, it has recovered most of the decline in one of the fastest in history.

It ain’t over till it’s over, and this ain’t over.

Asymmetry is about the upside vs. the downside in terms of asymmetric risk/reward. No observation of the price trend is complete without also noting the downside drawdown it took to achieve it. The drawdown for the S&P 500 was an astonishing -34% in just 23 days. It’s a reminder of risk.

I believe risk must be measured, directed, and controlled if we are to compound capital positively.

It doesn’t matter how much the return is if the downside risk is so high you tap out before it’s achieved.

Clearly, in 2020, we’ve surely seen some of the finest examples of risk, divergence, and volatility.

Join 39.5K other subscribers

Mike Shell is the Founder and Chief Investment Officer of Shell Capital Management, LLC, and the portfolio manager of ASYMMETRY® Global TacticalMike Shell and Shell Capital Management, LLC is a registered investment advisor focused on asymmetric risk-reward and absolute return strategies and provides investment advice and portfolio management only to clients with a signed and executed investment management agreement. The observations shared on this website are for general information only and should not be construed as advice to buy or sell any security. Securities reflected are not intended to represent any client holdings or any recommendations made by the firm. Any opinions expressed may change as subsequent conditions change.  Do not make any investment decisions based on such information as it is subject to change. Investing involves risk, including the potential loss of principal an investor must be willing to bear. Past performance is no guarantee of future results. All information and data are deemed reliable but is not guaranteed and should be independently verified. The presence of this website on the Internet shall in no direct or indirect way raise an implication that Shell Capital Management, LLC is offering to sell or soliciting to sell advisory services to residents of any state in which the firm is not registered as an investment advisor. The views and opinions expressed in ASYMMETRY® Observations are those of the authors and do not necessarily reflect a position of  Shell Capital Management, LLC. The use of this website is subject to its terms and conditions.

Is the panic selling drying up?

After yesterday’s continued selling pressure, only 7% of the S&P 500 stocks remain in uptrends as measured by the 50-day moving average.

percent of stocks above moving average

As most stocks are participating in the downtrend, this breadth measure is about as low as it was in December 2018.

In case you are wondering, here are some of the few stocks in the index that are still above their trend line. I don’t consider this a buy list and we don’t own any of them directly.

stocks above moving average

Another sign of a strong desire to sell is the new highs-new lows as a percentage. It’s as low as it’s been the past year, as new lows are dominating.

new highs new lows percent

As expected, a chart of advance – declining stocks as a percentage is at the low end of its range and about as low as it can get as declining stocks are dominant.

advance decline percent

When investors are panic selling, prices can always trend lower, but this data shows mathematically prices have reached an extreme level on the downside that now appears to be an overreaction. We should be close to seeing this panic selling dry up as selling becomes exhausted and these lower prices attract buyers. After that, we’ll see if any countertrend back up continues, or eventually reverses back down. As I’ve said recently, given this bull market is very aged and we’ve seen the longest economic expansion in history, I believe the years ahead will require tactical trading and risk management.

I hope this helps!

Mike Shell is the Founder and Chief Investment Officer of Shell Capital Management, LLC, and the portfolio manager of ASYMMETRY® Global TacticalMike Shell and Shell Capital Management, LLC is a registered investment advisor in Florida, Tennessee, and Texas focused on asymmetric risk-reward and absolute return strategies and provides investment advice and portfolio management only to clients with a signed and executed investment management agreement. The observations shared on this website are for general information only and should not be construed as advice to buy or sell any security. Securities reflected are not intended to represent any client holdings or any recommendations made by the firm. I observe the charts and graphs to visually see what is going on with price trends and volatility, it is not intended to be used in making any determination as to when to buy or sell any security, or which security to buy or sell. Instead, these are observations of the data as a visual representation of what is going on with the trend and its volatility for situational awareness. I do not necessarily make any buy or sell decisions based on it. Any opinions expressed may change as subsequent conditions change.  Do not make any investment decisions based on such information as it is subject to change. Investing involves risk, including the potential loss of principal an investor must be willing to bear. Past performance is no guarantee of future results. All information and data are deemed reliable but is not guaranteed and should be independently verified. The presence of this website on the Internet shall in no direct or indirect way raise an implication that Shell Capital Management, LLC is offering to sell or soliciting to sell advisory services to residents of any state in which the firm is not registered as an investment advisor. The views and opinions expressed in ASYMMETRY® Observations are those of the authors and do not necessarily reflect a position of  Shell Capital Management, LLC. The use of this website is subject to its terms and conditions.

The stock index falls below its long-term trend, but stocks are now getting oversold

The stock index falls below its long-term trend, but just as stocks are getting oversold. The 200-day moving average was about 11% below the high February 19th, just eight days ago.

spx spy 200 day moving average trend 11 percent Feb 2020

As you can see in the chart, this has been a sharp waterfall decline and one I’m glad we avoided so far. For those of us in a position of strength, we stalk the market actively looking for a lower-risk entry point that offers the potential for asymmetric risk-reward payoff. An asymmetric payoff is when we structure our positions so our potential for downside loss is limited to much less than the potential for capital gains.

The stock market is now getting more oversold on a short term basis.

Only 21% of S&P 500 stocks are above their 50 day moving average. That’s a lot of broken uptrend lines shifting into downtrends.

stock market oversold

In the chart, I colored the “buy zone” in green. As you can see, it’s now down to a level I consider an indication that selling pressure may become exhausted as long as prices have been sold down to a low enough level to attract buying demand.

The stock market, and stock prices, are driven by supply and demand. It’s that simple. Measuring supply and demand isn’t so simple for most investors.

In the bigger picture, the longer-term trend lines are still at the 50-yard line, which is where all but one of the past five declines stopped. Of course, the one time stocks really got sold down was late 2018. Only time will tell if this becomes another period like that, but right now, those of us who had reduced or removed exposure to the market losses are probably looking to buy.

stock market breadth

The longer-term trend lines are holding better, which is no surprise because stocks had trended up well above their longer trend lines. For example, the S&P 500 index was trading about 11% above its own 200 day moving average and it just now crossed below it. When many stocks are trending that far above their trend line, it takes more of a price decline to trigger the percent of stocks to fall.

february 2020 stock market loss decline

Stocks market declines to tend to be asymmetric. Prices trend down faster than they trend up. After prices trend down, contagion sets in the lower prices fall. Prices then get driven down even more simply because investors are selling to avoid further loss. But, someone has to be on the other side of their panic selling. It’s those who had the cash to buy.

If you sell higher, you can buy lower.

Need help? Contact us here.

Mike Shell is the Founder and Chief Investment Officer of Shell Capital Management, LLC, and the portfolio manager of ASYMMETRY® Global TacticalMike Shell and Shell Capital Management, LLC is a registered investment advisor in Florida, Tennessee, and Texas focused on asymmetric risk-reward and absolute return strategies and provides investment advice and portfolio management only to clients with a signed and executed investment management agreement. The observations shared on this website are for general information only and should not be construed as advice to buy or sell any security. Securities reflected are not intended to represent any client holdings or any recommendations made by the firm. I observe the charts and graphs to visually see what is going on with price trends and volatility, it is not intended to be used in making any determination as to when to buy or sell any security, or which security to buy or sell. Instead, these are observations of the data as a visual representation of what is going on with the trend and its volatility for situational awareness. I do not necessarily make any buy or sell decisions based on it. Any opinions expressed may change as subsequent conditions change.  Do not make any investment decisions based on such information as it is subject to change. Investing involves risk, including the potential loss of principal an investor must be willing to bear. Past performance is no guarantee of future results. All information and data are deemed reliable but is not guaranteed and should be independently verified. The presence of this website on the Internet shall in no direct or indirect way raise an implication that Shell Capital Management, LLC is offering to sell or soliciting to sell advisory services to residents of any state in which the firm is not registered as an investment advisor. The views and opinions expressed in ASYMMETRY® Observations are those of the authors and do not necessarily reflect a position of  Shell Capital Management, LLC. The use of this website is subject to its terms and conditions.

Dow Jones is down -10% off its high

Dow Jones is down -10% off its high. I don’t pay much attention to the Dow Jones Industrial Average as it’s a price-weighted index of 30 stocks. But, the S&P 500 capitalization-weighted index of approximately 500 stocks seems a better proxy for “the market,” and it’s not far behind.

Here is the percent off high (drawdown) chart year to date.

dow jones down over 10 %

We don’t own either of these ETFs, they are for illustration only. In fact, our portfolio is was 85% U.S. Treasuries, and 15% invested in high dividend-yielding positions. One of them has a dividend yield of 9.8% and the other 11.9%, so while their prices may be falling with the stock market, we have some margin of safety from the high yield. In fact, as the prices fall, the yield rises from that starting point.

Speaking of dividend yield below is a visual of the dividend yield of the S&P 500 (1.84’%) and the Dow (2.27%), which are relatively low historically. But, as prices fall, the yields will rise, assuming the stocks in the index keep paying dividends.

stock dividend yield

In the above chart, I’m using the ETF dividend yields as they are real-time. Since the ETFs have only been trading for two or three decades, to see what I mean by “long term” I look at the S&P 500 Stock Index dividend yield (calculated as 12-month dividend per share)/price) to see how low the yield has been the past twenty years.

long term stock dividend yield

So, the future expected return from dividend yields on these stocks indexes is relatively low, looking back 150 years. The spikes you see are after stock market crashes as the price falls, the yield rises, as with bonds. Low dividend yield also suggests the stock market is overvalued. A higher dividend yield indicates the stock market is undervalued, and if nothing else, investors earn a higher income from the dividends from a lower starting price.

Back to the year to date, the short term, the S&P 500 is now down -5% in 2020, and the Dow Jones is down -7%.

stock market drop 2020

I believe this may be the fastest -10% decline in the history of the Dow Jones Industrial average.

I’m just glad we aren’t in it.

This is when drawdown controls and risk management pays. More importantly, it’s when discipline pays. While some investment managers want to manage risk to limit their drawdowns, they don’t always excel at doing it. Discipline is a personal edge. It doesn’t matter how good our scientifically tested quantitative models with a mathematical basis for believing in them are if we lack the discipline to execute them with precision. I can also say it isn’t enough for me to have all the discipline either, as we must necessarily help our investment management clients stick with it, too. So, investor behavior modification is part of our wealth management services. It’s why Christi Shell is not only a Certified Wealth Strategist® with over twenty-six years of experience helping high net worth families with the overall management of assets but also a certified Behavioral Financial Advisor® (BFA®) to help them manage themselves.

It’s what we do.

Need help? Contact us here.

Mike Shell is the Founder and Chief Investment Officer of Shell Capital Management, LLC, and the portfolio manager of ASYMMETRY® Global TacticalMike Shell and Shell Capital Management, LLC is a registered investment advisor in Florida, Tennessee, and Texas focused on asymmetric risk-reward and absolute return strategies and provides investment advice and portfolio management only to clients with a signed and executed investment management agreement. The observations shared on this website are for general information only and should not be construed as advice to buy or sell any security. Securities reflected are not intended to represent any client holdings or any recommendations made by the firm. I observe the charts and graphs to visually see what is going on with price trends and volatility, it is not intended to be used in making any determination as to when to buy or sell any security, or which security to buy or sell. Instead, these are observations of the data as a visual representation of what is going on with the trend and its volatility for situational awareness. I do not necessarily make any buy or sell decisions based on it. Any opinions expressed may change as subsequent conditions change.  Do not make any investment decisions based on such information as it is subject to change. Investing involves risk, including the potential loss of principal an investor must be willing to bear. Past performance is no guarantee of future results. All information and data are deemed reliable but is not guaranteed and should be independently verified. The presence of this website on the Internet shall in no direct or indirect way raise an implication that Shell Capital Management, LLC is offering to sell or soliciting to sell advisory services to residents of any state in which the firm is not registered as an investment advisor. The views and opinions expressed in ASYMMETRY® Observations are those of the authors and do not necessarily reflect a position of  Shell Capital Management, LLC. The use of this website is subject to its terms and conditions.

What volatility expansions tell us about expectations for stock market trends

A volatility expansion implies that stock prices are expected to spread out more, as measured by the (VIX) CBOE Volatility Index. Currently, it’s at 28, which would imply a 28% expected volatility over the next 30 days, except it tends to be priced at a premium above realized vol.

vix volatility expansion asymmetric hedge options

Then, historical volatility, or realized actual volatility,  such as the 30-day rolling volatility, suggests prices are indeed spreading out. So, expect a wider range up AND down in volatility expansions. In the chart below, 30 Day Rolling Volatility = Standard Deviation of the last 30 percentage changes in Total Return Price * Square-root of 252. At this point, it’s at 17.71% when applied to the S&P 500 stock index data.

asymmetric volatility trading hedge

Here they are together, expected volatility on top of realized volatility.

vol expansion

A volatility expansion like this suggests in the near term stock prices are expected to spread out more, but up and down.

We are seeing a broad range of prices today, form up 1.4% to down -0.60%, as seen below.

SPY SPX TRADING

So, if you are invested in the stock market, prepare yourself accordingly. Need help? Contact us here.

Mike Shell is the Founder and Chief Investment Officer of Shell Capital Management, LLC, and the portfolio manager of ASYMMETRY® Global TacticalMike Shell and Shell Capital Management, LLC is a registered investment advisor in Florida, Tennessee, and Texas focused on asymmetric risk-reward and absolute return strategies and provides investment advice and portfolio management only to clients with a signed and executed investment management agreement. The observations shared on this website are for general information only and should not be construed as advice to buy or sell any security. Securities reflected are not intended to represent any client holdings or any recommendations made by the firm. I observe the charts and graphs to visually see what is going on with price trends and volatility, it is not intended to be used in making any determination as to when to buy or sell any security, or which security to buy or sell. Instead, these are observations of the data as a visual representation of what is going on with the trend and its volatility for situational awareness. I do not necessarily make any buy or sell decisions based on it. Any opinions expressed may change as subsequent conditions change.  Do not make any investment decisions based on such information as it is subject to change. Investing involves risk, including the potential loss of principal an investor must be willing to bear. Past performance is no guarantee of future results. All information and data are deemed reliable but is not guaranteed and should be independently verified. The presence of this website on the Internet shall in no direct or indirect way raise an implication that Shell Capital Management, LLC is offering to sell or soliciting to sell advisory services to residents of any state in which the firm is not registered as an investment advisor. The views and opinions expressed in ASYMMETRY® Observations are those of the authors and do not necessarily reflect a position of  Shell Capital Management, LLC. The use of this website is subject to its terms and conditions.

Stock market recoveries are a process, not an event

After yesterday’s close, the popular stock market indexes, including the S&P 500, Dow Jones Industrial Average, and NASDAQ were down around -3% for the day.

stock market

Adding volatility bands around the price trend and its 20 day moving average illustrates a volatility expansion as prices have spread out to a wider trading range. The S&P 500 stock index traded below its lower volatility band, which expands as the price action becomes volatile. Volatility bands and channels help to answer: Are prices high or low on a short term relative basis? The recent price action is relatively high at the upper band and low at the lower band. By the way, I observe the charts and graphs to visually see what is going on with price trends and volatility, it is not intended to be used in making any determination as to when to buy or sell any security, or which security to buy or sell. Instead, these are observations of the data as a visual representation of what is going on with the trend and its volatility for situational awareness. I do not necessarily make any buy or sell decisions based on it. 

volatility expansion bollinger band

At this point, the stock index has traded below its band, demonstrating panic level selling pressure outside what I consider a normal range of price action. 

Volatility channels are even more useful when combined with other indicators for confirmation. Next, I add a momentum measure for confirmation the index is oversold on a short-term basis. It can get more oversold, but a short term reversal now becomes likely if the desire to sell has become exhausted. 

spx spy countertrend trend following asymmetric risk reward

The potential good news for those with exposure to loss, in the short term, we may see a countertrend move back up to retrace some of the stock market losses. However, this will be the test to see if selling pressure has been exhausted or if prices have been driven down low enough to attract sufficient buying interest to push the price trends back up.

Another observation I’ll share is after the close, we recalculated the percent of S&P 500 stocks above their 200 day moving average using the end of day prices. The percent of stocks above their 200 day moving average is now at the 50-yard line, whit bout half of the SPX stocks in a longer-term uptrend and a half in a downtrend. Obviously, that’s more stocks now below the trend line than when I shared it yesterday.

percent of spx stocks above below 200 day moving average

A more significant decline is seen in the percent of stocks above their 50-day moving averages, which fell 38% to only 23% of S&P 500 stocks trading above their shorter-term moving average trend line.

percent of stocks above below 50 day moving average breadth

So, at least on a short term basis, selling pressure has pushed stocks down to the point more are in downtrends than uptrends.

Next, we’ll see if sellers have pushed prices low enough to attract significant buying demand. I expect to see at least a short term countertrend back up, as investors overreacted to the downside, but only time will tell if any countertrend up is sustainable long term. My longer-term indicators are neutral at this point, so there could be more selling if investors and traders anchor to prior highs wishing they’d sold previously and sell into an uptrend.

My objective is asymmetric returns, so I focus on asymmetric risk-reward. After prices seem to trend up too far, too fast, by my quantitative mathematical calculations, the asymmetric returns from future prices are limited, and the asymmetric risk is increased. After prices seem to fall too far, too fast, by my quantitative mathematical calculations, the asymmetric risk-reward profile becomes more positive. And, all of it is probabilistic, none of it is ever a sure thing.

It’s a process, not an event.

As I shared yesterday; Stock prices may not be finished falling, but some opportunities for asymmetric risk-reward may be present for those willing to take risks.  

Need help? Contact us here

Mike Shell is the Founder and Chief Investment Officer of Shell Capital Management, LLC, and the portfolio manager of ASYMMETRY® Global TacticalMike Shell and Shell Capital Management, LLC is a registered investment advisor in Florida, Tennessee, and Texas focused on asymmetric risk-reward and absolute return strategies and provides investment advice and portfolio management only to clients with a signed and executed investment management agreement. The observations shared on this website are for general information only and should not be construed as advice to buy or sell any security. Securities reflected are not intended to represent any client holdings or any recommendations made by the firm. I observe the charts and graphs to visually see what is going on with price trends and volatility, it is not intended to be used in making any determination as to when to buy or sell any security, or which security to buy or sell. Instead, these are observations of the data as a visual representation of what is going on with the trend and its volatility for situational awareness. I do not necessarily make any buy or sell decisions based on it. Any opinions expressed may change as subsequent conditions change.  Do not make any investment decisions based on such information as it is subject to change. Investing involves risk, including the potential loss of principal an investor must be willing to bear. Past performance is no guarantee of future results. All information and data are deemed reliable but is not guaranteed and should be independently verified. The presence of this website on the Internet shall in no direct or indirect way raise an implication that Shell Capital Management, LLC is offering to sell or soliciting to sell advisory services to residents of any state in which the firm is not registered as an investment advisor. The views and opinions expressed in ASYMMETRY® Observations are those of the authors and do not necessarily reflect a position of  Shell Capital Management, LLC. The use of this website is subject to its terms and conditions.


What really drives stock prices down?

What really drives stock prices? The price of stocks, just like groceries, is driven by supply and demand of people “the market” buying and selling. What drives stock prices and the stock market really is no more complicated than that.

Unless you make it more complicated, then it is for you.

What drives stock prices? It is probably one of the most asked questions we get.  It’s also one of the best questions, so I’ll share my observation of it as succinct as I can.

Many investors seem to believe stock prices, and therefore, the stock market is driven by the news of the day because they see the headlines. The press tries to construct a story of the cause and effect. But, if we look at the news headlines on any day, we observe vastly conflicting narratives and reasons for a stock market directional move. 

To be sure, here are the headlines I found online today. According to headlines, recent price action and volatility are driven by everything from Trump’s talk on a China trade deal to an overvalued stock market to factory data to the fear of missing out.

what drives stock prices

The answer is, “all of the above” drives the stock market.

The news is newly received or noteworthy information, especially about recent or relevant events. However, none of us can say which specific news actually drives stock prices. 

If you really want to know what drives stock prices, it’s just the market, doing what it does.

All information and news have the potential to drive stock prices, as does investor sentiment. The price of stocks, just like groceries, is driven by supply and demand of people buying and selling. When emotion gets imbalanced, prices trend. Yes, there’s another asymmetry!

When supply and demand are symmetrical, the price stays the same.

When supply and demand are asymmetrical, the price trends in the direction of the most pressure and enthusiasm.

After yesterday’s close, I saw someone ask, “Why did the stock market do so bad today?”

I’m guessing he saw a headline like this:

what drives the stock market causes stocks to go up and down

However, a Dow decline of -0.96% isn’t a significant drop, but if you anchor to the “-268 point drop” as most do, it may sound worse, to you.

I focus on the % change to normalize the movement. Normalizing with the percent change adjusts the values measured on different scales to a notionally standard scale. For example, the “-268 point drop” is one thing from an absolute level of 27,783, but a very different situation when the Dow was at 10,000. At today’s level of 27,783, it’s only -0.96%, but the same point drop when the index was 10,000 is -2.68%, nearly three times the single-day loss.

A -1% single-day decline in the stock index isn’t a lot by historical standards. If it feels like it is, the investor should either better inform themselves of market history or have little to no exposure to the stock market. I’ll help with the former below.

First, here are the stats. I’ll continue to use the Dow Jones Industrial Average index data.

So far, in 2019, the Dow has declined -1% or more on 18 days. When it declined -1% or more in a single day, the average drop that day was -1.7%. So, a -1% drop isn’t uncommon. It’s well within a normal range for a down day. I count about 231 trading days so far in 2019, excluding holidays, so 18 of those days falling -1% or more is nearly 10% of the days. And remember, the average drop those days was -1.7%, yesterday was only -1%.

Oh, and the worst day so far in 2019 was -3%, so it could be three times worse!

When we extend the lookback period to this time last year, the Dow declined -1% or more on 26 days. When it declined -1% or more in a single day, the average drop that day was -1.87%. Again, a -1% drop isn’t uncommon. Last December was a very volatile month.

2018 was more volatile than 2019, so far. In 2018, the Dow declined more than -1% on 35 days, and when it did, the average drop was -2%, and the worst day was -4.6%.

Investors tend to anchor to the recent past and extrapolate it into the future. That is, humans tend to expect what is happening now to continue. After a volatile 2018, most investors probably expected a volatile 2019. For many, the down days and downtrends in 2018 were a shocker after an abnormally quiet 2017. In 2017, the stock market trended up with little downside. We only saw 4 down days of -1% or more, and the average down day was only 1.3%, and the worse was 1.7%. You can probably see how many were stunned last year.

This may make you wonder when investor fear drives down stock prices, what is a “normal” down day?

It depends on the time frame and the market state over that time frame. Over the past three years, the Dow declined 57 days more than -1%, and the average down day was -1.9%, and the worst was -4.6%. That’s nearly 700 data points, so the sample size is likely enough to say we should expect a -2% down day is going to happen, and a -5% is possible.

To expand the sample size, I wondered how many -1% or more down days I’ve dealt with since I started managing our primary portfolio in May 2005. In the last fourteen years, the Dow has dropped -1% or more 427 days, and an average decline was -1.8%, and the worst down day was -9.4%! You can probably see why a -1% down day from my perspective isn’t a big deal, and the statistics of the data also confirms it’s well within a typical down day.

Of course, the trouble is larger downtrends being with down days. So, the investor’s concern isn’t just a single down day, but instead a series of down days, which is a downtrend. Before moving on to what drives stock prices and the stock market, let’s look at the downtrends.

Over the past year, the Dow Jones has declined more than -5% twice and -20% once starting last December. All of these downtrends include -1% down days. So, I’m not saying they don’t matter, but instead, the single -1% down day isn’t by itself significant.

Expanding the lookback period to the past 10 years, we see many downtrends of -5% or more. But, within those downtrends, there was only one -5.4% down day, but 245 down days over -1% with an average loss of -1.6%. Downtrends include these down days.

Next, we look all the way back to the beginning of the index data to observe its historical downside. The 1926 era Great Depression was by far the worst when the Dow Jones Industrial Average fell over -75%. It makes the 2007-09 period when it fell -50% look tame.

Clearly, if you invest in the stock market, you should expect to experience drops of -5% a few times a year, and -10% maybe once a year, and -20% or more at least every market cycle. If all you do is buy and hold stocks or stock funds, expect to experience a -50% because if history is a guide, it has happened before, so it could happen again.

You can probably see Why we row, not sail.

To understand what drives stock prices and how much of a loss is considered a large loss, we have to know the history. I hope I’ve shared it in a helpful way.

If there’s anything I hope individual investors get from my observations, it’s a better understanding of the risks of investing. The rewards of investing are well advertised, but the risks are what matters the most when our focus is asymmetric risk/reward. When prices of positions are trending in our favor increasing our investment account value, our concern isn’t that we are making too much money. Our interest is not giving up all the profit, which is a risk management function.

The exit, not the entry, always determines the outcome.

If you want to know what really caused the decline, I shared my opinion in a single chart that I believe sums it up best. It was good enough to make it in The Daily Shot in the Wall Street Journal. As the stock index has trended up quietly in recent weeks, volatility had contracted, as seen in the chart. As I shared, “Periods of low volatility are often followed by volatility expansions.”

Mike Shell Wall Street Journal WSJ

A few weeks ago, I also observed investor sentiment had reached an extremely optimistic level as stated in Investor sentiment signals greed is driving stocks as the U.S. stock market reaches short term risk of a pullback.

Now that stock prices have fallen two days in a row, we’ll start to see the pendulum swing from extreme greed to a middle ground. If the stock market drops a lot more, investor sentiment will become fearful, just in time for a reversal back up again.

Some favor stories, others favor data and charts, I’m a math guy, so I prefer the data and visually seeing it in charts. I’m lucky to be able to write.

What we have here isn’t a failure to communicate, the news is everywhere. I think it’s a misunderstanding of what really drives stock prices down. It’s the desire and enthusiasm to sell.

Stock price trends, just like groceries, are driven by supply and demand of people buying and selling. When sentiment gets imbalanced, prices trend in the direction that has the most force and momentum.

Yes, it’s another asymmetry! Without the asymmetry, prices would stay the same.

In the spirit of ASYMMETRY® and asymmetric risk-reward payoffs, I’m naturally trying to get the most reward from my observations by helping as many people as possible, so share it! And enter your email on the right to get immediate notices of new ASYMMETRY® Observations. We do not sell or use your email address in any other way. Also, follow me on Twitter: @MikeWShell

Mike Shell is the Founder and Chief Investment Officer of Shell Capital Management, LLC, and the portfolio manager of ASYMMETRY® Global Tactical.

Mike Shell and Shell Capital Management, LLC is a registered investment advisor focused on asymmetric risk-reward and absolute return strategies and provides investment advice and portfolio management only to clients with a signed and executed investment management agreement. The observations shared on this website are for general information only and should not be construed as advice to buy or sell any security. Securities reflected are not intended to represent any client holdings or any recommendations made by the firm. Any opinions expressed may change as subsequent conditions change.  Do not make any investment decisions based on such information as it is subject to change. Investing involves risk, including the potential loss of principal an investor must be willing to bear. Past performance is no guarantee of future results. All information and data are deemed reliable but is not guaranteed and should be independently verified. The presence of this website on the Internet shall in no direct or indirect way raise an implication that Shell Capital Management, LLC is offering to sell or soliciting to sell advisory services to residents of any state in which the firm is not registered as an investment advisor. The use of this website is subject to its terms and conditions.

Can an optimistic investor sentiment measured by the AAII Investor Sentiment Survey trend higher?

Someone asked:

Can an optimistic investor sentiment in AAII Investor Sentiment Survey trend higher?

Another commented:

The AAII Investor Sentiment Survey is just over its long term average, so it has room to run.

Of course, bullish investor sentiment can trend higher. That is especially true when looking at just one survey measure like the AAII Investor Sentiment Survey.

Below I charted the Investor Sentiment, % Bearish and % Bullish using the AAII Investor Sentiment Survey data. Looking at the extremes, the end of 2017 was the highest % Bullish and the lowest % Bearish. If you recall, it was a very euphoric period with stocks trending up.

For another less noisy visual of this observation, I then chart the % Bullish – Bearish Spread. When it’s higher, more investors taking the survey are bullish. When it’s lower, more are bearish.

The peak optimism is clearly shown at the end of 2017 after the stock market had trended up with abnormally low volatility.

The peak cycle in pessimism was last December 2018, after stock prices had a waterfall decline.

To be sure, next, we overlay the % Bull-Bear Spread over the S&P 500 stock index. We can see visually the % Bullish reached an extremely high level in the last month of 2017 as the stock index trended up.  But, what happened afterward? aaii investor sentiment survey research backtesting

We see its lowest level over the period was the end of 2018 as stocks were in a waterfall decline.

The key is; what happened after the extreme level of bullishness?

It continued for a while, but I warned about it on January 24, 2018:

By the way, this past year is vastly different than the low volatility period I highlighted above. I was pointing out the stock index hadn’t dropped more than -4% in over a year and that was an unusually quiet condition. This past year has been more normal-looking from that perspective, with tow -5% – 7% drops after the waterfall.

Below is the trend from 2015 to 2018 to put it into perspective. Preceding 2017 were those two declines in 2015 and 2016. The beginning of which was considered a “flash crash.”

After stocks reached the second low, the trend up became smoother and smoother. Oh yeah, another blast from the past; I pointed that out, too, in November 2017.

Below is the trend from the January 26, 2018 peak through December 2018. The S&P 500 stropped -18% and more like -20% from the recovery high in October 2018 before the waterfall decline.

Here is the trend from January 1, 2017, to December 25, 2018. It’s what happened after the euphoric period. It was all but wiped out just a few months.

Can the investor sentiment get even more optimistic and drive stock prices even higher? Of course, it can! It has before! The Bull-Bear Spread is elevated, but not at its historical extremes.

But the AAII Investor Sentiment Survey isn’t necessarily a timing indicator by itself. It’s just a gauge. But, when combined with other observations I’ve discussed this week, the weight of the evidence suggests it’s a better time to reduce risk and hedge than to take on new risks as these surveys show investors are doing.

Those who forget the past are doomed to repeat it. 

Those who learn from the past have the potential to gain an edge from it.  

Have a great weekend!

Mike Shell is the Founder and Chief Investment Officer of Shell Capital Management, LLC, and the portfolio manager of ASYMMETRY® Global Tactical.

Mike Shell and Shell Capital Management, LLC is a registered investment advisor focused on asymmetric risk-reward and absolute return strategies and provides investment advice and portfolio management only to clients with a signed and executed investment management agreement. The observations shared on this website are for general information only and should not be construed as advice to buy or sell any security. Securities reflected are not intended to represent any client holdings or any recommendations made by the firm. Any opinions expressed may change as subsequent conditions change.  Do not make any investment decisions based on such information as it is subject to change. Investing involves risk, including the potential loss of principal an investor must be willing to bear. Past performance is no guarantee of future results. All information and data are deemed reliable but is not guaranteed and should be independently verified. The presence of this website on the Internet shall in no direct or indirect way raise an implication that Shell Capital Management, LLC is offering to sell or soliciting to sell advisory services to residents of any state in which the firm is not registered as an investment advisor. The use of this website is subject to its terms and conditions.

Implied volatility as measured by VIX indicates a volatility expansion in the near term

Implied volatility as measured by VIX indicates wider prices in the near term. The CBOE Volatility Index VIX has increased to 20, which is it’s long term average, suggesting prices will spread out to 20%.

Along with a volatility expansion, as typical, we are seeing stock prices trend down.

My leveraged exposure to the long term U.S. Treasuries has offered an asymmetric hedge in recently. The long term U.S. Treasuries don’t always play out this way, but this time we’ve benefited from their uptrend and some negative correlation with stocks.

Gold is another alternative used as a hedge exhibiting relative strength and time-series momentum.

 If this is just a short term correction, we should see some buying interest near this point or a little lower. If last month’s lows are taken out, this may be the early stage of a larger decline.

We were well-positioned in advance this time, so we’ll see how it all plays out.


Mike Shell is the Founder and Chief Investment Officer of Shell Capital Management, LLC, and the portfolio manager of ASYMMETRY® Global Tactical.

Mike Shell and Shell Capital Management, LLC is a registered investment advisor focused on asymmetric risk-reward and absolute return strategies and provides investment advice and portfolio management only to clients with a signed and executed investment management agreement. The observations shared on this website are for general information only and should not be construed as advice to buy or sell any security. Securities reflected are not intended to represent any client holdings or any recommendations made by the firm. Any opinions expressed may change as subsequent conditions change.  Do not make any investment decisions based on such information as it is subject to change. Investing involves risk, including the potential loss of principal an investor must be willing to bear. Past performance is no guarantee of future results. All information and data is deemed reliable, but is not guaranteed and should be independently verified. The presence of this website on the Internet shall in no direct or indirect way raise an implication that Shell Capital Management, LLC is offering to sell or soliciting to sell advisory services to residents of any state in which the firm is not registered as an investment advisor. Use of this website is subject to its terms and conditions.


Global Macro observations and the period of indecision ends with an upside breakout in stocks

In the last observation, The stock market is in a period of indecision that it will break out of I shared:

Looking at the price trend of the S&P 500 index over the past six months, today’s 1.4% move so far has the trend tapping the upper end of the range. I encluded this chart last Thursday:

asymmetric risk reward return stocks

Here we are a week later, and sure enough, this stock index broke out of the range.

stock market spx spy trend

Of course, past performance doesn’t assure future results, so while this upside breakout is positive, it isn’t without some risks and potential headwinds.

I hedged off some of my market risks, based on pattern recognition hedging the price trend could once again fall back to the lower red line. Of course, my exits on these hedges are predefined, as always, so none of the following global macro observations have any real tactical decision-making authority.

When I enter a position, I predetermine at what price I’ll exit if it becomes a loser or overtime, a laggard.

I’m no economist, so I rarely mention any economic data trends as they don’t lead to actionable tactical signals to buy or sell. However, one of the economy’s strongest segments may be showing signs of weakening: job growth, and it seems important enough to mention. On the global macro front, it seems like the market wasn’t concerned about employment data, and for now, it was right. 

In the big picture from a global macro perspective, the probabilities of a recession are trending higher, earnings growth is lagging, and business and manufacturing sentiment are trending lower. These may be necessary issues the U.S. has to deal with to get through the trade war with China.

On the other hand consumer confidence, spending, and employment have been able to withstand difficult conditions and recover. Up until now, the consumer and employment has been the bright spot. From this point forward, any weaknesss in consumer spending, confidence, and employment is a risk. Momentum in job growth has turned down from a cyclical peak this year, so I’m guessing it’s something that may become an issue eventually. When it comes to global macro data, there’s always something to worry about, so I don’t make my decisions with it.

Today’s employment data was a little better than expected, so it’s a driver of today’s stock market upside breakout. As past performance never guarantees the future, it may be different next time.

Until then, the stock market has indeed broken out of its coil and is sprung up.


Mike Shell is the Founder and Chief Investment Officer of Shell Capital Management, LLC, and the portfolio manager of ASYMMETRY® Global Tactical.

Mike Shell and Shell Capital Management, LLC is a registered investment advisor focused on asymmetric risk-reward and absolute return strategies and provides investment advice and portfolio management only to clients with a signed and executed investment management agreement. The observations shared on this website are for general information only and should not be construed as advice to buy or sell any security. Securities reflected are not intended to represent any client holdings or any recommendations made by the firm. Any opinions expressed may change as subsequent conditions change.  Do not make any investment decisions based on such information as it is subject to change. Investing involves risk, including the potential loss of principal an investor must be willing to bear. Past performance is no guarantee of future results. All information and data is deemed reliable, but is not guaranteed and should be independently verified. The presence of this website on the Internet shall in no direct or indirect way raise an implication that Shell Capital Management, LLC is offering to sell or soliciting to sell advisory services to residents of any state in which the firm is not registered as an investment advisor. Use of this website is subject to its terms and conditions.


The value of technical analysis of stock market trends

Someone asked; how do you use technical analysis (charting) as an investment manager?

I’ll share a simple and succinct example.

Below is a chart of a popular stock market index. What do you see when you look at it?

I see an overall uptrend based on this time frame, which is only year-to-date.

I see it’s experiencing a normal-looking interruption in the short term, so far.

As such, I’m looking for signs of which direction it’s going to move, by observing which direction it does move.

Without adding a single “technical indicator” for statistical or quantitative analysis, I see the stock market using this proxy has been drifting generally sideways since February.

spy spx ytd trend following

However, it has made higher highs and higher lows, so it’s a confirmed uptrend.

Looking closer, are shorter term, I see the green highlighted area is also in a non-trending state, bound by a range. I’m looking for it to break out; up or down.

setting stop loss for stocks

If it breaks down, I will look for it to pause around the red line I drew, because it’s the prior low as well as an area of trading before that. I would expect to see some support here, where buyer demand could overcome selling pressure.

If it doesn’t, I’d say:

Look out below!

Do I trade-off this? Nope.

Am I telling you to? Nope.

But, if I wanted to trade off it, I could. This is an index and the index is an unmanaged index and cannot be invested in directly. But, for educational purposes, assume I could enter here. Before I did, I would decide my exit would be at least a break below the red line. Using that area as an exit to say “the trend has changed from higher lows to lower lows, which is down, I’ll exit if it stays below the line.

Of course, the same strategy can be applied quantitatively into a computerized trading system. I could create an algorithm that defines the red line as an equation and create a computer program that would alert me to its penetration.

This is a succinct and simple glimpse into concepts of how I created my systems.

I hope you find it useful.

I developed skills at charting before I created quantitative systems. If someone doesn’t believe in either method, they probably lack the knowledge and skill to know better.

Let me know if we can help!

Mike Shell is the Founder and Chief Investment Officer of Shell Capital Management, LLC, and the portfolio manager of ASYMMETRY® Global Tactical.

Mike Shell and Shell Capital Management, LLC is a registered investment advisor and provides investment advice and portfolio management exclusively to clients with a signed and executed investment management agreement. The observations shared on this website are for general information only and should not be construed as advice to buy or sell any security. Securities reflected are not intended to represent any client holdings or any recommendations made by the firm. Investing involves risk, including the potential loss of principal an investor must be willing to bear. Past performance is no guarantee of future results. All information and data is deemed reliable, but is not guaranteed and should be independently verified. The presence of this website on the Internet shall in no direct or indirect way raise an implication that Shell Capital Management, LLC is offering to sell or soliciting to sell advisory services to residents of any state in which the firm is not registered as an investment advisor. Use of this website is subject to its terms and conditions.
Investor fear has been driving the stock market down

I like to observe the return drivers of price trends. Though I primarily focus on the direction of the price trend and volatility, I also consider what drives the price trend.

Yesterday I suggested the stock market was at a point of pause and possible reversal back up in The stock market is holding its breadth… for now.  I shared some examples of how the percent of stocks in a positive trend had declined to a point that could indicate the selling in the near term could be drying up.

So far, today’s sharp reversal up seems to confirm at least a short term low.

Up until today, the S&P 500 stock index was down about -6% off its high. In May it dropped -8% before reversing back up to a new high. I express these drawdowns in the % off high chart below. This is year-to-date, since January 1.

Just for reference, this -6% decline looks more similar to May when I expand the time frame to 1 year instead of just year-to-date. We also see the October to December waterfall decline was a much deeper -20%.

Of course, if you look close enough, the pattern prior to the much steeper and deeper part of that fall looks similar to now, with the price trend testing the prior low, recovering, then falling sharply another -10%. I’m not pointing this out to say it will happen again, but instead that it’s always a possibility, so risk management is essential.

What is driving this decline?

Fear.

It’s that simple.

Some are afraid of another recession signaled by an inverted yield curve, others of the Trump Tweets, others by the Fed lowering interest rates or not doing it fast enough. I’ve heard some hedge funds are afraid China will invade Hong Kong, others are concerned of the China tariffs. Some people probably wake up afraid and fear everything that can possibly happen, as such, they experience it as if it did.

I prefer to face my fears and do something about them.

Investors have reached an extreme level of fear in the past few weeks as evidenced by the -6% decline in the stock index. We can also see this reflected in the investor sentiment poll. The AII Sentiment Survey shows optimism is at an unusually low level and pessimism is at an unusually high level for the 2nd consecutive week.

investor sentiment extreme trading

Such extreme levels of investor sentiment often proceed trend reversals. So, these extreme fear measures along with the breadth measures I shared yesterday, I’m not surprised to see the stock market reverse up sharply today.

Another interesting measure is the Fear & Greed Index, which is a combination of multiple sentiment indicators believed to measure investor sentiment. The Fear & Greed Index has reached the “Extreme Fear” level, so by this measure, fear is driving prices.

fear greed index

Over time, we can see how the Fear & Greed Index has oscillated up and down, swinging from fear to greed and back to fear again. I highlight the current level has reached the low point it typically does before it reverses up again, with the exceptions of the sharp panics in 2018.

advisor money manager using fear greed index extreme behavior

I have my own proprietary investor sentiment models, but here I share some that are simple and publicly available. I’m not suggesting you trade-off of these, as I don’t, either, but instead use them to help modify your investor behavior. For example, rather than use these indicators to signal offense or defense, investors may use them to alert them to their own herding behavior. Most of the time, we are better off being fearful when others are greedy and greedy when others are fearful.

These measures aren’t quite robust enough to be timing indicators by themselves, my signals are coming from other systems and I’m using these to illustrate what’s driving it.

Over the past 12 months, as of right now the stock index is up 2.48%. That’s including today’s 1.5% gain.

Only time will tell if it holds the line, but as I’ve zoomed in to a 3-month time frame, we can see the first line of support that needs to hold.

We are long and strong at this point, so;

Giddy up!


Mike Shell is the Founder and Chief Investment Officer of Shell Capital Management, LLC, and the portfolio manager of ASYMMETRY® Global Tactical.

Mike Shell and Shell Capital Management, LLC is a registered investment advisor and provides investment advice and portfolio management exclusively to clients with a signed and executed investment management agreement. The observations shared on this website are for general information only and should not be construed as advice to buy or sell any security. Securities reflected are not intended to represent any client holdings or any recommendations made by the firm. Investing involves risk, including the potential loss of principal an investor must be willing to bear. Past performance is no guarantee of future results. All information and data is deemed reliable, but is not guaranteed and should be independently verified. The presence of this website on the Internet shall in no direct or indirect way raise an implication that Shell Capital Management, LLC is offering to sell or soliciting to sell advisory services to residents of any state in which the firm is not registered as an investment advisor. Use of this website is subject to its terms and conditions.

Giddy up…

As expected, the U.S. stock market declined briefly, then found enough buying enthusiasm to drive prices to a new breakout above the March high.

As I concluded in Strong stock market momentum was accompanied by broad participation:

“…though we shouldn’t be surprised to see short term weakness, we could suppose the longer term trend still has room to run.”

As we see in the chart below, while the U.S. stock market is trending with absolute momentum, the strongest relative momentum has been in other countries around the globe.

global macro asymmetric risk reward .jpg

Though my short term momentum systems signaled weeks ago the current uptrend may become exhausted and it did, the reversal back up and continuation since then appears bullish.

At this point, it appears some global stock markets are in uptrends and may have more room to run. For asymmetric risk/reward, I cut my losses short and let the winners run on.

Giddy up…


Mike Shell is the Founder and Chief Investment Officer of Shell Capital Management, LLC, and the portfolio manager of ASYMMETRY® Global Tactical.

Mike Shell and Shell Capital Management, LLC is a registered investment advisor and provides investment advice and portfolio management exclusively to clients with a signed and executed investment management agreement. The observations shared on this website are for general information only and are not specific advice, research, or buy or sell recommendations for any individual. Investing involves risk including the potential loss of principal an investor must be willing to bear. Past performance is no guarantee of future results. All information provided is deemed reliable, but is not guaranteed and should be independently verified. The presence of this website on the Internet shall in no direct or indirect way raise an implication that Shell Capital Management, LLC is offering to sell or soliciting to sell advisory services to residents of any state in which the firm is not registered as an investment advisor. Use of this website is subject to its terms and conditions.