The stock market is now reaching its first short-term higher probability of a countertrend pullback.
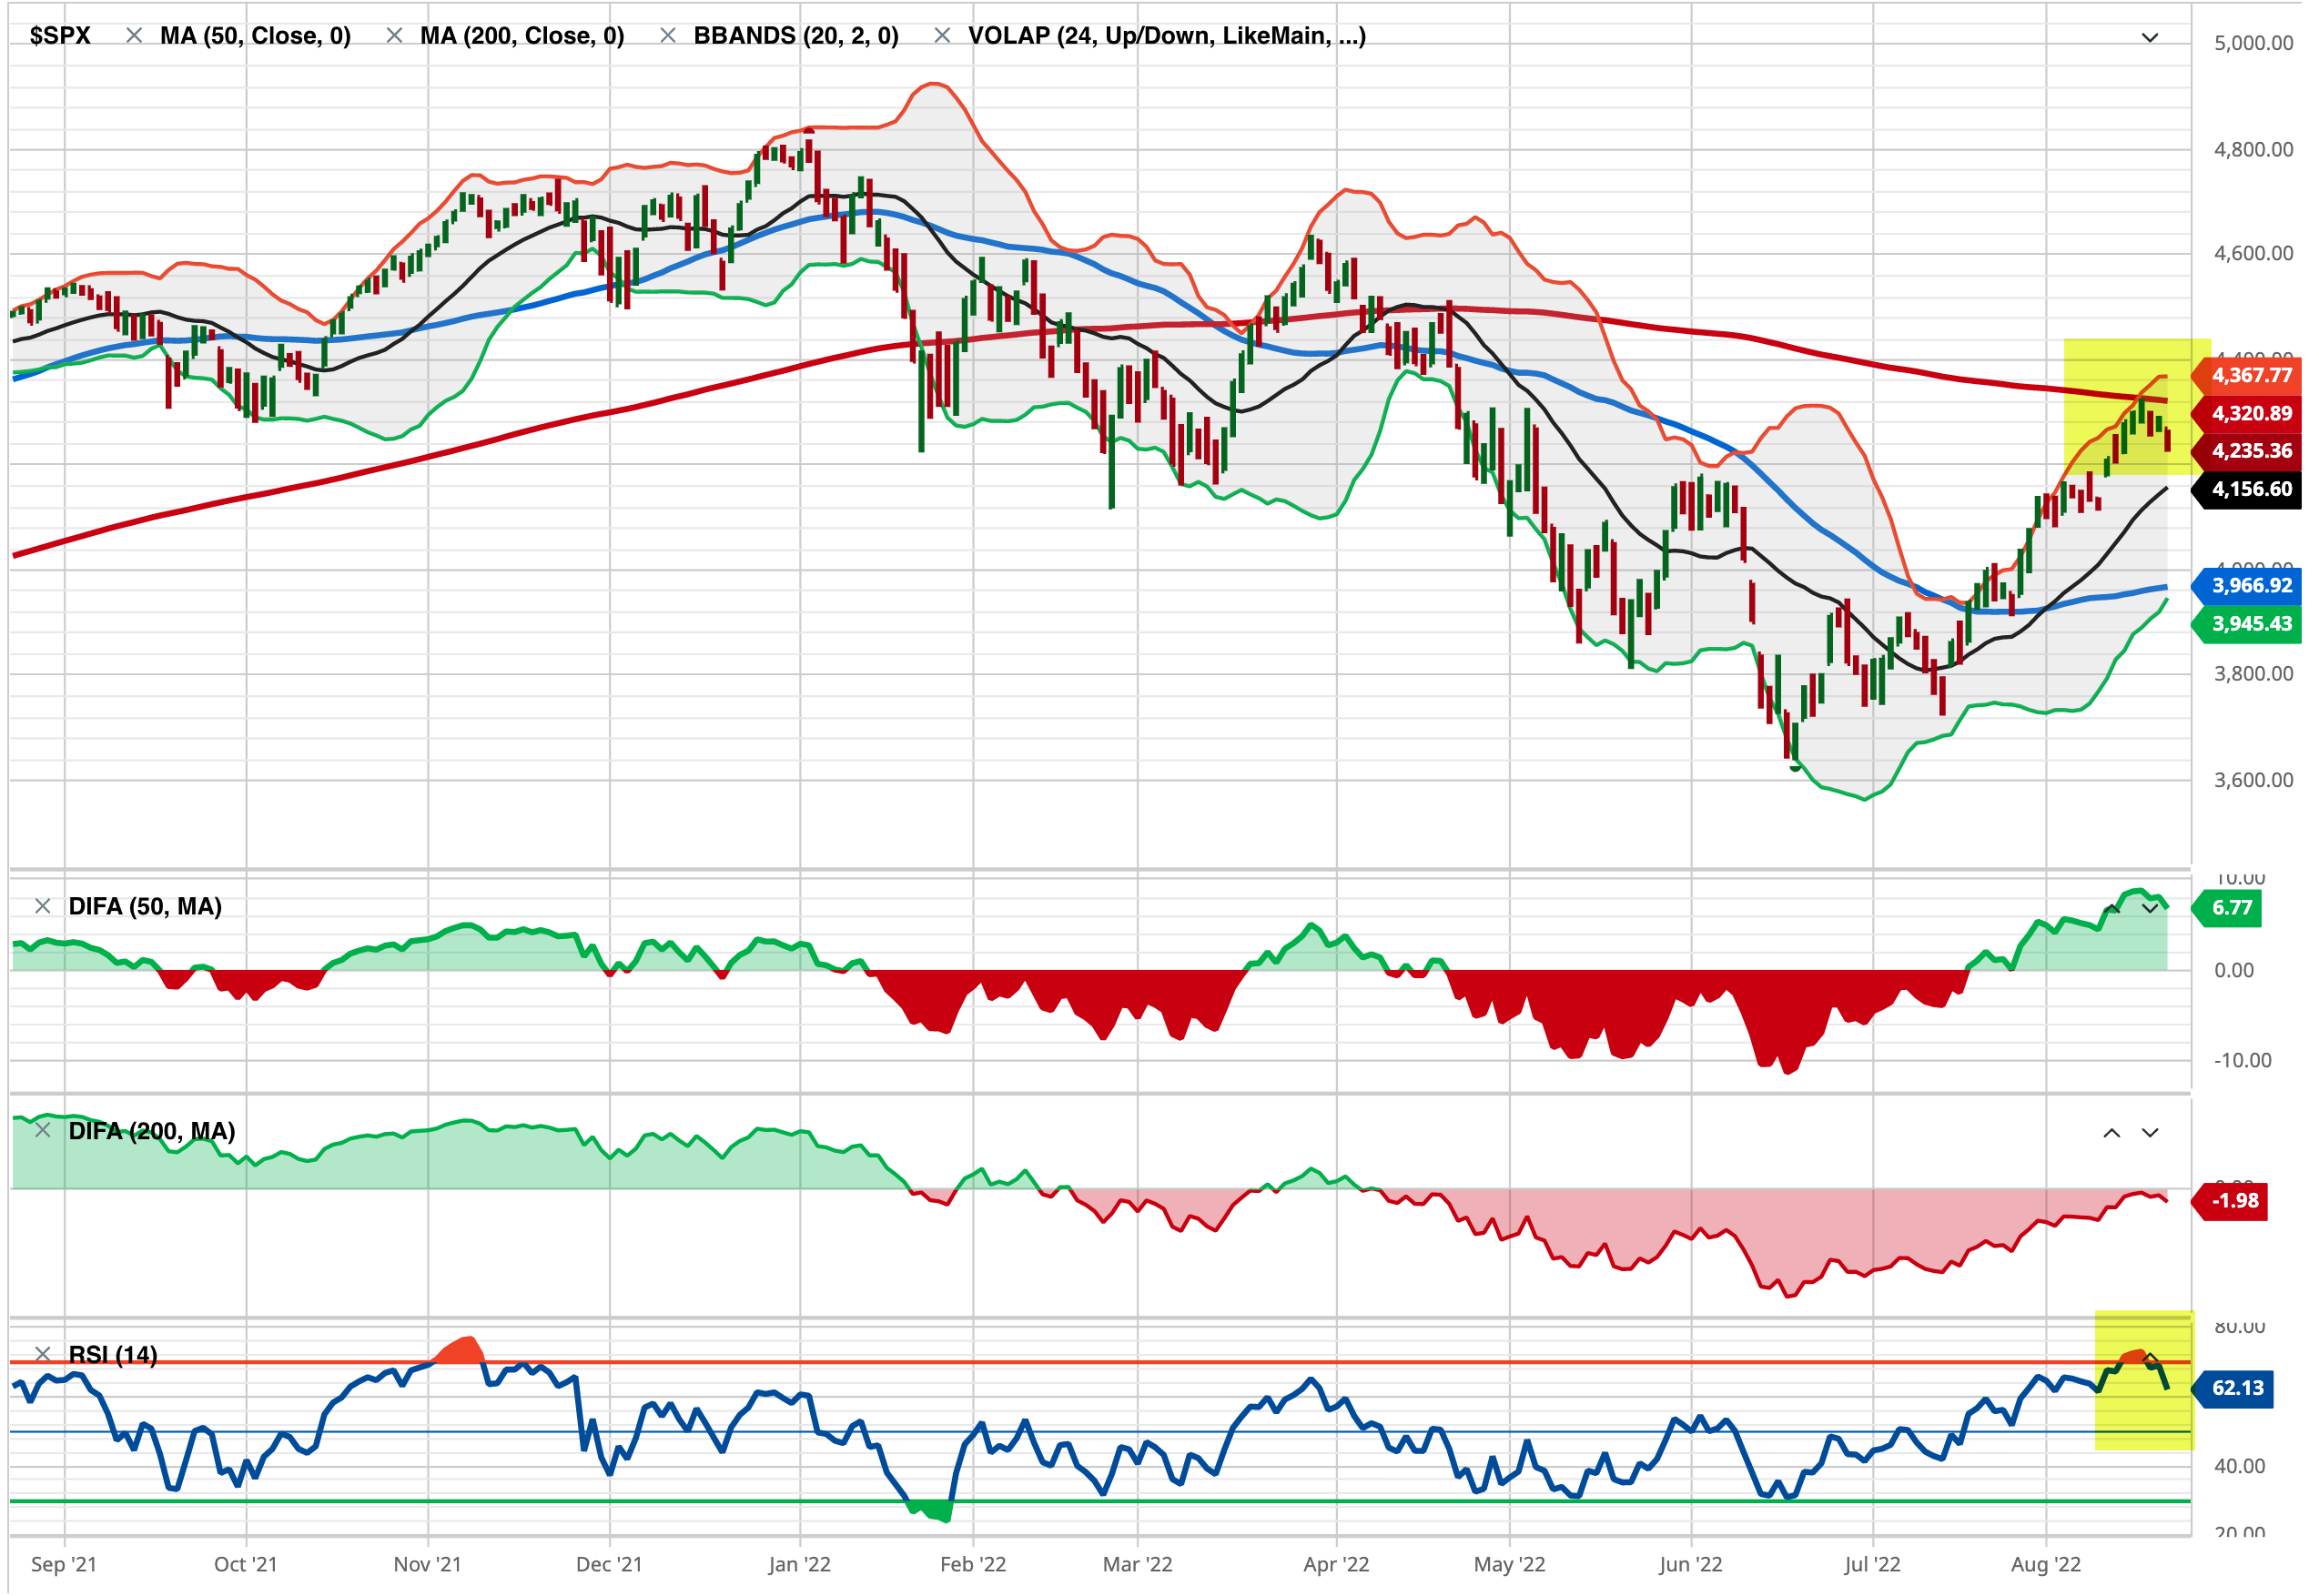
The S&P 500 stock index tapped its 200-day average and reached a short-term overbought level based on relative strength and volatility and is now stalling.
The S&P 500 Equal Weight, which gives an equal weighting to all 500 stocks instead of more exposure to the largest companies based on capitalization, crossed above its 200-day average but was reaching an overbought level at the same time.
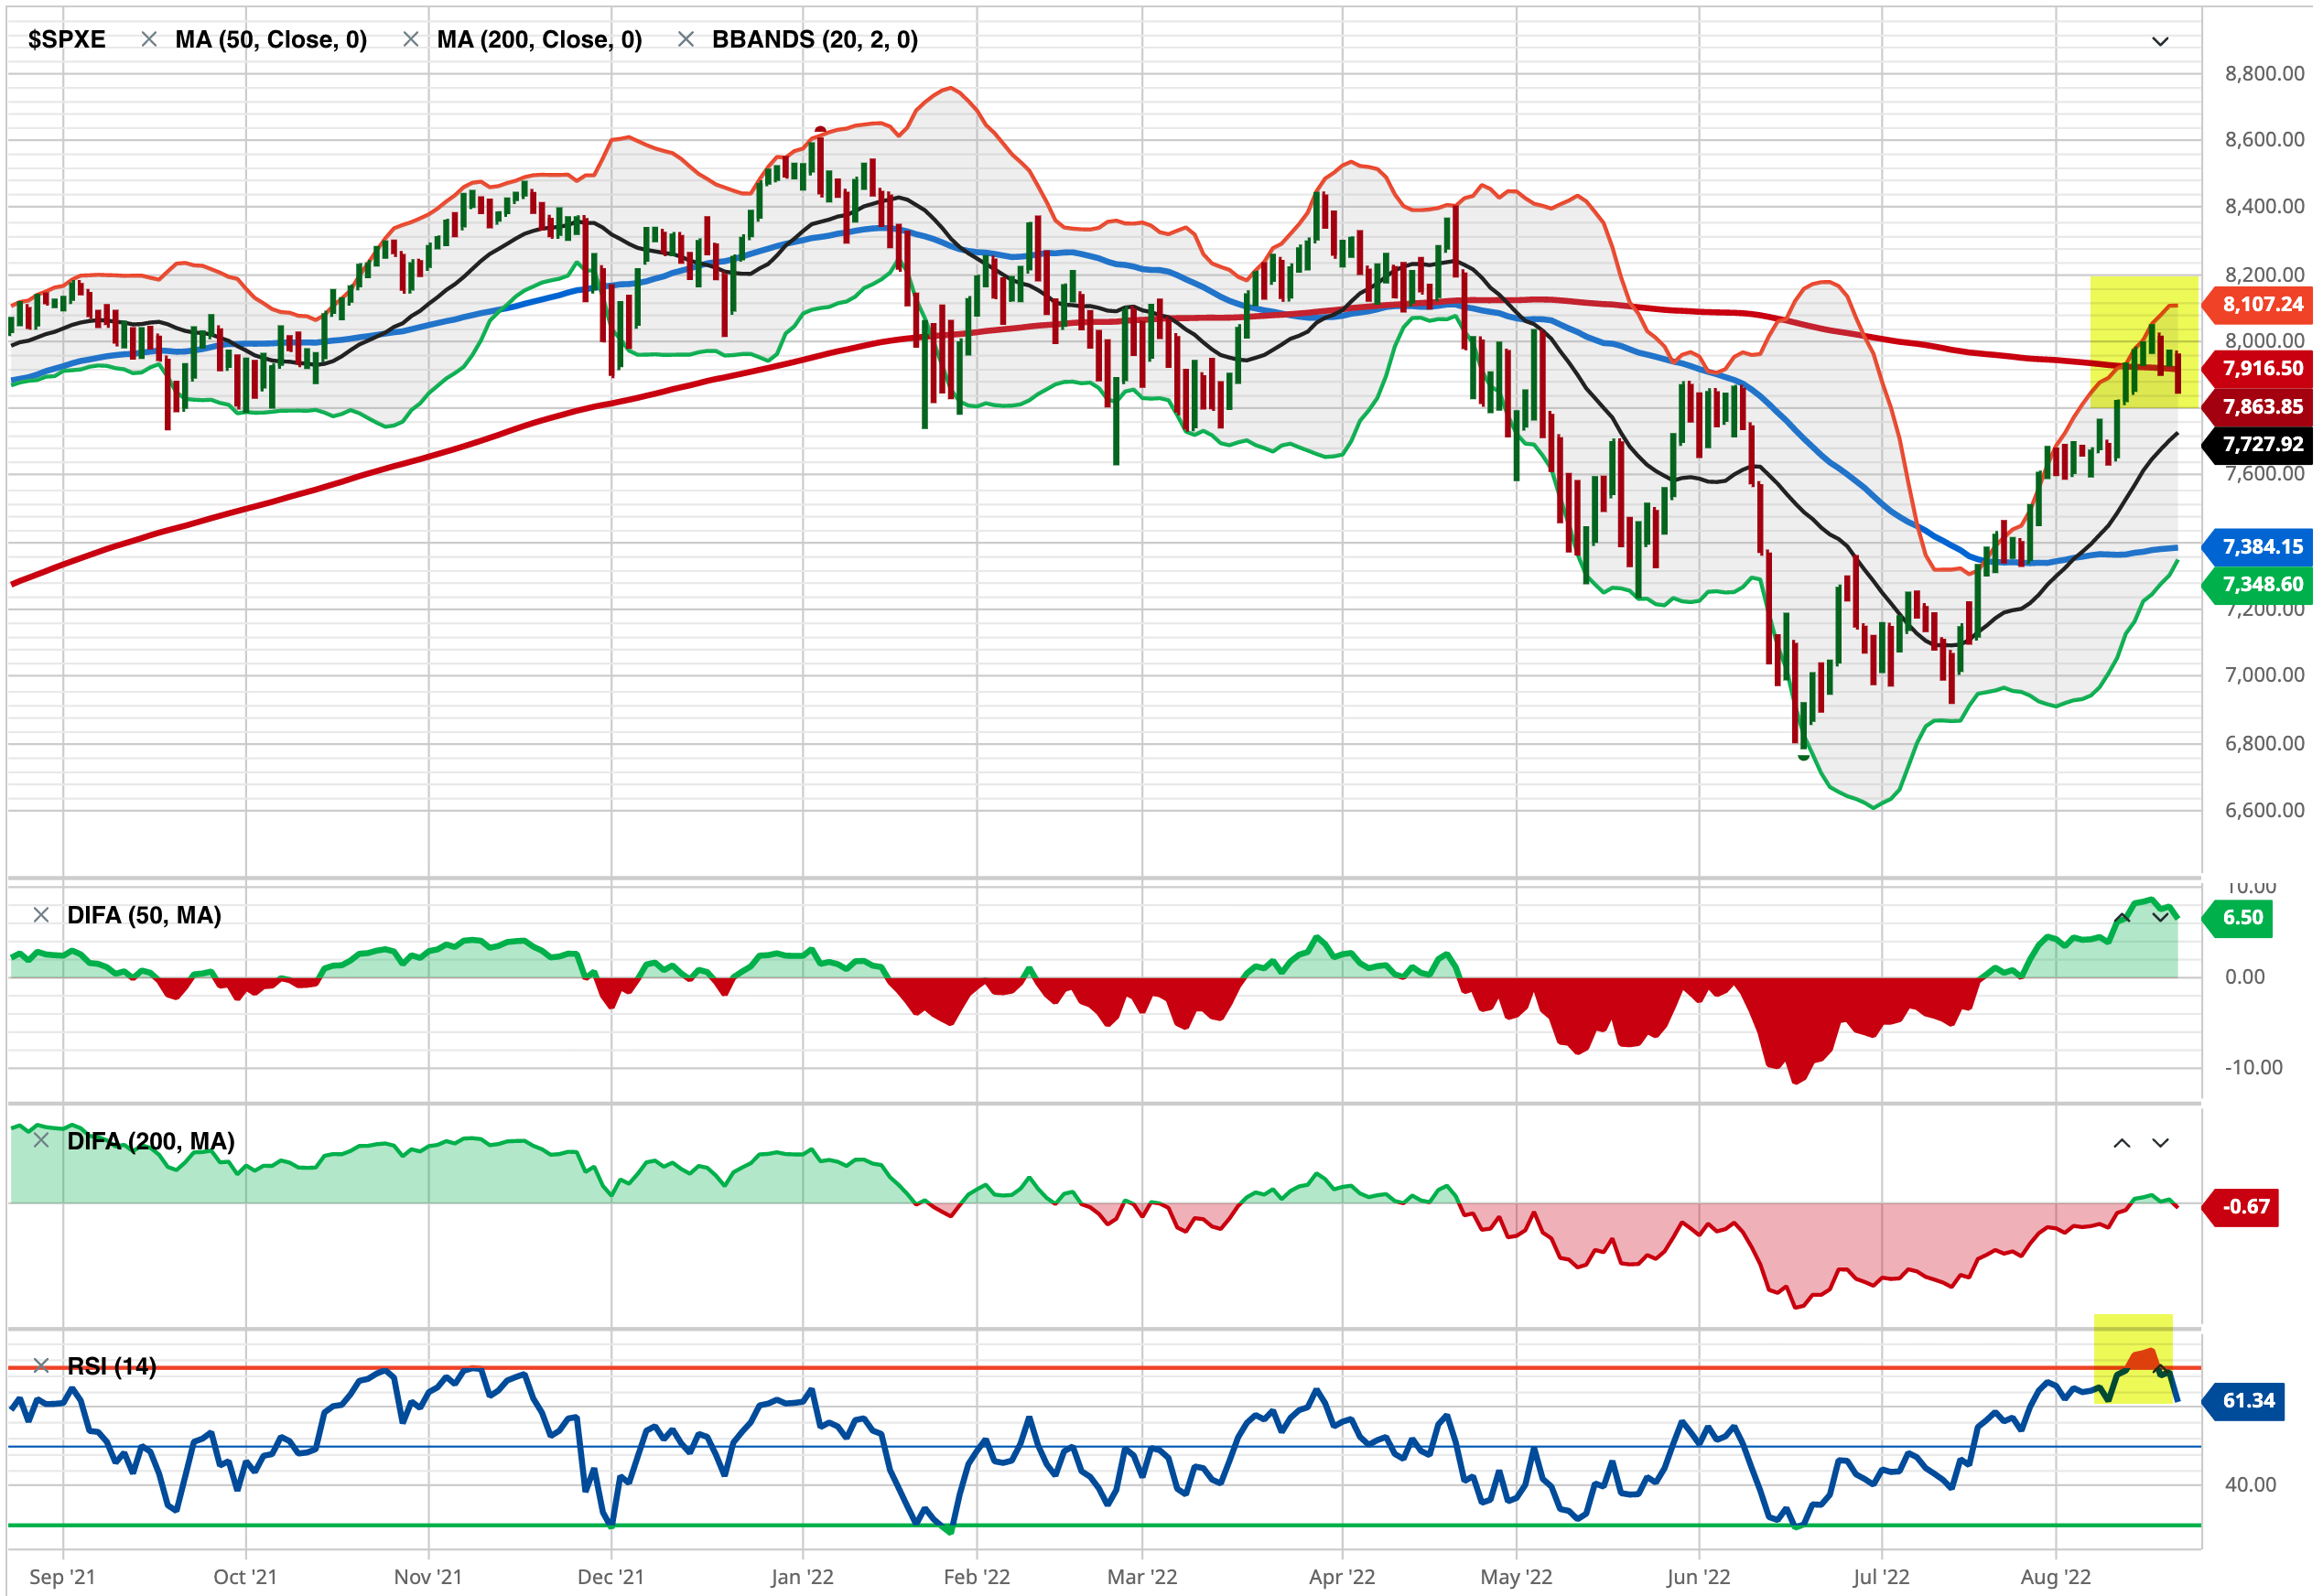
So, it’s not surprising to see these market proxies roll over at this level.
Two weeks ago I pointed out in The stock market is at an inflection point the S&P 500 was stalling as if there is resistance at this price level, and there’s a lot of potential supply for those in a loss trap, and it was getting overbought as measured by the relative strength index. The index trended up a few more percent before pulling back today.
I don’t normally trade the S&P 500 index, I just use it as a proxy for the overall stock market.
For portfolio management, I get more granular into the sectors inside, and the stocks.
I also include global markets like commodities, bonds, and other alternatives, to provide a global unconstrained opportunity set to find potentially profitable trends.
Trend systems just want to be fed some trends, so the system can extract the parts it wants from the parts it doesn’t want. It’s best to provide a wide range of uncorrelated price trends for trend systems to create a unique return stream from them.
From the broad index like the S&P 500 it’s useful to look inside to see the percentage of stocks that are trending above their 50-day and 200-day averages to gauge the strength of participation in the uptrend.
The percent of S&P 500 stocks trending above the 50-day average has quickly trended up to the red zone.

The breadth thrusts we’ve seen are typical of a new uptrend — unless* it’s a prolonged bear market. *IF this is the early stage of a prolonged bear market that is likely accompanied by a recession, then we’ll see many swings like this as it unfolds along the way.
However, once most stocks are already in uptrends, the enthusiasm to buy may have run out, so I consider the level above 80% to be a higher risk zone. If we are looking for a lower risk entry, it’s below 30%. A strong breadth thrust like this is bullish when it starts and is typical off the lows after stocks have already trended down as much as they have.
At this point, despite the S&P 500 being down 1.5% today, it appears to be a normal pullback from overbought levels. Our relative strength index signals the index was moving up with such velocity it was a little too far, too fast, which is good in the longer term but increased the odds of a retrench in the short term.
I reduced exposure earlier this week, and the price action next week will determine if we reduce further or buy the dip at lower prices.
In the big picture, we’re strolling into the seasonally weakest month for the stock market after a big rally and no shortage of risks to the short-term uptrend, so it’s essential to determine an exit, hedge, or reduce exposure.
On the positive side, the recent decline in volatility and new uptrends suggest systematic trend-following investment programs could provide inflows of several billion dollars a day in stocks for the next few months if it continues.
While everyone else is trying to figure out what’s going to happen next with inflation, rates, and other global macro issues, we focus on keeping our hard-earned capital invested in the direction of the trend.
If the trends change, so will we.
Mike Shell is the Founder and Chief Investment Officer of Shell Capital Management, LLC, and the portfolio manager of ASYMMETRY® Managed Portfolios. Mike Shell and Shell Capital Management, LLC is a registered investment advisor focused on asymmetric risk-reward and absolute return strategies and provides investment advice and portfolio management only to clients with a signed and executed investment management agreement. The observations shared on this website are for general information only and should not be construed as investment advice to buy or sell any security. This information does not suggest in any way that any graph, chart, or formula offered can solely guide an investor as to which securities to buy or sell, or when to buy or sell them. Securities reflected are not intended to represent any client holdings or recommendations made by the firm. In the event any past specific recommendations are referred to inadvertently, a list of all recommendations made by the company within at least the prior one-year period may be furnished upon request. It should not be assumed that recommendations made in the future will be profitable or will equal the performance of the securities on the list. Any opinions expressed may change as subsequent conditions change. Please do not make any investment decisions based on such information, as it is not advice and is subject to change without notice. Investing involves risk, including the potential loss of principal an investor must be willing to bear. Past performance is no guarantee of future results. All information and data are deemed reliable but are not guaranteed and should be independently verified. The presence of this website on the Internet shall in no direct or indirect way raise an implication that Shell Capital Management, LLC is offering to sell or soliciting to sell advisory services to residents of any state in which the firm is not registered as an investment advisor. The views and opinions expressed in ASYMMETRY® Observations are those of the authors and do not necessarily reflect the position of Shell Capital Management, LLC. The use of this website is subject to its terms and conditions.

You must be logged in to post a comment.