Trying not to sound like a broken record, I’ll share a few updates from what I said last in Observations of the stock market downtrend.
The stock market is at an inflection point. An inflection point is a time of meaningful change in a situation; a turning point. The reality is, there are many inflection points within market cycles and price trends. So, we observe different inflection points across different time frames. For those who watch the stock market daily as a professional portfolio manager, we observe every move. But, the overall focus needs to be on the bigger trends. Every market cycle and price trend is made up of smaller cycles as prices swing up and down on their way to forming a directional trend. Market cycles don’t trend straight up or down.
The U.S stock indexes have dropped about -10% in October, giving up gains for the year. Many investors probably believe October is historically the worst month of the year for the stock market because of famous October declines. September is actually the worst month historically, but October is historically a volatile month. It just so happens, this decline occurred inside of October.
I don’t use seasonality as a signal for my decisions, but we’ve all heard of “sell in May and go away.” The period from May through October is supposed to be the weak season and November to April is the stronger season for stocks. The S&P 500 had defied the expectation that stocks would be weak last summer and gained nearly 10% from May through September, then lost the gain in October. Many leading growth stocks that previously showed the strongest momentum declined even more than the stock indexes. I pointed out a few months ago that international stock indexes including both emerging and developed countries were already in downtrends. So, the global equity markets were generally down in October.
That’s the bad news for anyone invested in these markets.
The good news is after those who wanted to sell have sold, prices eventually reach a low enough point to attract new buying interest.
I focus on what the price trends are actually doing, so I’ll share my observations of the trends and update some sentiment and breadth indicators I’ve discussed in previous observations.
First, we look at what the price trend is actually doing. Below is the S&P 500 stock index year-to-date. We see after declining about -10% from its September high, the stock index has reversed back up to the price of the prior low on October 11th.
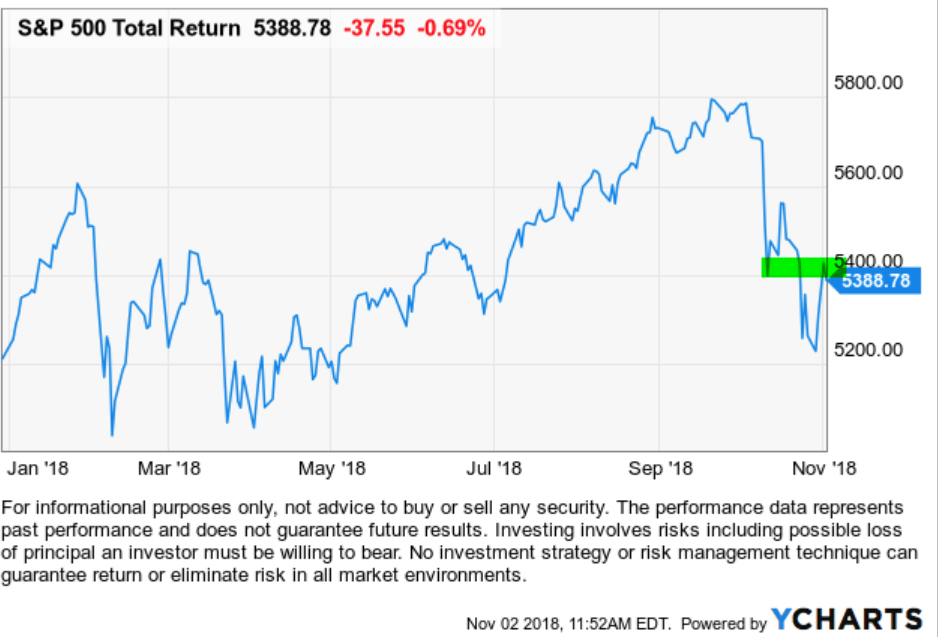
In technical analysis of price trends, we say “prior support may become resistance” and that may be what happens next. We shouldn’t expect prices to trend straight up or down, they swing up and down. Prices making higher highs and higher lows form uptrends or lower lows and lower highs form downtrends. So, it wouldn’t be abnormal to see the stock index trend back down to the low again, or it could pause and continue the recent upward direction.
For a sustained move higher, those who want to sell need to have sold and prices need to have reached a low enough point to attract new buying demand.
Have those who want to sell, sold?
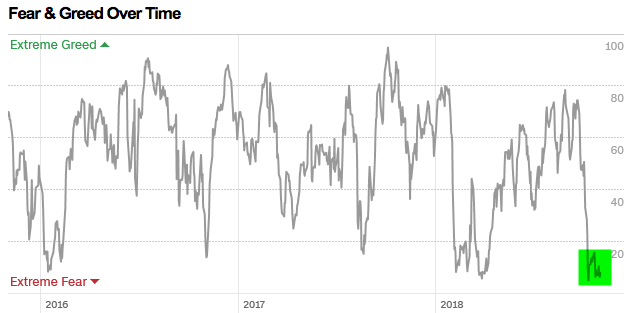
To get an idea for observation of investor sentiment, we can look at a few simple indicators. I explained the thinking behind the Fear & Greed Index in Observations of the stock market downtrend.
The Fear & Greed Index is based on 7 indicators of investors sentiment and can be a useful gauge to help investors keep their own sentiment in check. It currently remains at an “Extreme Fear” level, which is typical after a stock market decline and a high level of bearish sentiment that has historically preceded stock prices reversing back up- as those who want to sell have sold. However, in a prolonged bear market, this oscillating indicator could stay low for a long time or it could swing up and down along with price trends.
But, nothing illustrates buying and selling, supply and demand, better than the actual price trends. Another interesting indicator I’ve shared in recent observations is the percent of stocks in the S&P 500 that are trading above their short-term moving average.

It shows us how many stocks have participated in an uptrend or downtrend. When it reaches a high point and most stocks have participated in an uptrend, it may be nearer a reversal back down. Price trends don’t move straight up. When it reaches a low level is indicates most stocks have declined and at an extreme, it can suggest capitulation – those who want to sell may have sold. But, prices don’t trend straight down. Prices swing up and down along the way to drifting directionally. At this point, this indicator has reached the February and April lows and reversed up.
Shorter term, it’s an inflection point as I highlighted. If more stocks trend back up, we’ll see this trend higher.
Let’s see how it all unfolds…
Mike Shell is the Founder and Chief Investment Officer of Shell Capital Management, LLC, and the portfolio manager of ASYMMETRY® Global Tactical.
The observations shared on this website are for general information only and are not specific advice, research, or buy or sell recommendations for any individual. Investing involves risk including the potential loss of principal an investor must be willing to bear. Past performance is no guarantee of future results. The presence of this website on the Internet shall in no direct or indirect way raise an implication that Shell Capital Management, LLC is offering to sell or soliciting to sell advisory services to residents of any state in which the firm is not registered as an investment advisor. Use of this website is subject to its terms and conditions.

Pingback: To Know Where You’re Going, Look at Where You’ve Been: The 2018 Year in Review « ASYMMETRY® Observations