ASYMMETRY® Observations are Mike Shell’s observations of investor behavior causing directional price trends, global macro, tactical ETF trading, momentum stock trading, hedging, volatility trading, and risk management that creates asymmetric investment returns. An asymmetric return profile is a risk/reward profile with a positive asymmetry between profit and loss. Mike Shell is the founder of Shell Capital Management, LLC and the portfolio manager of ASYMMETRY® Global Tactical
Category Archives: Essence of Portfolio Management
“The trend is your friend, until the end when it bends.”
Stock indexes making higher highs and higher lows is a good thing – until it isn’t.
I run a combination of systems. Most of them are trend following in nature, meaning the objective is to enter a trend early in its stage to capitalize on it until it changes.
But when trends reach an extreme it’s time to take note.
For me, what follows is what I consider market analysis, which doesn’t necessarily result in an specific trades, per se, but instead, it’s my intellectual exercise to understand what’s going on. And it’s nice to have an idea of when a trend may be ready to change.
In law,weight of evidence “refers to the measure of credible proof on one side of a dispute as compared with the credible proof on the other.
It is the probative evidence considered by a judge or jury during a trial.
In this case, the jury are active investors in the market.
Probative evidence is having the effect of proof, tending to prove, or actually proving. So, when a legal controversy goes to trial, the parties seek to prove their cases by the introduction of evidence. If so, the evidence is deemed probative.
Probativeevidence establishes or contributes to proof.
The weight of evidence, then, is based on the believability or persuasiveness of evidence.
Since we never know the future in advance, when we engage in market analysis, we necessarily have to apply the weight of the evidence to establish the probability.
After monitoring price trends and a range of indicators intended to measure the strength of a trend for more than two decades, I’ve got a feel for the weight of the evidence. So, my confidence in these observations has increased over time, even as imperfect as it is.
Let’s see some evidence to weight.
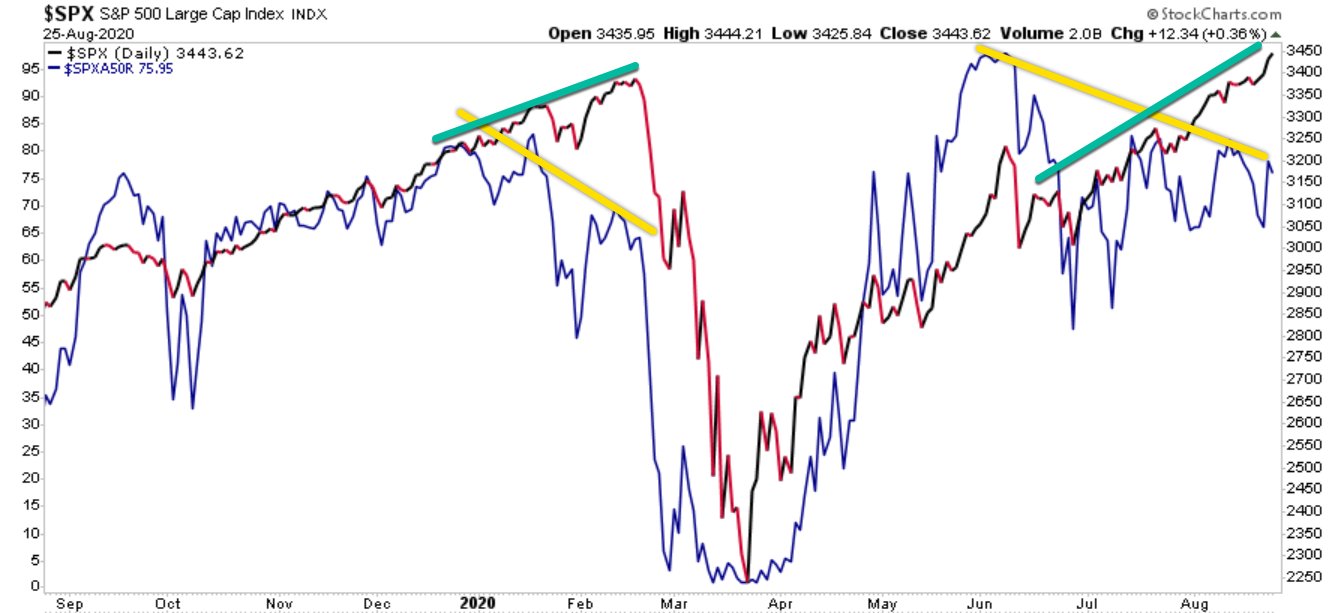
By the first of June, 98% of the S&P 500 stocks were trending up, above their short term trend 50 day moving average. Since then, we’ve seen some divergence between the stocks in an uptrend and the stock index.
It tells us fewer stocks are participating in the uptrend.
The advantage of monitoring breadth measures like % of stocks above a moving average or bullish percent is it’s a high level barometer that may highlight what is changing. Sometimes, it’s what is diverging.
In this case, the price trend of the stock index is diverging with the percent of stocks in a positive trend.
One of the warning signs in January and February was this same divergence between the uptrend in $SPY and the breadth of participation of the individual stocks in the index.
When I see divergence, it reminds me to look inside to see what has changed.
It’s usually explained by sector rotation.
For example, over the past month, Technology and Communications have shown relative strength, but the momentum in Consumer Discretionary and Utilities are the laggards.
As a new trend gets underway, some of the component sectors within the S&P 500 diverge, so we also see it show up in the percent of stocks trending up vs. down.
After watching quantitive technical indicators like this since the 90s, I can also tell you we commonly see a breadth thrust in the early stages of a new uptrend. We did in January to February 2019 after the waterfall decline at the end of 2018.
A breadth thrust is bullish confirmation.
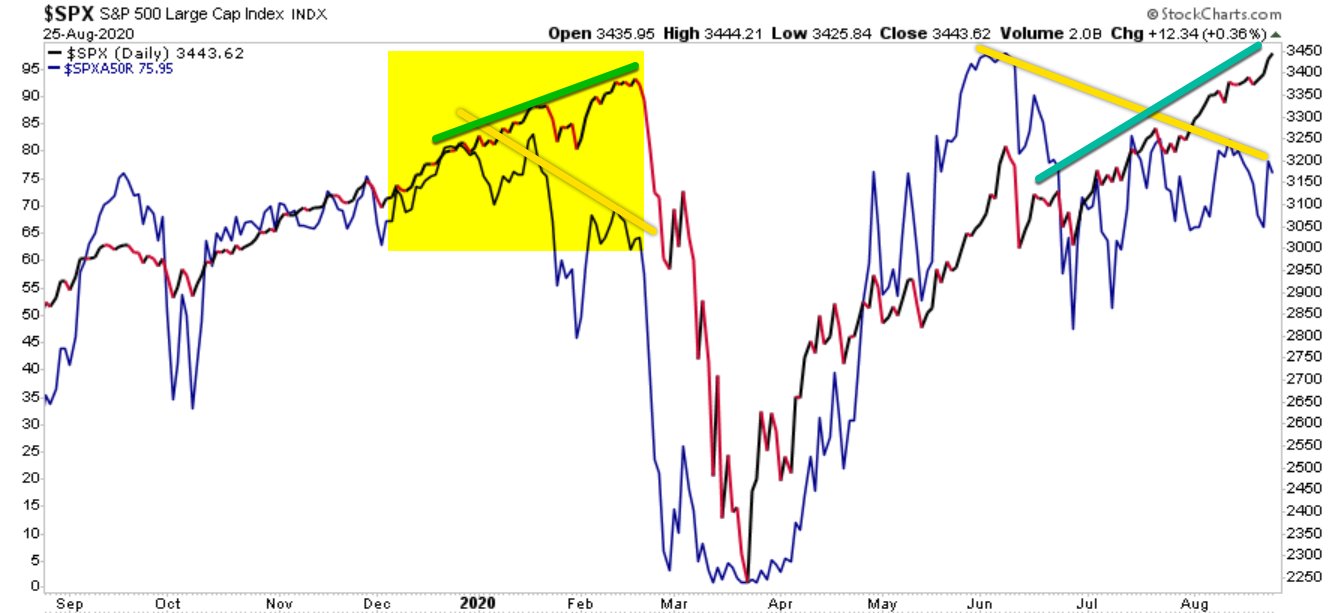
How long the trend may last, well, we’ve always preferred to see more stocks parts-cation in an uptrend than less. The theory is a broad uptrend that lifts all boats has more true momentum. An example of elevated breadth was 2017, when the stock index trended up with very little volatility or setbacks.
But if you look real close, that yellow highlight of 2017 also shows the percent of stocks above their 50 day moving average oscillated between the 50 and 95% zone throughout the year. It’s an oscillator, so it swings between 0% and 100%, but the fact it stayed above 50% in 2017 was a signal of internal strength. It often swings wider in a typical year, but 2017 was far from typical.
The bottom line is, what we have here, now, is fewer of the S&P 500 stocks trending up, which means more are crossing down below their intermediate trend trend line.
So, my interpretation is the trends are weakening, and it’s likely to be more reflected in the stock index eventually.
Investor sentiment is another essential measure.
Nothing drives investor sentiment like a price trend. As prices trend up, people get more bullish (or greedy) and as prices trend down, they feel more fear (of losing more money.)
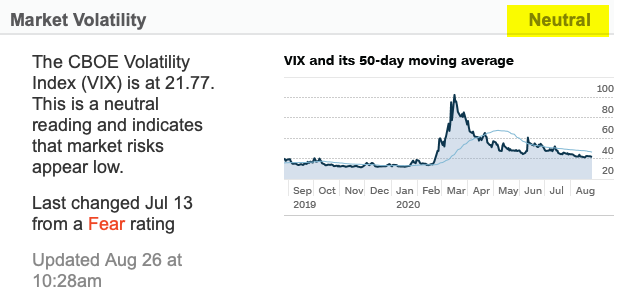
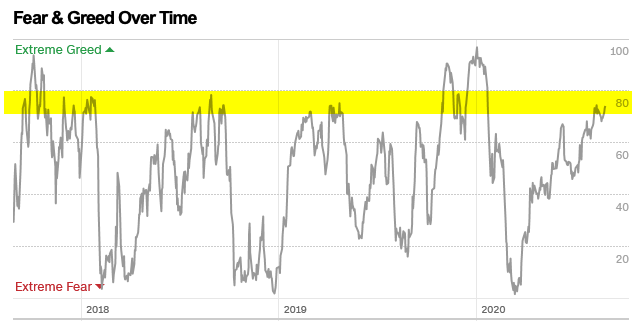
The Fear & Greed Index tracks seven indicators of investor sentiment. It’s gradually dialing back up to Greed, but not yet Extreme Greed.
But when we take a look inside, and understand how it works, I see the main holdout is VIX . At around 22, the VIX still indicates a moderate level of FEAR, but we have to consider VIX is fading from its highest level, ever, so its absolute level may not be as indicative.
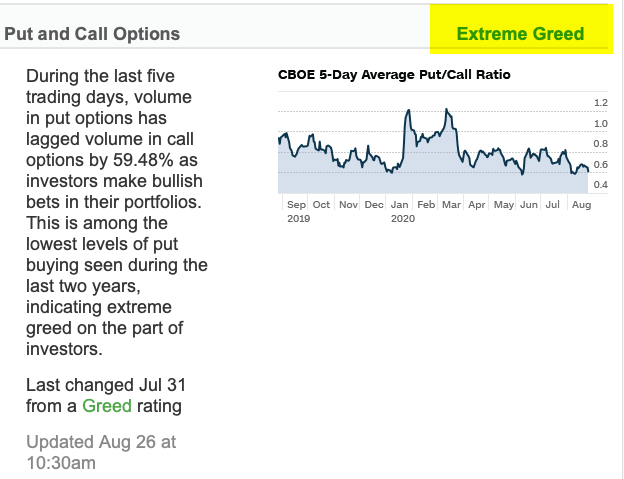
On the other hand, the level of the Put/Call Ratio is among the lowest levels of put buying seen during the last two years, indicating EXTREME GREED on the part of investors.
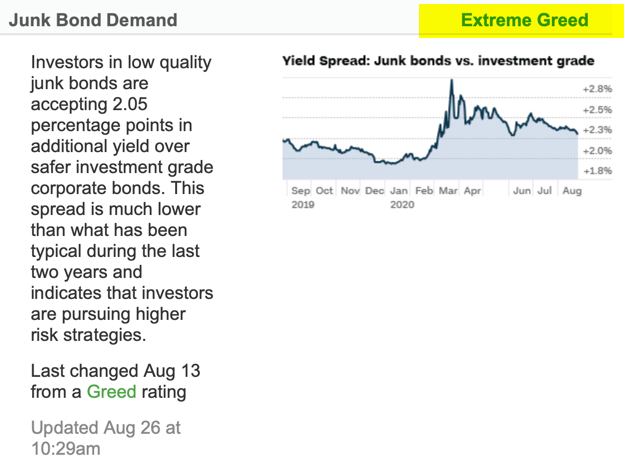
Junk Bond Demand has reached EXTREME GREED. Investors in junk bonds are accepting 2.05% in additional yield over safer investment grade bonds. This spread is much lower than what has been typical during the last two years and indicates that investors are pursuing higher risk strategies.
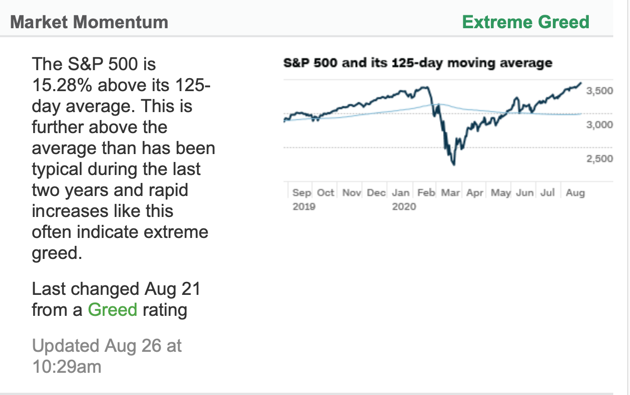
The 3rd EXTREME GREED indicator is the S&P 500 is 15.28% above its 125-day average. This is further above the average than has been typical during the last two years and rapid increases like this often indicate extreme greed, according to the Fear & Greed Indicator.
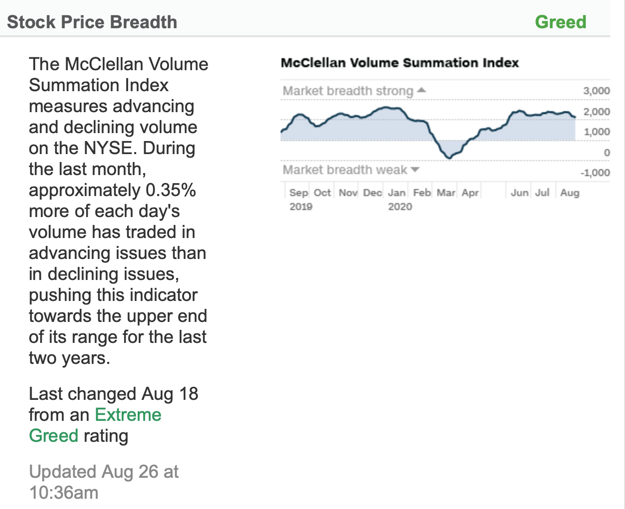
Aside from neutral $VIX, some other moderate hold outs of the 7 indicators include breadth. The Fear & Greed Indicator uses the McClellan Volume Summation Index, which measures advancing and declining volume on the NYSE. It has fallen from EXTREME GREED just over a week ago.
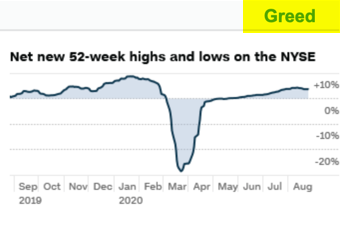
Stock Price Strength is another moderate GREED level. It says the number of stocks hitting 52-week highs exceeds the number hitting lows and is at the upper end of its range, indicating greed.
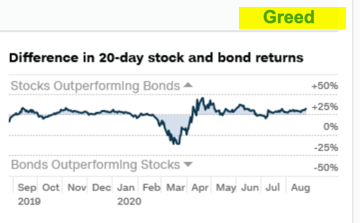
Safe Haven Demand is at a bullish investor sentiment level. Stocks have outperformed bonds by 6.87% during the last 20 trading days, close to the strongest performance for stocks/bonds in the past 2 years – investors are rotating into stocks from the relative safety of bonds.
THE BOTTOM LINE IS: The seven indications of investor sentiment are dialing up to a very optimistic level, signaling investors are bullish on stocks.
Though some of it isn’t yet extreme, when we put it in context, anything can happen from here, but its now at a higher risk zone.
Another measure of investor sentiment is put volume. Puts are listed options on stocks and indexes that may be used to hedge the downside. The CBOE Total Put Volume is at the lowest level this year, which suggests there isn’t a lot of hedging taking place.
The NAAIM Exposure Index represents the average exposure to US Equity markets reported by the members of the National Association of Active Investment Managers. They are fully invested for the first time since December. Their exposure to the stock market has followed the trend of the stock index.
Another sentiment poll is the Advisors Sentiment, which was devised by Abe Cohen of Chartcraft in 1963 and is still operated by Chartcraft, now under their brand name of Investors Intelligence. This survey has been widely adopted by the investment community as a contrarian indicator. They say since its inception in 1963, the indicator has a consistent record for predicting the major market turning points. It has reached that point.
Speaking of Abe Cohen, another indicator he developed in the mid 1950s is the Bullish Percent Index. He originally applied it to stocks listed on the NYSE, but we have been doing the same for other listed stocks and sectors since. The NYSE Bullish Percent is an example of another gauge of overall market risk. A common analogy applied to the NYSE Bullish Percent is that of a football game: level of the bullish % represents the current field position and the “end-zones” are above 70% and below 30%.
Currently, at 70%, it has entered the higher risk zone, suggesting it’s time to put the defensive team on the field.
Many of these indicators are measuring the same thing; investor sentiment.
After everyone has already gotten bullish and put their money to work in stocks, we have to wonder where future demand for shares will come from.
It’s been a nice run, but stars are aligning to look more and more bearish in my opinion. Uptrends are great, but all good things eventually come to an end.
If we want to protect our profits, it is probably time to reduce expose or hedge.
And that’s likely right about the time most people are excited about their stocks and wanting to buy more.
What could go wrong?
As of this writing, we have a CAT 4 hurricane just hours from hitting Texas and Louisiana, the Fed meeting tomorrow, and China firing missiles into disputed sea.
That’s the weight of the evidence as I see it.
You can be the judge if the evidence is believable and persuasiveness enough, but the final arbiter will be the price trend in the coming weeks.
Mike Shell is the Founder and Chief Investment Officer of Shell Capital Management, LLC, and the portfolio manager of ASYMMETRY® Global Tactical. Mike Shell and Shell Capital Management, LLC is a registered investment advisor focused on asymmetric risk-reward and absolute return strategies and provides investment advice and portfolio management only to clients with a signed and executed investment management agreement. The observations shared on this website are for general information only and should not be construed as advice to buy or sell any security. Securities reflected are not intended to represent any client holdings or any recommendations made by the firm. Any opinions expressed may change as subsequent conditions change. Do not make any investment decisions based on such information as it is subject to change. Investing involves risk, including the potential loss of principal an investor must be willing to bear. Past performance is no guarantee of future results. All information and data are deemed reliable but is not guaranteed and should be independently verified. The presence of this website on the Internet shall in no direct or indirect way raise an implication that Shell Capital Management, LLC is offering to sell or soliciting to sell advisory services to residents of any state in which the firm is not registered as an investment advisor. The views and opinions expressed in ASYMMETRY® Observations are those of the authors and do not necessarily reflect a position of Shell Capital Management, LLC. The use of this website is subject to its terms and conditions.
In the final stages of a bull market, we normally see a parabolic move to the upside, a final blowoff that gets in the last investors. Buying demand is the response of investor euphoria like I pointed out last week.
An indication of a parabolic move is seen in price channels and confirmed with momentum oscillators. Only time will tell if this is it, but in the chart, I highlight the S&P 500 stock index broke out above an upper moving average channel.
Price trends usually peak with volatile swings up and down before a larger leg down. Some swing tighter than others, but there is normally a period of “indecision” that precedes an intermediate trend change or drawdown. A drawdown is a decline in the value of an investment or market below its all-time high. Below is the period leading up to the -15% drawdown in the stock index late 2015 – 2016. In the green box, I show the price trend entered a period of swings up and down before breaking an upward trend, drifting more sideways, then a-15% decline.
Next is the swings in the S&P 500 entered into what became a -18% decline in 2011. My point here is that larger legs down don’t necessarily happen all at once, there are indecisive swings that eventually fall apart.
The top in 2007 presented much larger swings and of course ended up declining -56% over nearly two years afterward. I believe these swings up and down before a larger trend unfolds is indecision among traders and investors. Again, my point here is that larger legs down don’t necessarily happen all at once, we instead observe indecisive swings that eventually fall apart.
Lastly, here is the 1999 – 2000 peak that also presented wings like the previous peaks. The stock market trend broke above a simple channel a few times before entering a -50% bear market.
The current trend just recently stretched above the channel and at the same time, was very overbought for months as measured by the momentum oscillators. This happened at the same time bullish investor sentiment measures was reaching record highs and volatility at historical lows. However, as seen in observations above, the U.S. stock market could just now be entering into a phase of swings up and down that could last for months or years, or it could fall apart sooner. Either way, I make this point for situational awareness.
As a portfolio manager, I don’t need to know for sure what’s going to happen next. I just know what I’ll do next as trends unfold.
Only time will tell if this is the early stages of an end of an aged bull market or just an interruption of a euphoric “melt up”. We don’t need to know when a major top is in. It doesn’t require an ON/OFF switch. When a big bear market does come, it will be made up of many swings up and down along the way over many months. People will crave to be in, out, in out, in, out, as it all unfolds. Adaptability is essential: the consistent willingness and ability to alter attitudes, thoughts, and behaviors to appropriately respond to actual or anticipated change in the environment.
Clearly, it’s the swings we have to be prepared for… if we want to avoid a loss trap. In a loss trap, investors get caught in a loss and have a hard time getting out. When they lose more than they can afford or more than their risk tolerance, they are prone to tap out after large declines. To avoid the loss trap, know your risk tolerance and actively manage risk within that tolerance.
The observations shared on this website are for general information only and are not specific advice, research, or buy or sell recommendations for any individual. Investing involves risk including the potential loss of principal an investor must be willing to bear. Past performance is no guarantee of future results. The presence of this website on the Internet shall in no direct or indirect way raise an implication that Shell Capital Management, LLC is offering to sell or soliciting to sell advisory services to residents of any state in which the firm is not registered as an investment advisor. Use of this website is subject to its terms and conditions.
“The essence of investment management is the management of risks, not the management of returns. Well-managed portfolios start with this precept.”
– Benjamin Graham
The problem is many portfolio managers believe they manage risk through their investment selection. That is, they believe their rotation from one seemingly risky position to another they believe is less risk is a reduction in risk. But, the risk is the exposure to the chance of a loss. The exposure is still there. Only the perception has changed: they just believe their risk is less. For example, for the last thirty years, the primary price trend for bonds has been up because interest rates have been falling. If a portfolio manager shifts from stocks to bonds when stocks are falling, bonds would often be rising. It appears that trend may be changing at some point. Portfolio managers who have relied on bonds as their safe haven may rotate out of stocks into bonds and then their bonds lose money too. That’s not risk management.
They don’t know in advance if the position they rotate to will result in a lower possibility of loss. Before 2008, American International Group (AIG) carried the highest rating for an insurance company. What if they rotated to AIG? Or to any of the other banks? Many investors believed those banks were great values as their prices were falling. They instead fell even more. It has taken them a long time to recover some of their losses. Just like tech and telecom stocks in 2000.
All risks cannot be hedged away if you pursue a profit. If you leave no chance at all for a potential profit, you earn nothing for that certainty. The risk is exposure to an unknown outcome that could result in a loss. If there is no exposure or uncertainty, there is no risk. The only way to manage risk is to increase and decrease the exposure to the possibility of loss. That means buying and selling (or hedging). When you hear someone speaking otherwise, they are not talking of active risk management. For example, asset allocation and Modern Portfolio Theory is not active risk management. The exposure to loss remains. They just shift their risk to more things. Those markets can all fall together, as they do in real bear markets.
“I like analogies. And one of the analogies in 2008 brings to me it’s like a sailor setting his course on a sea. He’s got a great sonar system, he’s got great maps and charts and he’s perhaps got a great GPS so he knows exactly where he is. He knows what’s ahead of him in the ocean but his heads down and he’s not seeing these awesomely black storm clouds building up on the horizon are about to come over top of him. Some of those managers we did not stay with. Managers who saw that, who changed course, trimmed their exposure, or sailed to safer territory. One, they survived; they truly preserved capital in difficult times and my benchmark for preserving capital is you had less than a double-digit loss in 08, you get to claim you preserved capital. I’ve heard people who’ve lost as much as 25% of investor capital argue that they preserved capital… but I don’t believe you can claim that.Understanding how a manager managed and was nimble during a period of time it gives me great comfort, a higher level of comfort, on what a manager may do in the next difficult period. So again it’s a it’s a very qualitative sort of trying to come to an understanding of what happened… and then make our best guess what we anticipate may happen next time.”
I made bold the parts I think are essential.
If you are like-minded and believe what we believe, contact us.


You must be logged in to post a comment.