Volatility is a measure of the frequency and magnitude of price swings up and down in a market or stock over a period of time.
- Lower volatility is when prices are calmer and don’t swing up and down as much.
- Higher volatility is when price movement spreads out, and prices swing up and down in a wider range.
We can measure volatility using two general methods:
- Realized Volatility: based on actual historical price data. For example, we can see realized volatility by looking at historical standard deviation or average true range.
- Implied Volatility: is a measure of expected future volatility that is implied by option prices. For example, the VIX Index is a measure of expected future volatility.
The VIX Index measures the market’s expected future volatility based on options of the stocks in the S&P 500® Index. The VIX Index estimates expected volatility by aggregating the weighted prices of S&P 500 Index put and call options over a range of strike prices.
The last observation I shared of the trend and level of VIX was VIX Trends Up 9th Biggest 1-day Move. I pointed out the VIX level had been very low, and it was an observation of complacency. The VIX spiked up nearly 300% – a volatility expansion. Actually, we could call it a volatility explosion.
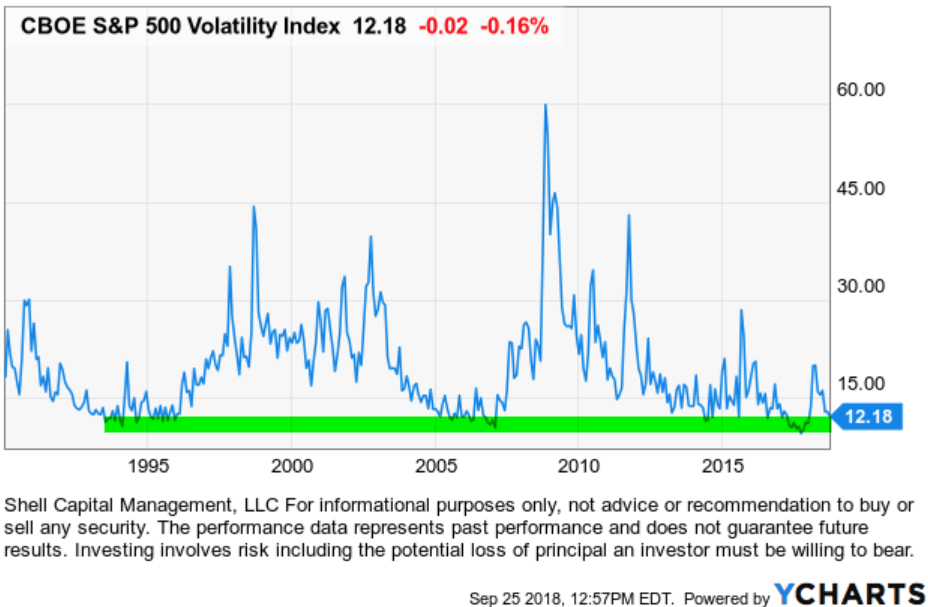
The current level of the VIX index has settled down to a lower historical level suggesting the market expects the future range of the price of the S&P 500 to be lower. Below is the current level relative to the past year.

Looking at the current level of 12 compared to history going back to its inception in 1993, we observe its level is indeed near its lowest historical low.
The VIX Index is intended to provide a real-time measure of how much the market expects the S&P 500 Index to fluctuate over the next 30 days. The VIX Index reflects the actual order flow of traders.
Since investors tend to extrapolate the recent past into the future, they usually expect recent calm markets to continue and violent swings to persist.
After the stock market declines and volatility expands, investors extrapolate that recent experience into the future and expect volatility to continue. Sometimes it does continue, but this time it gradually declined as the price trend became calmer.
When markets have been calm, traders and investors expect volatility to remain low. Before February, the VIX implied volatility had correctly predicted low realized volatility for months. But, both realized and expected volatility was so low that many investors were shocked when stock prices fell sharply, and volatility expanded.
When the market expects volatility to be low in the next 30 days, I know it could be right for some time. But, when it gets to its historically lowest levels, it raises situational awareness that a countertrend could be near. It’s just a warning shot across the bow suggesting we hedge what we want to hedge and be sure our risk levels are appropriate.
Mike Shell is the Founder and Chief Investment Officer of Shell Capital Management, LLC, and the portfolio manager of ASYMMETRY® Global Tactical.
You can follow ASYMMETRY® Observations by click on on “Get Updates by Email” on the top right or follow us on Twitter.
The observations shared in this material are for general information only and are not intended to provide specific advice or recommendations for any individual. Investing involves risk including the potential loss of principal an investor must be willing to bear. Past performance is no guarantee of future results.

Pingback: The stock market trends up with momentum « ASYMMETRY® Observations