Asymmetric Risks of Momentum Strategies

Asymmetric Risk

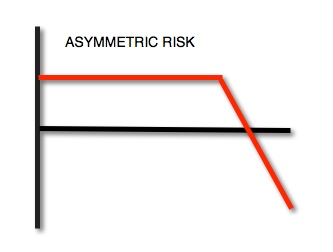
Asymmetric Risks of Momentum Strategies is another attempt to explain the excess returns of momentum using the Capital Asset Pricing Model. The paper discusses a theory of risk asymmetry in momentum risk/reward, but not how to gain an edge from it.

Abstract:

I provide a novel risk-based explanation for the profitability of global momentum strategies. I show that the performance of past winners and losers is asymmetric in states of the global market upturns and downturns. Winners have higher downside market betas and lower upside market betas than losers, and hence their risks are more asymmetric. The winner-minus-loser (WML) momentum portfolios are subject to the downside market risk, but serve as a hedge against the upside market risk. The high return of the WML portfolios is a compensation for their high risk asymmetry. After controlling for this risk asymmetry, the momentum portfolios do not yield significant abnormal returns, and the momentum factor becomes insignificant in the cross-section. The two-beta CAPM with downside risk explains the cross-section of returns to global momentum portfolios well.
Source:Dobrynskaya, Victoria, Asymmetric Risks of Momentum Strategies (March 2014). Available at SSRN: http://ssrn.com/abstract=2399359 or http://dx.doi.org/10.2139/ssrn.2399359


Ways you sabotage yourself

Investors’ hate being wrong, so they’ll hold on to losing positions and get caught in a loss trap. They will favor information that supports what they already believe, even when new information proves it wrong. If you spend time reading about the market, you may notice you are mostly looking for evidence that supports what you already believe rather than data that may cause you to stop and reverse.

Skilled and experienced investment managers eventually figure out that the challenge isn’t the market- it’s us. We create our results, not the market.

When we realize that mistakes are biases and illusions, not being wrong on a position and taking a loss to keep them small, that’s what creates an edge.

Trang Ho of Investor’s Business Daily wrote an outstanding article worth reading on the subject. It’s about self-sabotage: Stock Market Traps: 5 Ways Your Brain Can Sabotage Your Investing

The role of shorting, firm size, and time on market anomalies

Image

There are now more than 300 published papers providing evidence of the persistence of price trends (inertia/momentum). We point out the constant flow of new papers adding to the evidence of relative price strength as a market inefficiency (often called a market anomaly by academics). I call it velocity.

Abstract

We examine the role of shorting, firm size, and time on the profitability of size, value, and momentum strategies. We find that long positions make up almost all of size, 60% of value, and half of momentum profits. Shorting becomes less important for momentum and more important for value as firm size decreases. The value premium decreases with firm size and is weak among the largest stocks. Momentum profits, however, exhibit no reliable relation with size. These effects are robust over 86 years of US equity data and almost 40 years of data across four international equity markets and five asset classes. Variation over time and across markets of these effects is consistent with random chance. We find little evidence that size, value, and momentum returns are significantly affected by changes in trading costs or institutional and hedge fund ownership over time.

They find the momentum premium exists and is stable across all size groups and the entire 86-year period—it was persistent in all four 20-year periods examined, including the most recent two decades that followed the initial publication of the original momentum studies.

Source:
The role of shorting, firm size, and time on market anomalies Journal of Financial Economics, Volume 108, Issue 2, May 2013, Pages 275-301
Ronen Israel, Tobias J. Moskowitz

Option Pricing Asymmetry: The Lack of Symmetry

A theory is a generalized explanation of how things work. For example, I apply a scientific process for quantitative investment research and that quantitative research can either be data-driven or theory-driven. Theory-driven research starts with a theory about how I something works or if a thing will work (or not). For example, we may theorize that buying a stock, ETF, commodity, or currency that is rising over the past six months may continue to rise and result in higher profits than buying securities that are falling. The is a belief in momentum and intertia. At that point, it’s just a theory – a belief. Theories aren’t necessarily true. But if you believe it, it’s probably true for you. A data-driven approach starts with testing all kinds of systems and methods to determine what works and what doesn’t and it doesn’t start with a theory, but instead a study of the data. Most of testing I’ve done was data-driven because I was trying to create a certain result through the process of buying and selling. I really don’t believe I need a good story to back it: if it works it works and proving that mathematically is good enough. As it turns out, doing original research without the biases of beliefs and theories may have been an edge. Of course, we can confirm, prove, or disprove our theories through data studies. People prefer a good story behind a good system.  To have that illusion of some firm foundation behind why something works is  probably better than not having one. I digress. I was thinking of that as I read over the below paper on options pricing theory. You see, the theories of how options are priced is a theory- a general explanation of why the premium is what it is. Option pricing is one the most researched theories. I thought the following paper titled “Option Pricing Asymmetry” was interesting. It doesn’t surprise me there is some asymmetry in options pricing.

Option Pricing Asymmetry by Dallas Brozik, Marshall University

Introduction:

“Option pricing is one of the most researched areas of finance. Several different option pricing models have been developed, each with its own strengths and weaknesses. One characteristic of these models is that call options and put options are treated as opposites by the pricing model. While such a result might be intuitively appealing, there is no a priori reason to believe that market participants price these contracts in an identical but opposite manner. Option prices reflect the behavior of the market participants, and if there is a significant difference between the behavior of the buyers/sellers of call options and the buyers/sellers of put options, then any option pricing model will need to reflect this difference in the pricing of the different contracts.”

Option Asymmetry
In summary, he finds that:

“The markets for call options and put options may be similar, but they are not identical. The pricing models for calls and puts are not mirror images. This lack of symmetry between call and put pricing implies that hypothesized relationships like put/call parity may be inaccurate and that models based on these hypothesized relationships will need to be revisited. One aspect of the difference appears to be that call and put options do not value time in the same way. In addition to any cost of capital assumed by the underlying pricing model, there is an additional time factor that causes the spread between call and put option prices to increase with time. No mechanism is suggested for this difference, but it is there. This is an area for future research.”

Source: Option Pricing Asymmetry (click to read the full paper)