August was a strong month for the U.S. stock market, but the broad S&P 500 stock index and leading sectors have reached short-term overbought extremes that often indicate short-term elevated risk.
My focus is to position capital in the primary direction of trends across different time frames, but trends can reach short-term extremes within the primary trend. We can focus only on the bigger trend, or we can try to take advantage of the short-term moves.
To understand where I am coming from for this observation, let’s define trend and extreme.
Trend is a direction that a price is moving, developing, evolving, or changing. A trend is a directional drift, one way or another. When we speak of price trends, the directional drift of a price trend can be up, down, or sideways. When I say a price is trending, it’s drifting up or down. I call sideways oscillation non-trending.
Extreme is reaching a high or the highest degree; very great, furthest from the center or a given point.
Tactical traders can be either directional traders or non-directional. For example, all investors are necessarily directional: they invest in a thing and want its price to go up.
A tactical trader can be directional: buying a stock, bond, commodity, or currency, hoping it will go up with them or they can sell it short hoping it will trend directionally down. They are directional traders, so they necessarily need to define the direction of the trend. Which way is it drifting?
However, not all traders are directional. Volatility traders who trade volatility through listed options or futures are trading movement itself, so when we trade volatility we aren’t concerned at all with the direction of the trend – we just want movement. Volatility traders may have no bias at all regarding the direction, we focus on volatility expansion or volatility contraction.
Trend Following is a directional strategy that requires the portfolio manager to determine the direction of the trend and enters that trend expecting inertia and momentum to continue in that direction. There are more than 300 published academic studies alone that prove that the most recent 3 to 12-month price momentum tends to continue rather than reverse. That doesn’t include the vast research and testing conducted by actual trading firms and hedge fund managers (like mine) that are not published to the public. These methods rely on directional trends to exploit for profit.
Countertrend is another directional strategy that requires the portfolio manager to determine the directional trend. However, my counter-trend system is designed to identify trends that are more likely to reverse and change direction than to continue. It may seem this strategy is the opposite of trend following, and in some ways it is, but countertrend systems are based on different time frames when executed correctly.
For example, a trend-following strategy that has been profitable has necessarily identified existing trends that have continued and trend following profits from the magnitude of those gains.
A counter trend can also be profitable and even combined with a trend following system. A counter trend system identifies reversals when the trend has changed or likely to change. The time frame, then, is different.
For example, while research shows that directional momentum over the recent 3 – 12 months tends to continue for another 12 months or longer, we also observe that trends have lasted 4-5 years tend to reverse and change trend.
You may notice stock market uptrends (bull markets) last about 4-5 years before they reverse into a downtrend (bear market). You may also notice investors and their advisers have a tendency to buy funds with the highest 5-year returns, only to catch the end of the excellent performance. You can probably see how they are “trend following” but using the wrong time frame. We find that trends actually reverse around the time those performance tables look appealing to investors. Counter trend systems aim to get positioned for big reversals in trend to profit from their directional change. Skilled counter trend portfolio managers develop and operate countertrend systems that are proven and quantified to identify and profit from such changes in trend.
We also observe short-term countertrends within the 30-day time frame. Sometimes short-term extremes result in at least a temporary countertrend move in the opposite direction. These are shorter trend countertrends within an overall primary trend. Of course, countertrend reversals can also become longer trend changes, too.
Back to August, it was a strong month for U.S. stocks, but the broad indexes and leading sectors have reached higher risk levels in the short term.
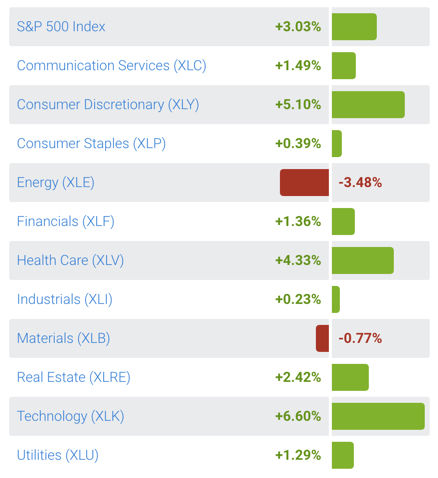 The Technology sector reached a short-term overbought extreme in June and again in July and declined about -4% before resuming an uptrend.
The Consumer Discretionary sector where Amazon (AMZN) has a 25.5% weighting reached an overbought extreme in June and declined about -4% before resuming an uptrend.
The Healthcare sector has also shown strong momentum in its trend. It also reached a short-term overbought level, but only declined about -3%. However, by my measure, the Healthcare sector is more overbought than others.
These shorter trend trends are partly driven by investor sentiment. So, investor sentiment measures can be useful secondary confirming indicators to understand the condition of trends. At this point, most investor sentiment readings are only modestly elevated to levels that suggest greed is driving the market trend. Price could keep trending until enthusiasm is exhausted and sellers become dominant.
This is a very short-term observation of current trends. It’s just a near-term insight that we shouldn’t be surprised to see stocks decline at least a few percents in the weeks ahead.
And… it’s September… for those who follow seasonality, September has historically been one of the weakest months for stocks. I don’t make decisions based on seasonality. If stocks decline this month, the cause will be what I highlighted, not because which month it happens to be.
The bottom line is the broad stock indexes are trending up and led by a few strong sectors, but they’ve reached levels that my countertrend momentum systems suggest the risk of at least a temporary decline is elevated.
Mike Shell is the Founder, and Chief Investment Officer of Shell Capital Management, LLC, and the portfolio manager of ASYMMETRY® Managed Portfolios and ASYMMETRY® Global Tactical.
You can follow ASYMMETRY® Observations by click on on “Get Updates by Email” on the top right or follow us on Twitter.
The observations shared in this material are for general information only and are not intended to provide specific advice or recommendations for any individual. Investing involves risk including the potential loss of principal an investor must be willing to bear. Past performance is no guarantee of future results.

You must be logged in to post a comment.