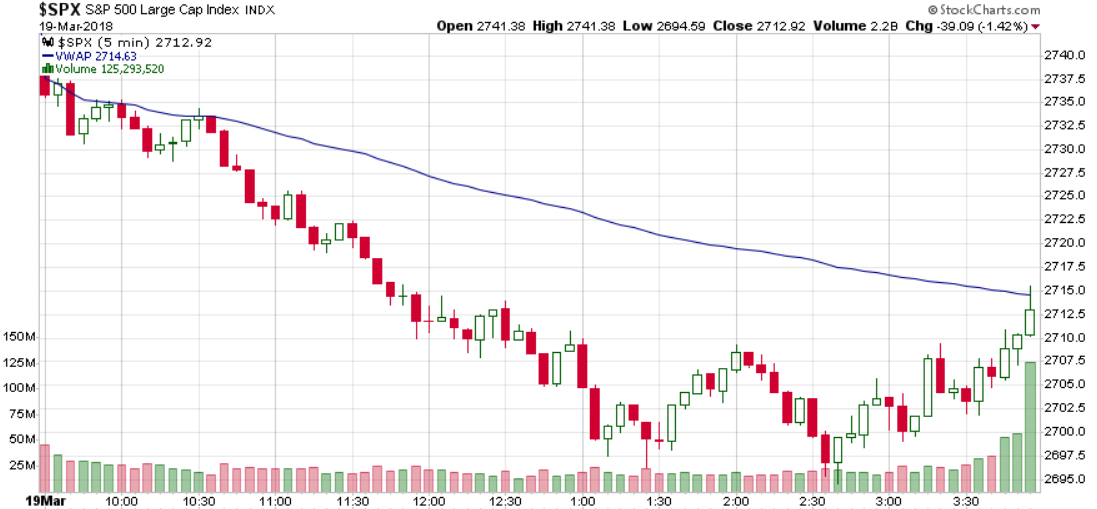
The enthusiasm to sell overwhelmed the desire to buy. The S&P 500 stock index closed down -1.42% today. Stocks trended down most of the day and at 2:35pm it was down -2%. As you can see on the chart, it reversed up in the last 90 minutes and closed with positive directional movement. It almost closed above its Volume Weighted Average Price (VWAP).
There are many notable economic reports out this week, so maybe investors are concerned about to the jobs report and the Fed FOMC Meeting. The options market has priced in a 94% chance of a rate hike, so it shouldn’t be a surprise. But, this week is the first FOMC meeting for the new Chairman Powell.
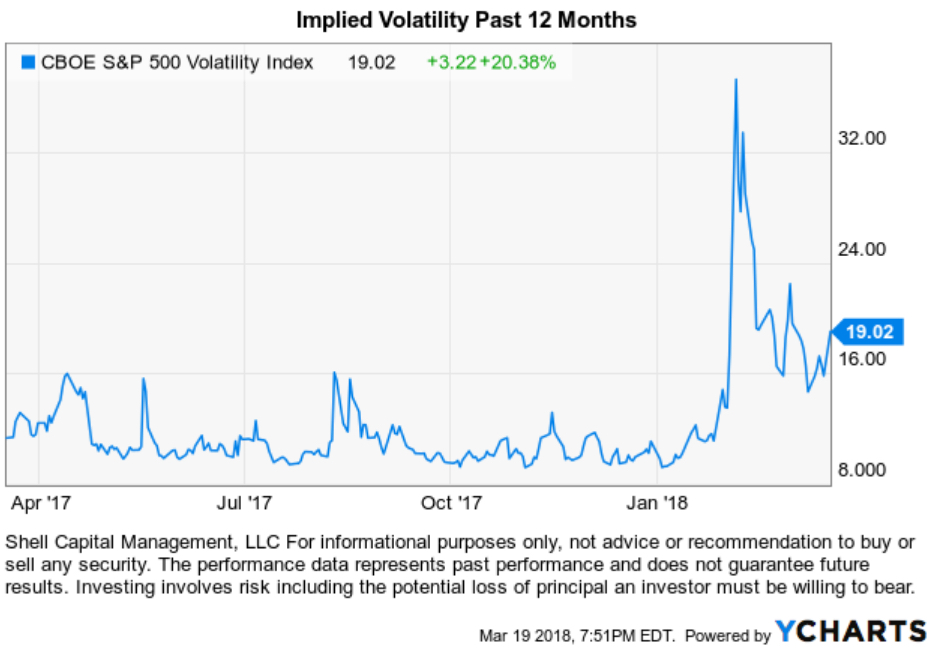
Implied volatility in recent weeks is one of many signals that suggest a volatility regime change. The CBOE Volatility Index® (VIX® Index®) is a key measure of market expectations of near-term volatility conveyed by S&P 500 stock index option prices. The VIX® doesn’t seem to want to go back to those prior low levels, so the expectation is higher volatlity.
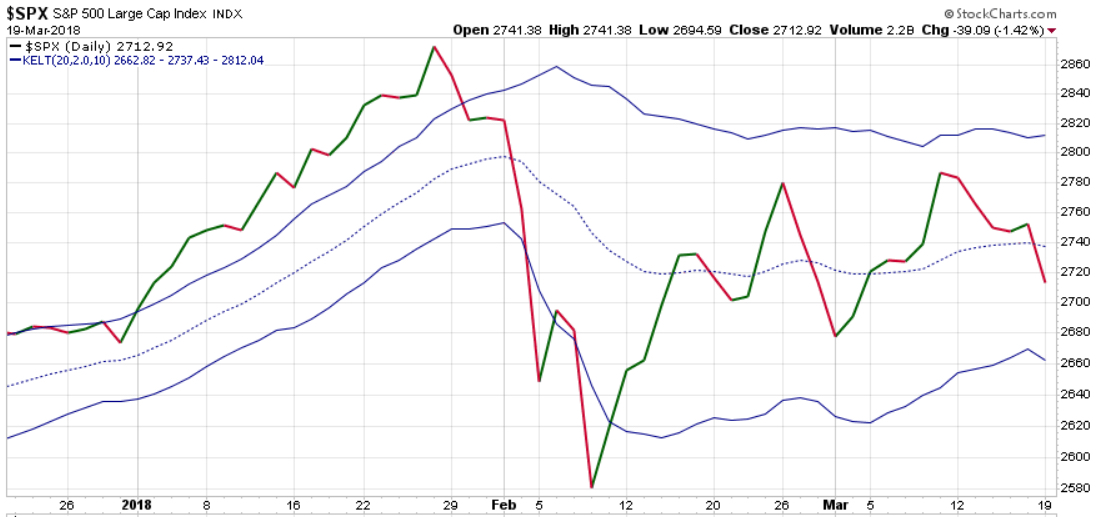
At this point, the decline today was nothing too abnormal. The stock index is -3.% off it’s high a few weeks ago and -5.4% off its all-time high. However, as you can see below it is within a normal trading range. Speaking of trading range, notice the bands of realized volatility I added to the chart are drifting sideways rather than trending up or down. I see higher lows, but equal highs in the most recent trend and lower highs looking back to January. The VIX is expected volatility, the blue bands are realized volatility.
My systems define this as a non-trending market. When I factor in how the range of price movement has spread out more than double what it was, I call it a non-trending volatile condition. It is useful for me to identify the market regime because different trend systems have different results based on the situation. For example, non-trending volatile market conditions can be hostile situations for both passive and trend following strategies. However, countertrend systems like the swings of a non-trending volatile market.
Trend following systems thrive in markets that are trending and smooth. When a market is trending and smooth, the trend following system can earn gains without having to deal with significant adverse price action. When a market trend shifts to non-trending and volatile, the trend following signals can result in whipsaws. A whipsaw is when the price was moving in one direction (and the trend follower buys) but then quickly reverses in the opposite direction (and maybe the trend follower exits with a loss). Even if the trend following system doesn’t enter and exit with a loss, in a non-trending volatile market the trend follower has to deal with the same hostile conditions as a passive investor as the market swings up and down.
My U. S. equity exposure since early February has come from my shorter term countertrend systems. My focus and the focus of my systems isn’t to predict the direction of markets but instead to identify when a market is undergoing a regime change or shifts to a distinct environment. I don’t analyze the markets to try to predict what it will do next. I look at what the market is actually doing and react to it.
Mike Shell is the founder and Chief Investment Officer of Shell Capital Management, LLC, and the portfolio manager of ASYMMETRY® Global Tactical.
You can follow ASYMMETRY® Observations by click on on “Get Updates by Email” on the top right or follow us on Twitter @MikeWShell
The is no guarantee that any strategy will meet its objective. Past performance is no guarantee of future results.

Pingback: Is this correction and volatility normal? « ASYMMETRY® Observations
Pingback: Trend Analysis of the Stock Market « ASYMMETRY® Observations
Pingback: Expected Volatility Stays Elevated in 2018 « ASYMMETRY® Observations