ASYMMETRY® Ratio
The ASYMMETRY® Ratio is a ratio between profit and loss, upside vs. downside, or drawdown vs. total return.
Asymmetric investment returns created by a fund or investment program can be presented as an ASYMMETRY® Ratio of the total return vs. maximum drawdown. The ASYMMETRY® graph shows a ratio of the upside vs. the downside over a market cycle. It presents the total return and the risk required to obtain it. Profit can’t be evaluated without a measurement of the risk it took to earn it. Here, we define the risk as to the worst historical drawdown. For example, in the ASYMMETRY® Ratio graph below, we show the total return of an investment option vs. its maximum drawdown over that period. The black bars represent one investment program, the red bars another. The total return includes capital gains, dividends, and interest. The costs of operating an investment program are crucial, so you want the net performance data. The maximum drawdown is the most it declined at any point during the period from its highest peak to its lowest low using daily data points. Here, we compare two different investment options.
An asymmetric investment example had a 74.91% total return, and it declined as much as -14.33% along the way.
The second investment program had only a 9.65% total return and decline -50.95% along the way. Clearly, these are two very different imbalances. We pursue a positive asymmetric return profile, so the first investment program is the only one that meets that definition. From that point, it’s a matter of whether or not the risk and reward are within your investment objectives.
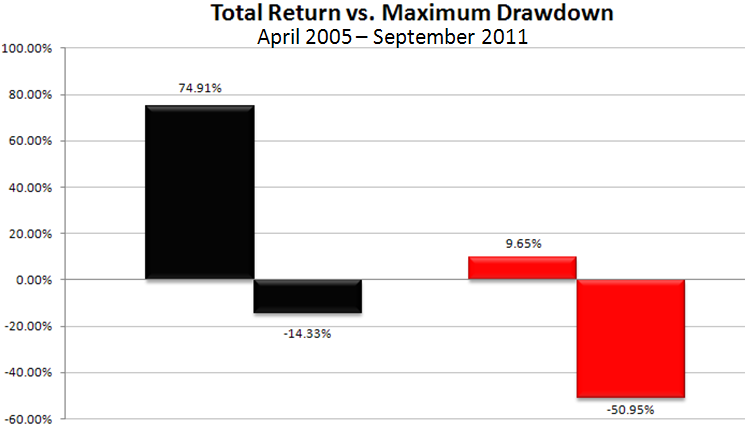
Image source: Shell Capital Management, LLC, used for educational illustration purposes only.
The ASYMMETRY® Ratio clearly separates the upside vs. the downside in a visual way that allows us to distinguish the difference in the asymmetric return profiles. We use this graph solely for educational purposes, so we don’t label the ratios.
At Shell Capital Management, we design, develop, and operate quantitative trading systems for global tactical rotation or trend following. We use the ratio between risk (maximum drawdown) and reward (total return or Compound Annual Growth Rate) to sort through thousands of trading system simulations to determine those that have an asymmetric risk and reward profile that meets our objectives.
What we call the asymmetric investment return profile, or the ASYMMETRY® ratio is nothing new. A similar way to compare investment programs is known as the “MAR Ratio,” which was previously used by the Managed Accounts Review for ranking Commodity Trading Advisors (CTAs). It is known as the “pain-to-gain ratio.” The official equation for the MAR Ratio is:
MAR Ratio = CAGR / Max Total Equity Drawdown
You may notice the only difference is the MAR Ratio uses the CAGR. For our purposes, we prefer to avoid the use of “averages” and instead focus on the total return over a period.
Other pain-to-gain ratios are the Monthly Sortino Ratio or the Calmar Ratio. An issue with the Sortino is the use of standard deviation. As I have discussed before, the use of standard deviation for measuring risk is a severe problem for those who use it, so I don’t give it another thought. The Calmar Ratio appears similar to the MAR Ratio, except the Calmar Ratio uses a different data point in the denominator. The MAR Ratio uses the maximum drawdown over the simulation period using marked-to-market daily data points. The Calmar Ratio is a worst historical drawdown, too, but it only uses the month-end total equity data point. Therefore, it seems the Calmar Ratio would understate the full magnitude of the drawdown. For example, the investment program may have been down -20% during the month, but only close down -5%, which would understate the full decline by -15%. That -15% may have been just enough to cause panic selling.
You can probably see why I prefer a simple ratio of the total historical return vs. the maximum decline along the way using daily data points. These metrics seem to more accurately illustrate the risk and reward experience. Of course, looking at performance is always in the past, never the future. I am not suggesting that these ratios alone have any predictive ability. And clearly, past performance doesn’t guarantee future results. In comparing trading systems, we use it to sort out those with an asymmetric risk and reward profile that fits our objectives. It can be used the same for investors comparing investment programs like funds, hedge funds, and managed accounts. I suggest that a minimum of 5 years of history be used; however, the number of data points necessary is really more a function of the nature of systems you are analyzing. You certainly want to include a full market cycle, which is a period that includes bear and bull markets like the last five or six years. However, that is just a starting point to separate asymmetry from symmetry. If an investment program hasn’t met your objectives based on its past track record, then you have no real basis for believing it will work in the future.
ASYMMETRY®, ASYMMETRY® Investment Program, ASYMMETRY Capital Partners®, and Global Tactical Rotation® are registered trademarks of Shell Capital Management, LLC
For more information, see:
Asymmetric Return Distribution
Keywords: asymmetry, asymmetry ratio, asymmetric risk reward, asymmetric return, drawdown control, active risk management, investment risk management, portfolio risk management, portfolio hedging, stop loss, position sizing, portfolio heat, portfolio risk.

Pingback: Global Markets Year to Date « Asymmetry Observations
Pingback: Stock pickers market? Sector rotation with stocks for asymmetric reward to risk « ASYMMETRY® Observations
Pingback: Earnings season is tricky for momentum growth stocks « ASYMMETRY® Observations