Stock prices may not be finished falling, but some opportunities for asymmetric risk-reward may be present for those willing to take risks

Based on my velocity measuring algorithms, the stock indexes are now starting to get oversold. That is, the stock indexes are reaching a point we could see at least a short term countertrend back up, on a short term basis. These measures are based on short term market overreactions, such as when price decline sharply beyond a point we expect mathematically over a period. It certainly doesn’t mean the price trend can’t fall farther as they often do but instead signals a potential countertrend that could drive prices to retrace some of their loss. However, if the downtrend price trend becomes a prolonged and deeper downtrend, these countertrend measures fail to perfectly time the low. Investment management is probabilistic, never a sure thing, so I never expect anything more.

What matters most is if I wanted to take some risk right now on a short term oversold market, I would predefine my exit to cut my loss short if it doesn’t work out and let it rip. We never know for sure in advance when prices will reverse, I can only determine when it is more likely.

The challenge right now, in addition to some other observations I’ve shared recently about valuation, etc. is stock market breadth is far from oversold. So, my breadth measures do not yet suggest any significant selling pressure has been exhausted. I believe when investors sell stocks with great enthusiasm, it shows up in the percent of stocks above and below the trend lines. After prices have plummeted and most of the stocks have fallen into downtrends I start to wonder if the desire to sell is losing steam. At this point, these indicators don’t yet signal a significant panic level selling, so that’s the risk from this point.

I’ll share some of the price trends and indicators I look at when stock prices are falling.

First up is the percent of S&P 500 stocks above their 50-day moving averages. As the chart shows, last month about 82% of the stocks were above their shorter-term trend line. I consider levels above 80% to be a higher risk zone. As we see below, the percent of S&P 500 stocks above their 50-day moving averages made a lower high since January and now is falling at 38%.

breadth percent of stocks below 50 day

While we don’t use it as a market timing indicator, it instead provides some situational awareness of the risk of decline. After most stock prices have already risen, where does more demand come from? At higher levels, I consider the enthusiasm to buy may be becoming exhausted. It once again seems to be what has happened here as investors were enthusiastic about stocks until recently.

Another warning shot across the bow was when this breadth measure failed to confirm an all-time new high in the stock market. Below is the same indicator as above, but I overlayed it with the price trend of the S&P 500. As the SPX trended up to an all-time new high, the percent of S&P 500 stocks above their 50-day moving averages showed a material divergence, indicating fewer stocks were participating in the uptrend. I’ve been monitoring these indicators for two decades now and from my experience, a divergence like this that indicates less participation and “breadth” of the trend is a warning sign. In a healthy uptrend, most stocks are trending higher, so the percent of S&P 500 stocks above their 50-day moving averages is increasing, not decreasing.

breadth failed to confirm new stock market high february 2020

For a longer-term context, below is the percent of S&P 500 stocks above their 200 day moving averages. I consider below 20 or 30% to be an overreaction to the downside, but currently, 66% of stocks are above this longer-term trend line. On the one hand, higher participation is positive, but it’s declining from a relatively high level, which makes it more negative. It also provides us with the awareness that stocks could certainly fall a lot more. The times when less than 20% of these stocks were above their 200-day moving average was periods of notable stock market drawdowns.

percent of stocks above 200 day moving average long term breadth

So, these are some examples of why I started reducing our exposure to zero a month ago and only recently have been increasing exposure by rotating back out of US Treasuries into high dividend yield positions. The nice thing about high dividend yield positions is as the price falls, the dividend yield increases. It’s one time when I buy after prices fall, so we earn the dividend yield from that point forward. My timing is rarely perfect and it doesn’t have to be.

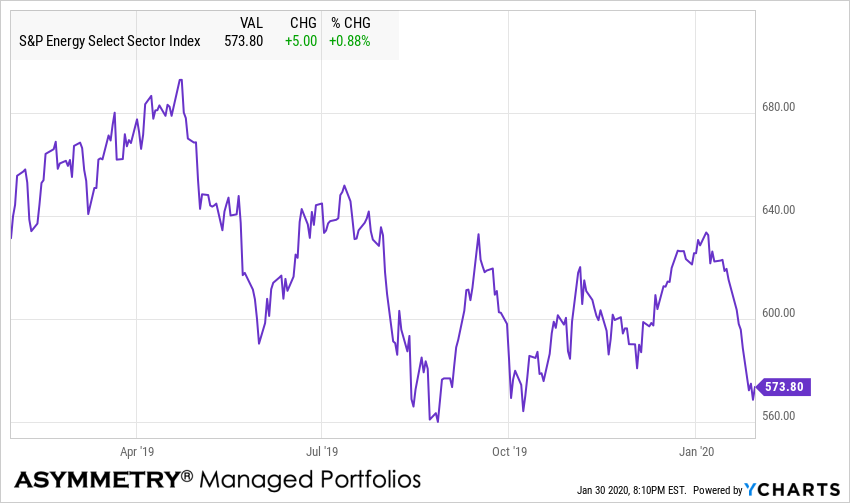
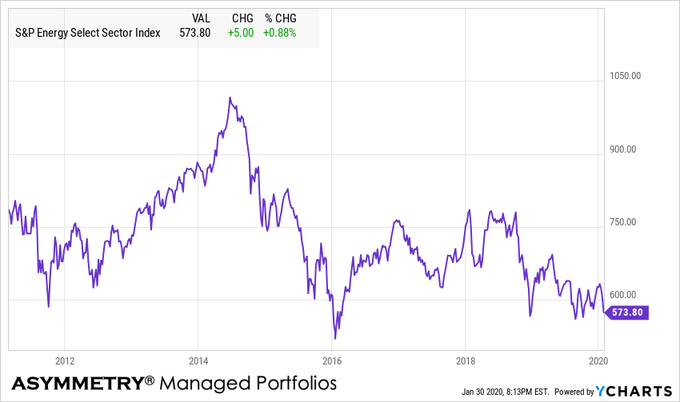
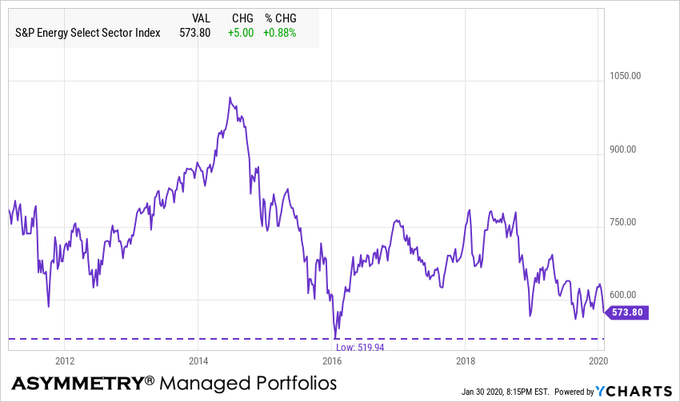
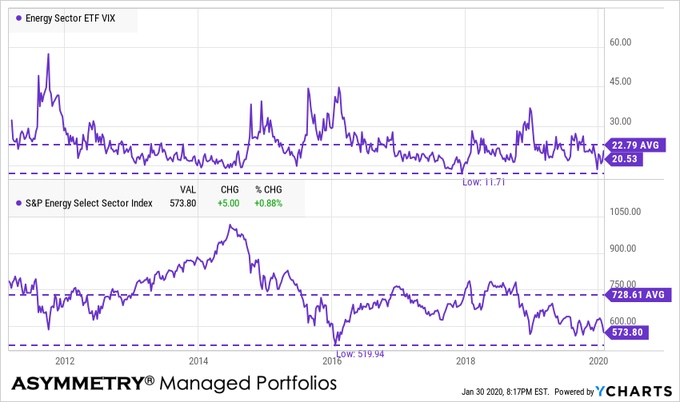
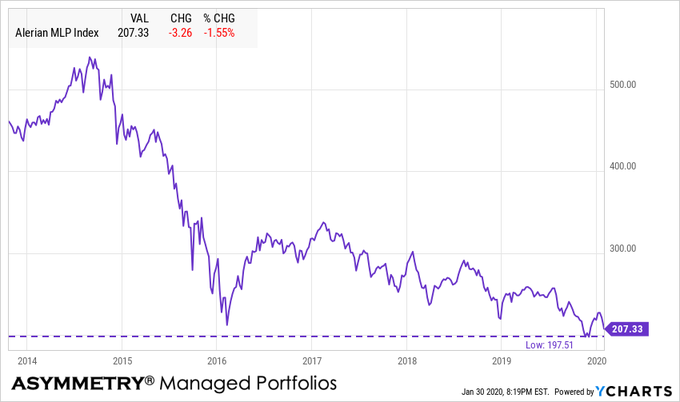
By way of example only, below is a chart of the Alerian MLP Index price and dividend yield. MLP’s are Master Limited Partnerships and in this case, they are publically traded. The Alerian MLP Index is the leading gauge of energy infrastructure Master Limited Partnerships (MLPs). The capped, float-adjusted, capitalization-weighted index, whose constituents earn the majority of their cash flow from midstream activities involving energy commodities, is disseminated in real-time. I’m using this index for illustration to show how (1) the price trend of the MLP index has fallen with energy prices and (2) since its holdings pay high dividend yield, as the price falls, the yield trends up as seen in the chart.

MLP high dividend yield strategy

The purple line shows the dividend yield is 9.41% based on the current price and the price is making a new low. This is one of the most extreme examples right now to make the point. It not only makes the point that buying lower prices in high yield securities can potentially capture asymmetric risk-reward, but also these high yielding securities are not without risks that need to be managed. The risk is made obvious by the price trend chart, which is down -27% over the past year.

As with most things in life, timing is everything. If we had entered a position with the risk/reward profile that existed a year ago, it was more risk than reward, as the high yield income from dividends wouldn’t have been enough to offset the loss from the price decline. But, in the case of exposures that provide higher potential income streams from dividend yield at lower prices, you can probably see how to offset the potential from asymmetric returns from an asymmetric risk-reward payoff. But again, it isn’t so simple and requires risk management, because there is no guarantee stocks, bonds, or MLPs will always keep paying their yields.

In summary, my short term velocity algorithms suggest the popular stock indexes are nearing a short term level we could see a countertrend, but the bigger picture isn’t so positive as there remains plenty enthusiasm to be exhausted. In other words, in late December 2018, my indicators suggested an extreme level of panic selling has happened and it was likely becoming exhausting. It turned out to be exactly what happened. The current measures are nowhere near that level of oversold, but if sellers aren’t panicking to sell it will not get there, either.

At this point, the stock index is only -6% off its high, which is just short of the decline last summer and well within a normal decline. We typically see 2-3 price declines of -5% annually.

february 2020 stock market decline drawdown amount

To put it into context, the current stock market decline is less than 1/3rd of the waterfall decline over a year ago.

stock market historical drawdowns

Only time will tell if the desire to sell is being exhausted. Fortunately, we had already de-risked our portfolio before this started and are now looking to take on new asymmetric risk-reward positions as they present themselves. My risk management and drawdown control systems handle the rest.

Mike Shell is the Founder and Chief Investment Officer of Shell Capital Management, LLC, and the portfolio manager of ASYMMETRY® Global TacticalMike Shell and Shell Capital Management, LLC is a registered investment advisor in Florida, Tennessee, and Texas focused on asymmetric risk-reward and absolute return strategies and provides investment advice and portfolio management only to clients with a signed and executed investment management agreement. The observations shared on this website are for general information only and should not be construed as advice to buy or sell any security. Securities reflected are not intended to represent any client holdings or any recommendations made by the firm. Any opinions expressed may change as subsequent conditions change.  Do not make any investment decisions based on such information as it is subject to change. Investing involves risk, including the potential loss of principal an investor must be willing to bear. Past performance is no guarantee of future results. All information and data are deemed reliable but is not guaranteed and should be independently verified. The presence of this website on the Internet shall in no direct or indirect way raise an implication that Shell Capital Management, LLC is offering to sell or soliciting to sell advisory services to residents of any state in which the firm is not registered as an investment advisor. The views and opinions expressed in ASYMMETRY® Observations are those of the authors and do not necessarily reflect a position of  Shell Capital Management, LLC. The use of this website is subject to its terms and conditions.

Energy and MLP’s are the most oversold sector

The energy sector is the most oversold so far.

By oversold, I mean a condition where there has been enough selling pressure to drive prices down to low enough levels which overextended or excessive on a short-term basis, suggesting the downtrend could be an overreaction. When price trends overreact in the short-term by moving potentially too far, too fast, the trend becomes likely to reverse back up, at least temporarily. Afterward a countertrend back up, however, a short-term oversold trend may later reverse down again in continuation of a downtrend. So, observing a short-term oversold condition may not result in a long-term trend reversal up, but instead, my increase the odds of a short-term retracement. In the chart below of the energy sector index, we see an overall downtrend since the price on the left side is higher than the right a year later, however, we also observe the price swings along the way, which are shorter-term overbought/oversold countertrends.

Image

Energy sector is -43% from its early 2014 high.

Image

Energy sector is almost near its 2016 low.

Image

Energy implied volatility is relatively low and below average.

Image

Alerian MLP energy index is at a new low

Image

With the energy sector momentum signaling its price trend may have dropped too far, too fast,  the dividend yield on the MLP index is at its high post-2016 at over 9%.

ENERGY MLP ETF

As the price falls, the dividend rises from that starting point, so it’s the one time we apply countertrend systems to capture future income from dividends. I wouldn’t be surprised to see the energy sector catch some buying enthusiasm soon if the overall stock market can hold up. Sometimes the weakest sectors show strength even as other sectors fall.  Of course, the risk of a falling trend is it may keep falling and they can trend down far more than expected. The trouble is, when a trend does fall more than expected, it results in serial correlation; prices keep falling because, well, prices are falling! Waterfall declines are contagious, so you can probably see the ‘risk premium’ involved in this high dividend yield. There is no free lunch and nothing is without risks.  I deal with risks by managing them through predefined exits, drawdown controls, and hedging.

So, I probably enter and exit a more global opportunity set of markets than most do since the risk for me is how I define it and how the position is structured, not the security itself.

I’m off to the Super Bowl in the morning! Unfortunately, my Tennessee Titans didn’t make it and my Tampa Bay Bucs didn’t come close, but I’ll be there anyway.

Mike Shell is the Founder and Chief Investment Officer of Shell Capital Management, LLC, and the portfolio manager of ASYMMETRY® Global TacticalMike Shell and Shell Capital Management, LLC is a registered investment advisor in Florida, Tennessee, and Texas focused on asymmetric risk-reward and absolute return strategies and provides investment advice and portfolio management only to clients with a signed and executed investment management agreement. The observations shared on this website are for general information only and should not be construed as advice to buy or sell any security. Securities reflected are not intended to represent any client holdings or any recommendations made by the firm. Any opinions expressed may change as subsequent conditions change.  Do not make any investment decisions based on such information as it is subject to change. Investing involves risk, including the potential loss of principal an investor must be willing to bear. Past performance is no guarantee of future results. All information and data are deemed reliable but is not guaranteed and should be independently verified. The presence of this website on the Internet shall in no direct or indirect way raise an implication that Shell Capital Management, LLC is offering to sell or soliciting to sell advisory services to residents of any state in which the firm is not registered as an investment advisor. The views and opinions expressed in ASYMMETRY® Observations are those of the authors and do not necessarily reflect a position of  Shell Capital Management, LLC. The use of this website is subject to its terms and conditions.

What could go wrong

Investors, including millionaires and fund managers, are really bullish.

According to E-Trade Financial:

“In Q4 of last year, even as stocks gained, millionaires were cautious and possibly worried about a repeat of the plunge in the fourth quarter of 2018. Now 76% of these wealthy investors grade the U.S. economy highly, and there has been a 16% increase in investors who expect the market to rise by as much as 5% this quarter, according to an E-Trade Financial quarterly survey provided exclusively to CNBC.”

Then, Bank of America Merrill Lynch’s regular survey of global fund managers:

“The FOMO — fear of missing out — market did not come out of nowhere.

Last November, Bank of America Merrill Lynch’s regular survey of global fund managers found that global fund managers’ cash levels posted their largest decline since President Donald Trump’s 2016 election as investors rushed to take on risk.”

After reading that, I thought: With everyone so bullish, what could go wrong? 

Place tongue in cheek image here.

Following up with my reaction over the weekend to Barron’s cover in Now, THIS is what a stock market top looks like!, I finally got around to reading the article “Ready or Not, Here Comes Dow 30,000.”

Barron’s said:

“Investors are responding to a set of conditions- low interest rates, muted inflation, and massive cash returns from U.S. companies – that make putting money into stocks the rational thing they can do.”

So, the reach for yield drives the stock market because:

“Some 80% of companies in the index cash-return yields higher than treasuries.”

Below I compare the S&P 500 stock index ETF dividend yield to the 10 year Treasury rate. By this measure, the 10 year is 1.84%, which is 0.14% more than the SPY.

10 year treasury yield compared to S&P stock index yield

However, since the Treasury yield curve is relatively flat, the one-month Treasury is 1.54%, so there isn’t much of a spread or premium between the interest rate earned for just one month over 10 years.

10 year treasury yield compared to S&P stock index yield

Moving on to “What Can Go Wrong” they say rising bond yields are a risk to equities.

Of course, rising prices (inflation) is a driver of rising bond yields.

So, inflation may be the driver of a longer-term downtrend in stocks if these markets interact this way.

Since 2012, the Federal Reserve has targeted a 2% inflation rate for the US economy and may make changes to monetary policy if inflation is not within that range. So far, the FED has been successful ‘on average’, but there have been some uptrends in inflation.

US INFLATION RATE DRIVES BOND YIELD PRICE

Next, I added the high and low inflation rate since 2012 and highlight above 2% in yellow. 

inflation rate drives bond yield price high low

By and large, inflation cycles within a range. With the current inflation rate at 2.29%, which is a little higher than the Fed 2% target, I suppose global macro traders should pay attention to the trend and rate of change of inflation. 

What could go wrong?

There are always many things that can cause a market to fall. We’ve got a U.S. Presidential election this year, an impeachment, now a new virus.

A quick glance at headlines shows:

BREAKING NEWS

CDC expected to announce first US case of deadly Wuhan coronavirus

Changes to impeachment rules

So, there are always many things that could go wrong and be regarded as a catalyst for falling prices, but I focus on the direction of the price trend, momentum, volatility, and sentiment as my guide.

The direction of the price trend is always the final arbiter.

Mike Shell is the Founder and Chief Investment Officer of Shell Capital Management, LLC, and the portfolio manager of ASYMMETRY® Global TacticalMike Shell and Shell Capital Management, LLC is a registered investment advisor in Florida, Tennessee, and Texas focused on asymmetric risk-reward and absolute return strategies and provides investment advice and portfolio management only to clients with a signed and executed investment management agreement. The observations shared on this website are for general information only and should not be construed as advice to buy or sell any security. Securities reflected are not intended to represent any client holdings or any recommendations made by the firm. Any opinions expressed may change as subsequent conditions change.  Do not make any investment decisions based on such information as it is subject to change. Investing involves risk, including the potential loss of principal an investor must be willing to bear. Past performance is no guarantee of future results. All information and data are deemed reliable but is not guaranteed and should be independently verified. The presence of this website on the Internet shall in no direct or indirect way raise an implication that Shell Capital Management, LLC is offering to sell or soliciting to sell advisory services to residents of any state in which the firm is not registered as an investment advisor. The views and opinions expressed in ASYMMETRY® Observations are those of the authors and do not necessarily reflect a position of  Shell Capital Management, LLC. The use of this website is subject to its terms and conditions.


Falling stock price creates an asymmetric return for investors seeking high income from dividend yield

The demand for retirement expertise is strong and getting stronger. In my career over more than two decades, I’m not only observing an aging client base but also a noticeable increase in the number of people over fifty looking for income from their investments.

I don’t always call it “retirement” as it’s really “freedom.”

I don’t necessarily call it “financial freedom” because freedom is freedom, and it’s hard to have it without the financial part squared away.

As my wife Christi and I are rapidly approaching 50 ourselves with seemingly more momentum we’re noticing we are around more and more friends who are looking forward to the shift from “working for a living” to their money working for them.

I call it “getting off the treadmill,” and not everyone wants to get off the treadmill, but when you are ready to, you need a plan.

We create plans for getting off the treadmill and more importantly, staying off it.

But that isn’t my topic today. Today we have a simple topic relative to retirement income portfolio management. That’s what most call it. I just think of it as replacing earned income from working or running a business with passive income from not having to physically “do” things to get money income.

As an active investment manager, I’m not otherwise a fan of anything passive. There is nothing about what I’m going to share here that is passive for me, but it is for investors who want to get a check and go enjoy doing whatever it is they want to do with their time.

Here we go.

The word “correlation” is a statistical term that is grossly overused in the investment industry, but there may be no better true example than the negative correlation between price and yield (or interest rate.)

When the price of a stock or bond that is paying dividend or interest FALLS, its yield from that starting point RISES.

Conversely, when the price of a stock or bond that is paying dividend or interest RISES, it’s yield FALLS from that starting point.

It’s an inverse correlation and the one time when I switch from a trend-following strategy to a countertrend strategy.

If I want high income, I necessarily aim to buy low and sell high through the trend cycles.

I’ll share a very straightforward example, but I’ve removed the name of the fund. This ETF is one I actually own and since my mission here isn’t to make recommendations to people I don’t know or promote a position I have in my ASYMMETRY® High Income Yield portfolio, we’ll just leave off the name. Instead, let’s focus on the price and yield trends.

One advantage of falling stock prices is as price falls, the dividend yield rises from that new price. In the example below, the blue line is the price trend over the past five years. The orange line is its dividend yield. You can see when the price declines, the yield from that staring point rises.

retirement income high yield portfolio

If we buy it after it falls, our yield percentage is based on what price we buy it. Of course, that’s assuming all its holdings continue to pay their dividends/interest. This isn’t risk-free, so I add some risk management techniques to the overall strategy.

The bottom line is, when we look at the blue line above, that’s the price, and it has declined to the lowest point in five years. However, the orange line, which is the dividend yield on this ETF is at an all-time high.

If it’s high income we want from our savings, we want to buy after the price falls, then may sell, or hedge, to reduce exposure after the price trends up to an extreme.

When we buy high yielding assets at lower prices, the dividend payment is higher from that starting point as long as the companies we invest in keep paying their dividends. In this example, this one ETF alone invests in over 100 of the highest dividend-yielding equity securities around the world.

One of the primary risks of high dividend-yielding securities is rising interest rates. Over more than a decade, we’ve seen the central banks drive interest rates from one extreme to another. As the chart of the Prime Rate shows, they lowered rates from 8% in 2007 all the way to 3.25% and kept it at that historically extreme low level. Starting in 2016, the Federal Reserve started raising interest rates. By last year, the Prime Rate had reached 5.5%. The Fed recently lowered the rate to 5.25%.

Economic data now suggests the Fed may continue to lower interest rates.

So, instead of a rising interest rate environment, we may see a falling interest rate environment.

The bad news is; if the Fed keeps lowering rates, historically, the Fed has lowered rates to ward off recession or when it sees substantial risks of a downturn.

The good news is, these falling prices are creating an opportunity for investors who want to build a high-income portfolio through dividend yield and interest.

Of course, if that sounds like you, you don’t want to wait until it happens to get started. If you look closely at the chart again, there are seasons and cycles to increase and decrease exposure.

retirement income high yield portfolio

What we are seeing now is a new opportunity to add exposure.

I’m not saying to randomly go pick high yielding dividend stocks or ETFs. Like any investment, it isn’t risk-free. Investing always involves risk, including the possible loss of principal. High yielding stocks are often speculative, high-risk investments. So, portfolio management requires actively managing the risk along with diversification. Some high dividend companies can be paying out more than they can support and may reduce their dividends or stop paying dividends at any time, which could have a material adverse effect on the stock price of these companies and the Fund’s performance. International investments additionally involve risk of capital loss from unfavorable fluctuation in currency values, from differences in generally accepted accounting principles, or from economic or political instability in other nations. Emerging markets involve heightened risks related to the same factors as well as increased volatility and lower trading volume.

The bottom line is; there is no free lunch. If we want the potential for return, we have to be willing to take the risks we are willing to take, and tactically manage or hedge the risks we want to limit.

As with most things in life, timing is everything. We don’t have to get the timing perfect, just good enough to result in asymmetric risk/reward.

Right now, I see interesting asymmetric risk/reward setups in some of these securities we use to build our high-income portfolio. That is, the potential for future capital gain from price appreciation and high income from the dividend yield seems more elevated than the downside risk.

Of course, if I predetermine my downside risk as I do, I can skew the payoff asymmetrically.

For example, in the case above, this fund of 100 stocks is yielding about 10% from this price. If I invest in it today, the future expected return from the dividends alone would be approximately 10% a year from now, and it pays monthly. You can probably see how attractive that sounds to someone who wants to live off their capital. Let’s see a simple example of the possibility of asymmetry.

Price Falls: As its price has already fallen sharply and its yield has increased to nearly 10%, I may believe it won’t drop a lot more. However, even though it may be oversold, I could predetermine an exit of only -5% below the current price. If it falls -5% after I buy it, I could sell it and take the loss and move on. But, these positions are unique. It isn’t just about the price trend. As price falls, its income-generating potential is increasing. So, a falling price actually increases the future asymmetric risk/reward payoff potential.

Price Stays the Same: If the price stays the same for a year, we will earn about 10% from the dividends. If I only risked 5% on the position and it trended up instead of down and stayed the same for a year, our asymmetric risk/reward is 2:1. I risked 5% to earn 10%.

Price Trends Up: The best outcome is I buy it, and the price goes up, and we also earn the 10% income from the yield. If the price gained 10% and the yield paid 10%, the total return would be 20%. If I risked 5% to earn 20%, the asymmetric payoff is 4:1.

You can probably see why I call this strategy ASYMMETRY® High Income Yield.

Questions? feel free to email me. 

Mike Shell is the Founder and Chief Investment Officer of Shell Capital Management, LLC, and the portfolio manager of ASYMMETRY® Global Tactical.

Mike Shell and Shell Capital Management, LLC is a registered investment advisor and provides investment advice and portfolio management exclusively to clients with a signed and executed investment management agreement. The observations shared on this website are for general information only and should not be construed as advice to buy or sell any security. Securities reflected are not intended to represent any client holdings or any recommendations made by the firm. Investing involves risk, including the potential loss of principal an investor must be willing to bear. Past performance is no guarantee of future results. All information and data is deemed reliable, but is not guaranteed and should be independently verified. The presence of this website on the Internet shall in no direct or indirect way raise an implication that Shell Capital Management, LLC is offering to sell or soliciting to sell advisory services to residents of any state in which the firm is not registered as an investment advisor. Use of this website is subject to its terms and conditions.