I wonder when we’ll start hearing about the death cross again like we did in 2016.
The S&P 500 Equal Weight signaled a death cross today. As with any trend following signal or any signal at all, it doesn’t come with a 100% probability. No signal is always accurate. Nor do they need to be for an edge.
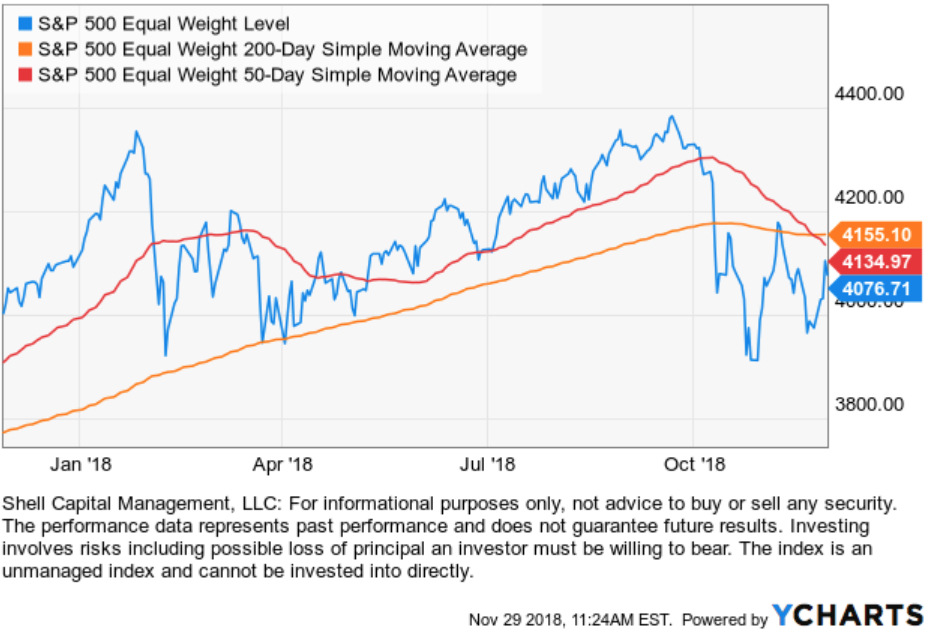
The cap-weighted S&P 500 that everyone follows has more large-cap stock exposure than the equal weight. The cap weight hasn’t yet reached the “death cross” level yet. But it is going to cross soon even if the stock index trends up sharply. We know this because of the length of the lag time in the 50-day moving average. Even big daily gains won’t be enough to stop the downtrend in the 50-day moving average before it crosses below the 200 day moving average. Each days weight is only 1/50, so it is up against the trend of the other 49 days.

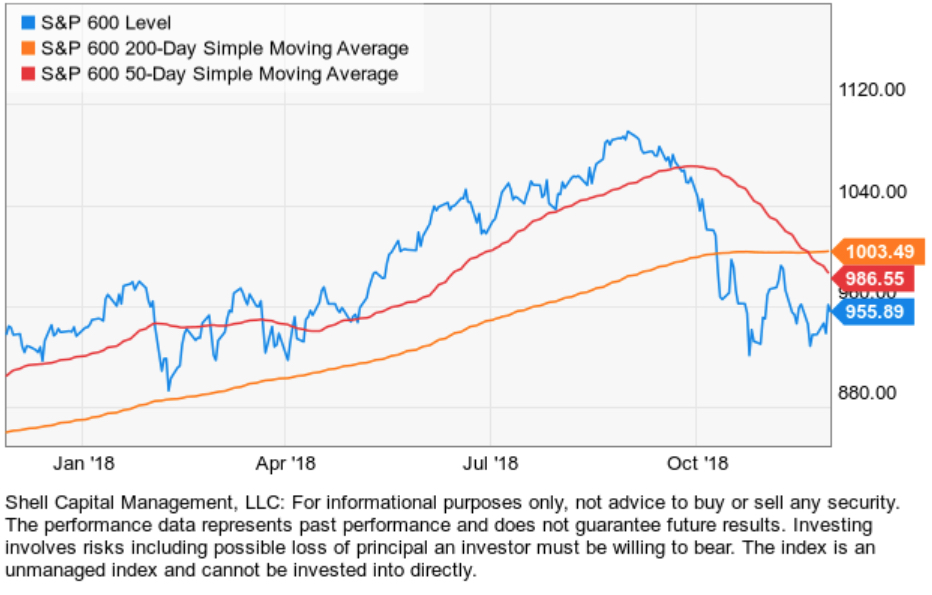
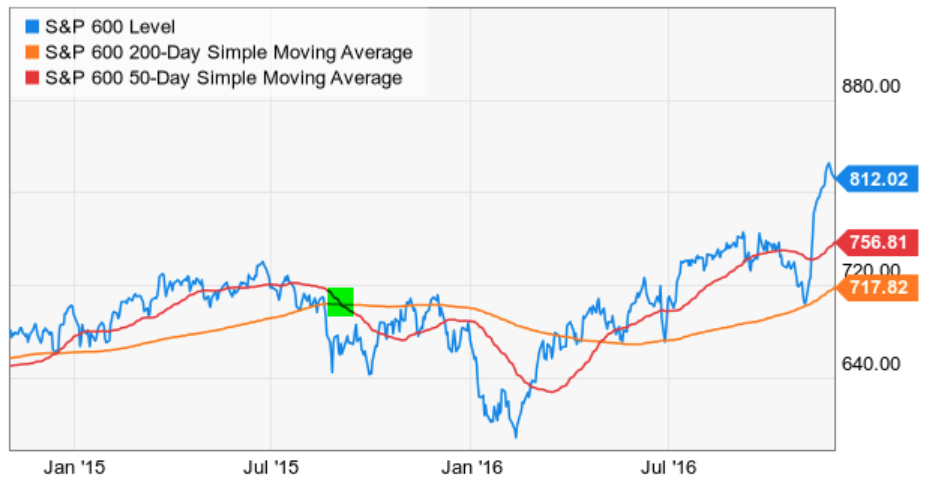
The equal weight S&P 500 has much more exposure to small company stocks. The S&P 600 small-cap index had already achieved a “death cross” when its 50-day moving average crossed below the 200 day recently.
The death cross is considered a bearish indicator that generates a trend following signal to exit or go short when the 50-day moving average drops below 200-day moving average. We last saw it in 2015 and 2016 when it got a lot of media attention. The death cross signals also resulted mostly in whipsaws.
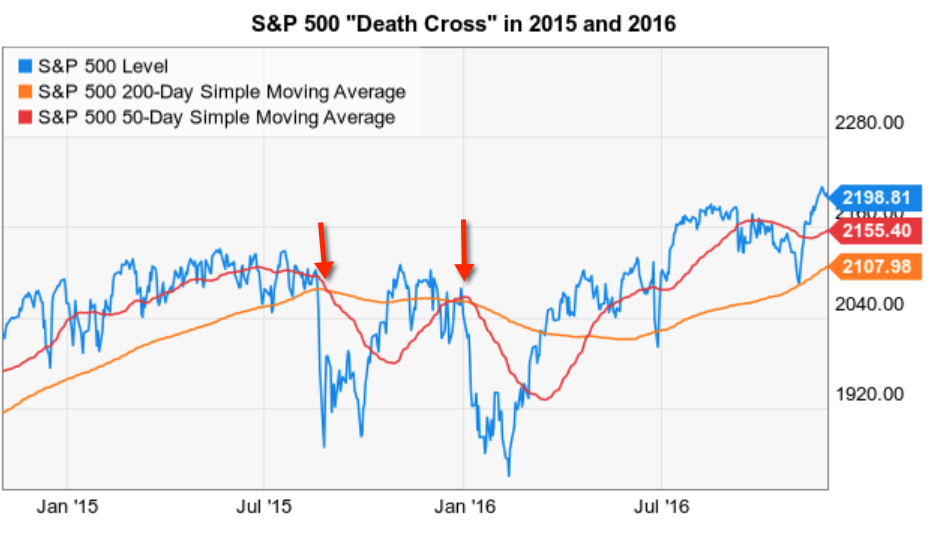
One difference in 2015 and 2016 was the Equal Weight S&P 500 only gave one signal as the cap-weighted whipsawed with two.
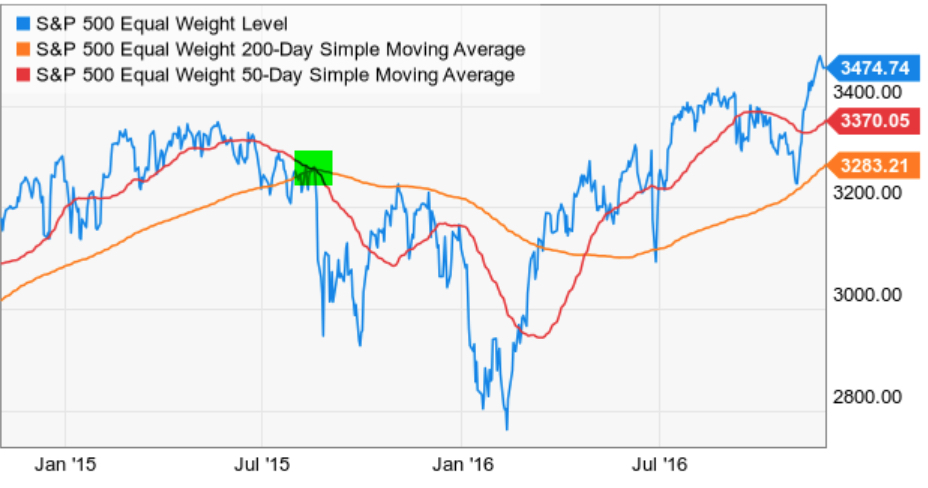
Here we can see why… the Equal Weight has more exposure to small-cap stocks and small-cap stock index only generated one signal.
What the death cross 50/200 moving average “death cross” indicator signals is, with a necessary lag, prices have been declining. That part is a fact.
Only time will tell if it accurately signals more price decline, or if prices have reached a low enough level for buying demand. Indicators that generate trend following signals like the 50/200 moving average crossover are often discussed incompletely regarding only their accuracy (probability), but its the mathematical expectation that matters: are the average profits > average losses?
And indicators that generate systematic trend following signals like the 50/200 moving average crossover are often discussed incompletely regarding a single market like stocks instead of applied across broad markets like currency, bonds, and commodities.
If we remove the moving averages from the chart and focus on the upward momentum the last few days, even the equal-weighted index with its “death cross” signal appears to be attempting to trend back up. So, chances are this will be one of the 60% of the time the signal isn’t accurate.
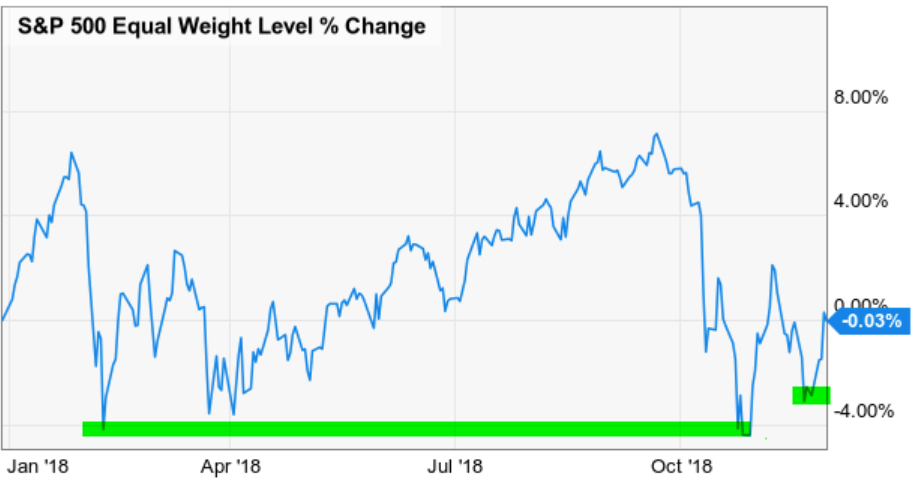
So far, the index is holding the line. Only time will tell, so let’s see how it all unfolds.
Mike Shell is the Founder and Chief Investment Officer of Shell Capital Management, LLC, and the portfolio manager of ASYMMETRY® Global Tactical.
The observations shared on this website are for general information only and are not specific advice, research, or buy or sell recommendations for any individual. Investing involves risk including the potential loss of principal an investor must be willing to bear. Past performance is no guarantee of future results. The presence of this website on the Internet shall in no direct or indirect way raise an implication that Shell Capital Management, LLC is offering to sell or soliciting to sell advisory services to residents of any state in which the firm is not registered as an investment advisor. Use of this website is subject to its terms and conditions.

Pingback: To Know Where You’re Going, Look at Where You’ve Been: The 2018 Year in Review « ASYMMETRY® Observations