In recent conversations with investment advisors, I notice their sentiment has shifted from “cautious and concerned” about world equity markets to “why have they underperformed”. Prior to 2013, most investors and investment advisors were concerned about another 2007 to 2009 level bear market. Now, it seems that caution has faded. Today, many of them seem to be focused on the strong trend of U.S. stocks since mid-2013 and comparing everything else to it.
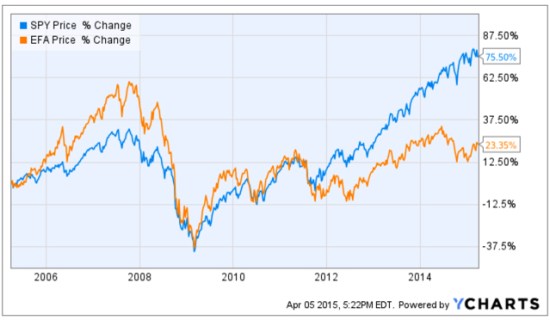
Prior to October 2007, International stocks were in significantly stronger positive directional trends than U.S. Stocks. I’ll compare the S&P 500 stock index (SPY) to Developed International Countries (EFA). We can visually observe a material change between these markets before 2008 and after, but especially after 2013. That one large divergence since 2013 has changed sentiment.
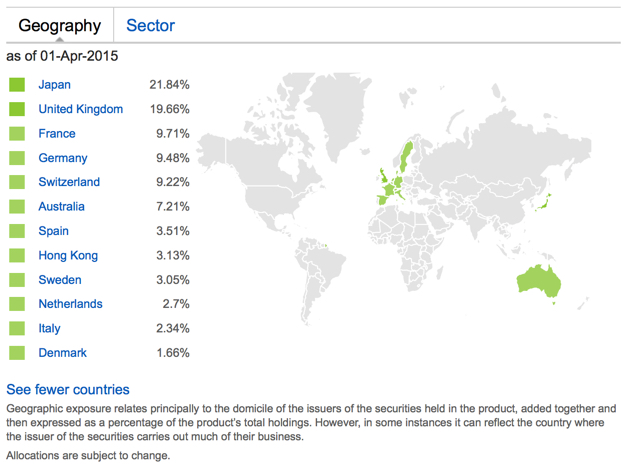
The MSCI EAFE Index is recognized as the pre-eminent benchmark in the United States to measure international equity performance. It comprises the MSCI country indices that represent developed markets outside of North America: Europe, Australasia and the Far East. For a “real life” example of its price trend, I use the iShares MSCI EAFE ETF (EFA). Below are the country holdings, to get an idea of what is considered “developed markets”.

Source: https://www.ishares.com/us/products/239623/EFA
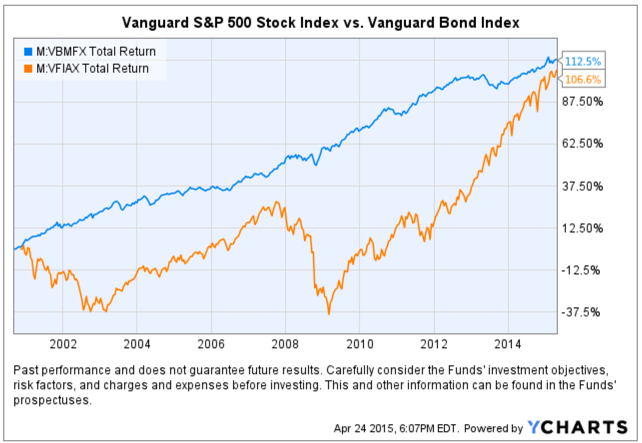
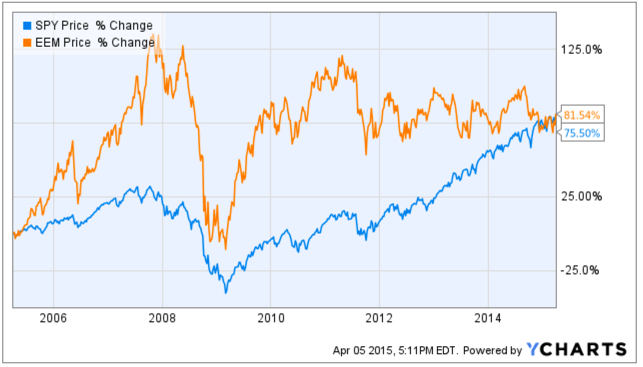
Below are the price trends of the popular S&P 500 U.S. stock index and the MSCI Developed Countries Index over the past 10 years. Many investors may have forgotten how strong international markets were prior to 2008. Starting around 2012, the U.S. stock market continued to trend up stronger than international stocks. It’s a tale of two markets, pre-2008 and post-2008.
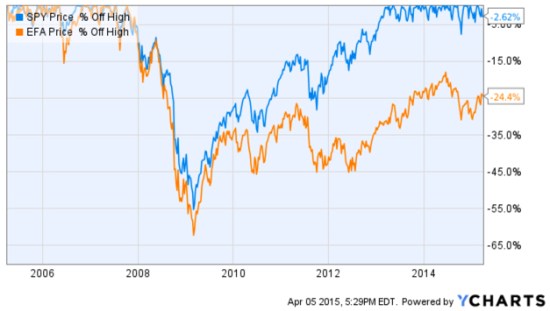
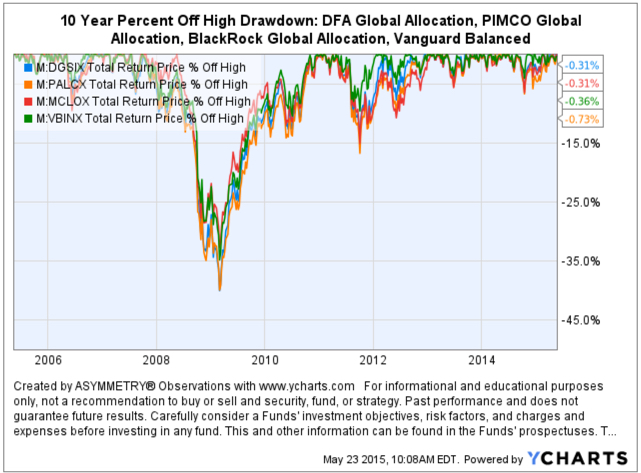
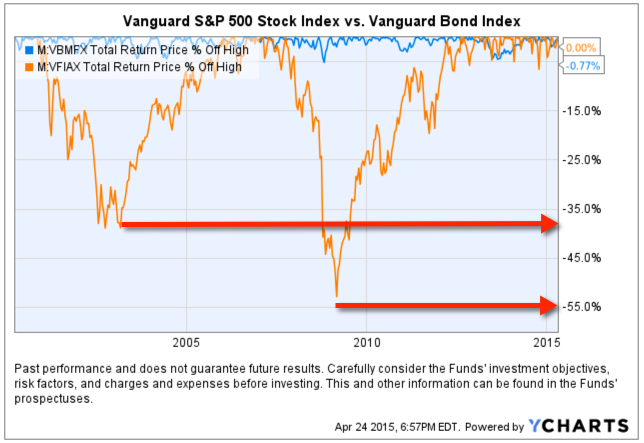
No analysis of a trend % change is complete without also examining its drawdowns along the way. A drawdown measures a drop from peak to bottom in the value of a market or portfolio (before a new peak is achieved). The chart below shows these indexes % off their prior highs to understand their historical losses over the period. For example, these indexes declined -55% or more. The International stock index nearly declined -65%. The S&P 500 U.S. stock index didn’t recover from its decline that started in October 2007 until mid-2012, 5 years later. The MSCI Developed Countries index is still in a drawdown! As you can see, EFA is -24% off it’s high reached in 2007. Including these international countries in a global portfolio is important as such exposure has historically provided greater potential for profits than just U.S. stocks, but more recently they have been a drag.
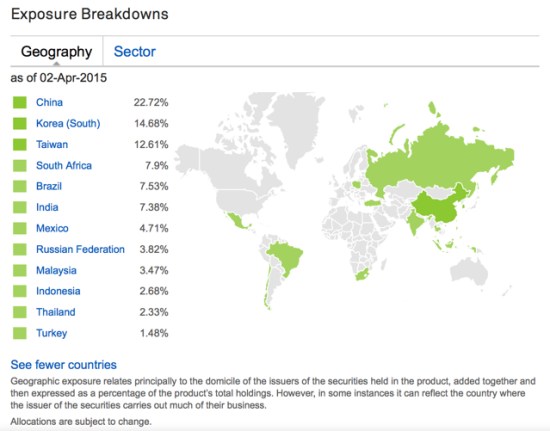
 The International stock markets are divided broadly into Developed Markets we just reviewed and Emerging Countries. The iShares MSCI Emerging Markets ETF (EEM) tracks this index. To get an idea of which countries are considered “Emerging Markets’, you can see the actual exposure below.
https://www.ishares.com/us/products/239637/EEM?referrer=tickerSearch
The Emerging Countries index has reached the same % change over the past decade, but they have clearly taken very different paths to get there. Prior to the “global crisis” that started late 2007, many investors may have forgotten that Emerging Markets countries like China and Brazil were in very strong uptrends. I remember this very well; as a global tactical trader I had exposure to these countries which lead to even stronger profits than U.S. markets during that period. Since 2009, however, Emerging Markets recovered sharply but as with U.S. stocks: they have trended up with great volatility. Since Emerging Markets peaked around 2011 they have traded in a range since. However, keep in mind, these are 10-year charts, so those swings up and down are 3 to 6 months. We’ll call that “choppy”. Or, 4 years of a non-trending and volatile state.

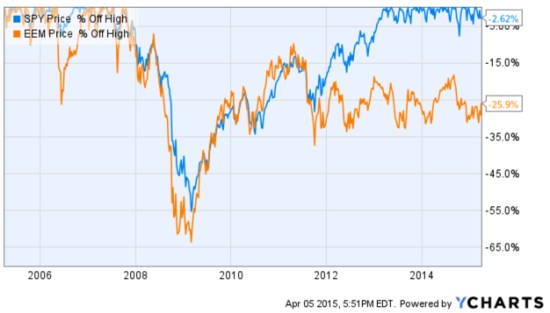
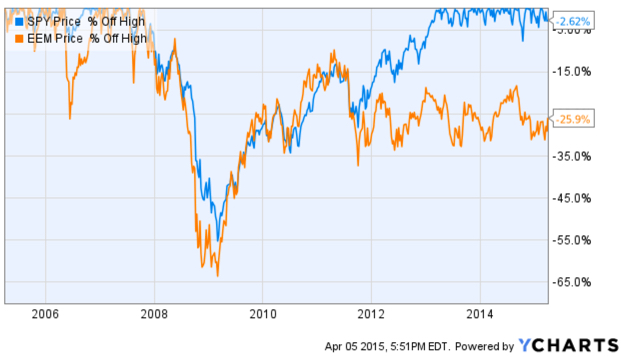
Once again, no analysis of a trend % change is complete without also examining its drawdowns along the way. A drawdown measures a drop from peak to bottom in the value of a market or portfolio (before a new peak is achieved). The chart below shows these indexes % off their prior highs to understand their historical losses over the period. For example, these indexes declined -55% or more. The Emerging Market stock index declined -65%. The S&P 500 U.S. stock index didn’t recover from its decline that started in October 2007 until mid-2012, 5 years later. The MSCI Emerging Countries index is still in a drawdown! As you can see, EFA is -26% off it’s high reached in 2007. As I mentioned before, it recovered sharply up to 2011 but has been unable to move higher in 4 years. Including these Emerging Markets countries in a global portfolio is important as such exposure has historically provided greater potential for profits than just U.S. stocks, but more recently they have been a drag.
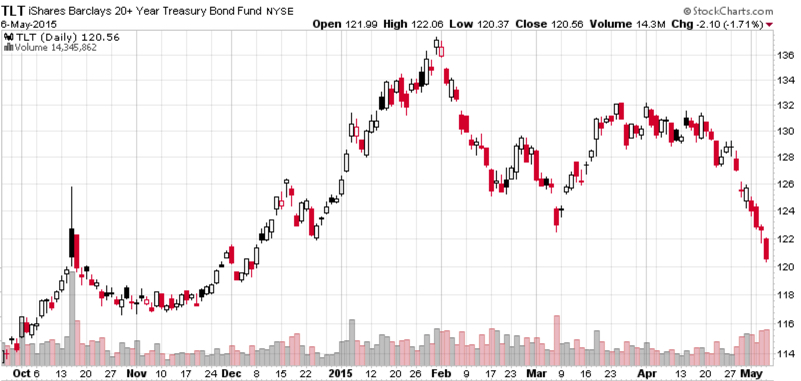
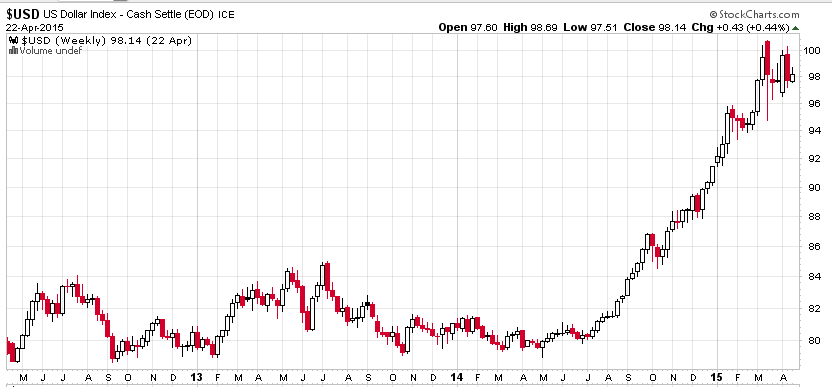
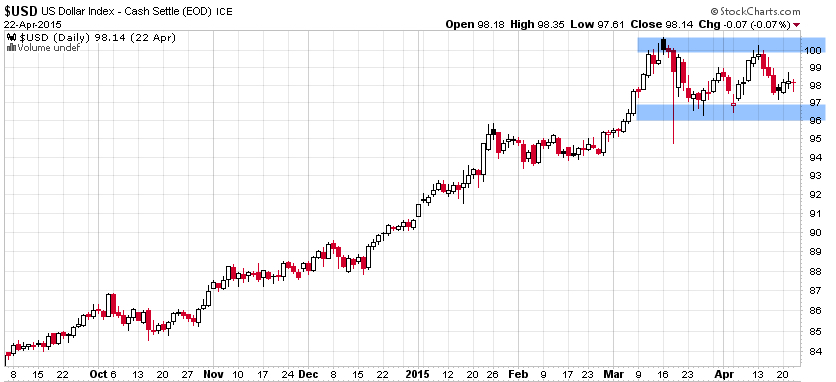
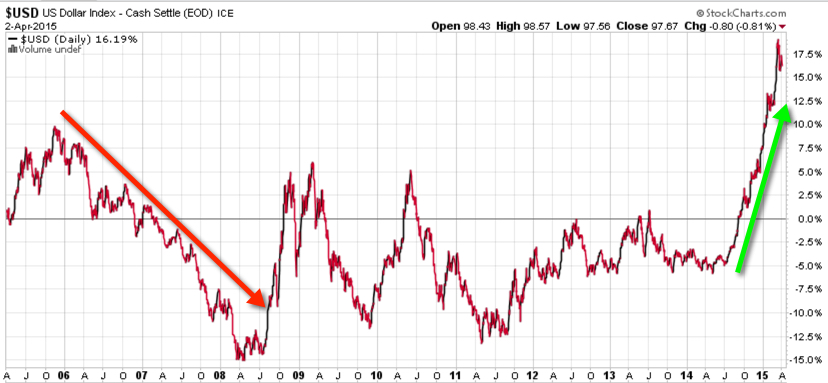
Wondering why the tale of two markets before and after 2008? The are many reasons and return drivers. One of them can be seen visually in the trend of the U.S. Dollar. Below is a 10-year price chart of the U.S. Dollar index. Before 2008, the U.S. Dollar was falling, so foreign currencies were rising as were foreign stocks priced in Dollars. As with most world markets, even the U.S. Dollar was very volatile from 2008 through 2011. After 2011 it drifted in a tighter range through last year and has since increased sharply.

The funny thing is, I’ve noticed there are a lot of inflows into currency-hedged ETFs recently. Investors seem to do the wrong thing at the wrong time. For example, they’ll want to hedge their currency risk after it already happened, not before… It’s just like with options hedging: Investors want protection after a loss, not before it happens. Or, people will buy that 20 KW generator for their home after they lose power a few days, not before, and may not need it again for 5 years after they’ve stopped servicing it. So, it doesn’t start when they need it again.
You can probably see why I think it’s an advantage to understand how world markets interact with each other and it’s an edge for me.
Mike Shell is the Founder and Chief Investment Officer of Shell Capital Management, LLC, and the portfolio manager of ASYMMETRY® Global Tactical.
The observations shared on this website are for general information only and are not specific advice, research, or buy or sell recommendations for any individual. Investing involves risk including the potential loss of principal an investor must be willing to bear. Past performance is no guarantee of future results. The presence of this website on the Internet shall in no direct or indirect way raise an implication that Shell Capital Management, LLC is offering to sell or soliciting to sell advisory services to residents of any state in which the firm is not registered as an investment advisor. Use of this website is subject to its terms and conditions.


You must be logged in to post a comment.